On pages 2086 and 2089 in the 15 March 2000 issue, there are errors in Figure 1 and Figure 5. Inaccuracies in Figure 1A and Figure 5 originated from mistakes made inadvertently during the “cut and assembly” phase of Western blot images preparation. Repeated experiments, shown in the figures below, confirmed the original results. The corrected Figure 1 and Figure 5 and their revised legends are shown.
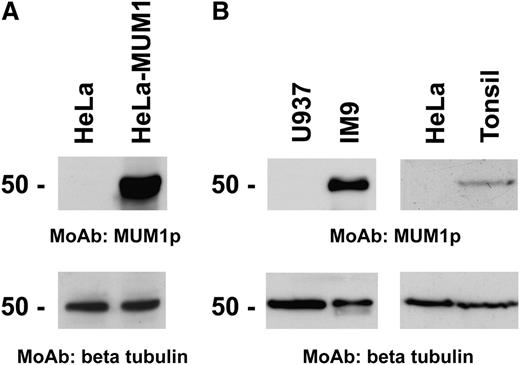
Western blotting with the MUM1p monoclonal antibody. (A) A band of ∼50-kd of the expected size of MUM1-myc protein is seen in the line corresponding to pCEP4-MUM1-myc HeLa-transfected cells (HeLa-MUM1) but not in negative control HeLa cells. Tubulin levels are shown below as control for the amount of the loaded protein. (B) A 50-kd band of the expected molecular size of the MUM1 protein is seen in lanes 2 and 4, corresponding to the IM9 myeloma cell line and normal tonsil. No bands are detected in lanes 1 and 3, corresponding to U937 and HeLa cell lines. Identical results (not shown) were obtained with the monoclonal (clone MUM97) and polyclonal anti-IRF4/ICSAT antibody. In both experiments, β-tubulin levels are shown below to control for the integrity and amount of the loaded protein.
Western blotting with the MUM1p monoclonal antibody. (A) A band of ∼50-kd of the expected size of MUM1-myc protein is seen in the line corresponding to pCEP4-MUM1-myc HeLa-transfected cells (HeLa-MUM1) but not in negative control HeLa cells. Tubulin levels are shown below as control for the amount of the loaded protein. (B) A 50-kd band of the expected molecular size of the MUM1 protein is seen in lanes 2 and 4, corresponding to the IM9 myeloma cell line and normal tonsil. No bands are detected in lanes 1 and 3, corresponding to U937 and HeLa cell lines. Identical results (not shown) were obtained with the monoclonal (clone MUM97) and polyclonal anti-IRF4/ICSAT antibody. In both experiments, β-tubulin levels are shown below to control for the integrity and amount of the loaded protein.
MUM1 expression in normal activated T cells. A 50-kd band of the expected molecular size of the MUM1 protein is seen in lanes (+) corresponding to PHA-stimulated peripheral blood T cells (at days 1, 3, and 4), whereas no band is observed in lanes (–) corresponding to T cells under basal conditions (Western blotting with the MUM1p monoclonal antibody). β-tubulin levels are shown below as control for the amount of the loaded protein.
MUM1 expression in normal activated T cells. A 50-kd band of the expected molecular size of the MUM1 protein is seen in lanes (+) corresponding to PHA-stimulated peripheral blood T cells (at days 1, 3, and 4), whereas no band is observed in lanes (–) corresponding to T cells under basal conditions (Western blotting with the MUM1p monoclonal antibody). β-tubulin levels are shown below as control for the amount of the loaded protein.


This feature is available to Subscribers Only
Sign In or Create an Account Close Modal