Key Points
Comparative global gene expression analysis of primary murine primitive, fetal definitive, and adult definitive erythroid precursors.
Primitive erythroblasts contain and accumulate high ROS levels and uniquely express the H2O2 transporting aquaporins 3 and 8.
Abstract
Erythroid ontogeny is characterized by overlapping waves of primitive and definitive erythroid lineages that share many morphologic features during terminal maturation but have marked differences in cell size and globin expression. In the present study, we compared global gene expression in primitive, fetal definitive, and adult definitive erythroid cells at morphologically equivalent stages of maturation purified from embryonic, fetal, and adult mice. Surprisingly, most transcriptional complexity in erythroid precursors is already present by the proerythroblast stage. Transcript levels are markedly modulated during terminal erythroid maturation, but housekeeping genes are not preferentially lost. Although primitive and definitive erythroid lineages share a large set of nonhousekeeping genes, annotation of lineage-restricted genes shows that alternate gene usage occurs within shared functional categories, as exemplified by the selective expression of aquaporins 3 and 8 in primitive erythroblasts and aquaporins 1 and 9 in adult definitive erythroblasts. Consistent with the known functions of Aqp3 and Aqp8 as H2O2 transporters, primitive, but not definitive, erythroblasts preferentially accumulate reactive oxygen species after exogenous H2O2 exposure. We have created a user-friendly Web site (http://www.cbil.upenn.edu/ErythronDB) to make these global expression data readily accessible and amenable to complex search strategies by the scientific community.
Introduction
RBCs constitute an estimated 1 in 4 cells in the body and are necessary for tissue oxygen delivery. In the adult, RBCs are produced primarily in the BM where lineage-committed progenitors give rise to morphologically identifiable precursors. Erythroid precursors physically associate with macrophages and undergo several maturational cell divisions characterized by a progressive decrease in cell size, nuclear condensation, hemoglobin accumulation, and loss of RNA content.1 These physical changes have been used to classify erythroid precursors into proerythroblast, basophilic, polychromatophilic, and orthochromatic erythroblast maturational stages. In mammals, orthochromatic erythroblasts enucleate to form reticulocytes that ultimately enter the circulation and complete their maturation.
Erythroid cells are a critical component of the cardiovascular network, which constitutes the first functional organ system in the mammalian embryo.2 “Primitive” erythroid cells first emerge in yolk sac blood islands.3 We previously determined that primitive erythroid cells originate from a transient wave of committed progenitors in the yolk sac and mature as a semisynchronous cohort in the bloodstream, undergoing morphologic changes similar to those observed in definitive erythroid precursors within the fetal liver or postnatal BM, including their enucleation to form reticulocytes.4-6 Despite these similarities, primitive and definitive erythroid cells have marked differences in cell size and globin gene expression. Extant global gene-expression studies of erythroid cells have focused on in vitro maturation of immortalized cell lines or primary progenitors or in vivo derived erythroid cells from a single erythroid lineage.7-13 However, little is known about what distinguishes primitive and definitive erythroid lineages at the molecular level.
In the present study, we combined developmental and maturational approaches to compare global gene expression in primary primitive and definitive erythroid cells. Primitive, fetal definitive, and adult definitive populations of erythroid precursors at morphologically equivalent stages of maturation were purified by FACS from mouse embryos, fetuses, and adults. We found that most genes active in erythroid cells are already expressed by the proerythroblast stage, but are then regulated in complex patterns during terminal maturation. Analysis of gene usage reveals a set of “core” tissue-restricted, nonhousekeeping genes that are expressed in all erythroid lineages. However, functional annotation shows that primitive and definitive erythroid lineages use different genes within shared functional categories, as exemplified by the differential expression of aquaporin gene family members. A user-friendly Web site (http://www.cbil.upenn.edu/ErythronDB) has been created to make these comparative data readily accessible to the scientific community.
Methods
Isolation of primary embryonic, fetal, and adult erythroid cell populations
The University of Rochester Committee on Animal Resources approved all of the experiments involving animals for this research. BM was obtained from adult female ICR mice (Taconic) killed by CO2 inhalation. Embryonic and fetal tissues were obtained from timed pregnant ICR mice as described previously.4,6 At specified times during gestation, embryonic tissues were dissected in PB2 (Dulbecco PBS; Gibco-BRL), 0.3% BSA (Gemini Bio-Products), 0.68mM CaCl2 (Sigma-Aldrich), 0.1% glucose),and 12.5 μg/mL of heparin.14 Embryonic day (E) 9.5 yolk sacs and E14.5 fetal livers were dissociated into single cells by trypsin and gentle trituration, respectively.
Five replicates of 4 comparable maturational stages from primitive, fetal definitive, and adult definitive erythroid cells were obtained for transcriptome analysis using a FACSAria cell sorter (BD Biosciences). Because primitive erythroid cells mature as a semisynchronous cohort,6 progressive stages of maturation were isolated from E9.5, E10.5, E12.5, and E15.5 embryos after staining with APC-Ter119 (eBiosciences) and Hoechst 33342 (Sigma-Aldrich; see Figure 1 for sort strategy). Definitive erythroblasts were isolated from E14.5 liver and adult BM after staining with 12.5 nL/106 cells of Vybrant Violet (Invitrogen); Thiazole Orange (Sigma-Aldrich); PE-Cy5.5 CD44, PE-CD71, PE-Cy5 CD117, and APC-Ter119 (eBiosciences); and forward and side scatter (FSC/SSC) characteristics. Propidium iodide (Invitrogen) was used to exclude dead cells. Fetal and adult definitive reticulocytes were isolated by FACS from E15.5 blood and adult BM, respectively, using Ter119 surface expression, Thiazole Orange staining, lack of Vybrant Violet staining, and FSC/SSC characteristics (see Figure 1). Additional details of the cell staining protocol are provided in supplemental Methods (see the Supplemental Materials link at the top of the article). Discontinuous gating was used to ensure purity of the isolated samples, which we estimate at > 95% by postsort morphologic analysis of cytospun cells stained with Wright-Giemsa (Sigma-Aldrich). We observed no deleterious effect of the nucleic acid–binding dyes on cell yield or viability (data not shown). Cells were photographed using a Nikon Optiphot microscope (40× objective, numeric aperture 0.60) and SPOT RT-slider digital camera (Diagnostic Instruments). Images were processed in Adobe Photoshop CS4 software.
Microarray data acquisition and analysis
RNA from each of the FACS-purified cell populations was prepared using RNeasy Plus with Qiashredder and gDNA columns to remove DNA according to the manufacturer's instructions (QIAGEN). 18S RNA and globin gene expression were analyzed by quantitative PCR (qPCR; iCycler; Bio-Rad) in all 60 samples to estimate RNA yield and erythroid cell maturity and purity, respectively.15 cDNA was generated from 2 ng of total RNA using the Ovation Biotin RNA Amplification and Labeling system (NuGen) at the Environmental and Occupational Health Sciences Institute at Rutgers, NJ. After fragmentation and biotin labeling, all samples were hybridized to the same lot of Affymetrix Mouse Genome 230 2.0 arrays (Affymetrix). Quantification of target hybridization were performed with an Affymetrix GeneChip Scanner.16
Normalization of expression data from maturing erythroblasts is challenging because of their marked decrease in RNA content during maturation.17 Because ribosomes quantitatively reflect the capacity of cells to translate mRNA, we chose to normalize gene expression data to 18S RNA content, thus normalizing to translational capacity rather than cell number. Analysis of the entire dataset revealed the highest interreplicate correlation after normalization with GC-RMA18 compared with other normalization methods (data not shown). Furthermore, compared with RMA and MAS5 normalization algorithms, the GC-RMA algorithm provided the best match to the qPCR data of genes such as GAPDH, which are commonly used for normalization of qPCR data (supplemental Figure 1). After normalization, hierarchical cluster analysis was performed in R Version 2.10.1 software.19 Microarray data were analyzed with GeneSpringGX 10 software (Agilent Technologies). Analyses of lineage-restricted genes were restricted to probe sets expressed in the upper 99.5% of the quantifiable range of the Affymetrix gene chips after removing saturated globin genes and suspected contaminant probe sets (see “Contaminant identification”). A total of 12 771 of the 30 362 probe sets called present by MAS520 were expressed in the upper 99.5% of the detectable range in at least 1 of the 4 stages from primitive, fetal liver definitive, or adult BM definitive erythroid samples. We imposed this filter so that the fold changes among very rare transcripts would not skew interpretation of the results and our interpretations would therefore reflect analysis of more abundant transcripts (supplemental Figure 2). Transcription factors annotated with GO:0003700 that met the minimum expression filter described 2 sentences above were analyzed using PaGE (Patterns for Gene Expression, http://www.cbil.upenn.edu/PaGE/). Functional annotation and pathway analyses were conducted using DAVID Bioinformatics Resources Version 6.7 software packages21,22 and Ingenuity Pathway Analysis (Ingenuity Systems, www.ingenuity.com). Raw data in MIAME standard were deposited and are available for download in the publicly accessible ArrayExpress archive (accession E-MTAB-1035).
Tissue specificity
Shannon entropy is a measure of the complexity of a data series. Genes expressed in many or all tissues have a higher measure of entropy than genes expressed in one or a few tissues. We used Shannon entropy to identify genes more widely expressed in adult mouse tissues from more tissue-restricted genes.23,24 Shannon entropy values ranged from 0.18-5.24; the empirically determined cutoff of ≥ 5.00 designated approximately 60% of erythroid genes as being widely expressed.
Contaminant identification
The presence of α-fetoprotein and transthyretin transcripts in some of the primitive erythroid samples derived from E9.5 and E10.5 yolk sacs suggested the presence of visceral endoderm contamination.25 Likewise, the presence of the mast cell– and lymphoid-specific transcripts in some adult BM samples suggested contamination with nonerythroid hematopoietic cells. To identify other likely contaminants, we first identified 59 sentinel contaminants (supplemental Table 1) representing tissue-specific genes expressed at high levels in visceral endoderm (yolk sac), hepatocytes (fetal liver), and myeloid and lymphoid cells (BM). Taking advantage of different contaminant levels for each of these genes among the 5 replicates from each of our 12 samples, Pearson correlation was used to find transcripts with similar expression “fingerprints” to the 59 sentinel contaminants (supplemental Table 2). A total of 264 probe sets identified as likely contaminants using a Pearson correlation setting at 0.9 were excluded from the functional annotation analysis.
Gene-expression analysis
qPCR reactions for Cited2, Sox6, aquaporins, and GAPDH were performed as described previously using the iCycler (Bio-Rad) and the primer sets and temperatures listed in supplemental Table 3. In situ hybridization of Cited2 and an exon1E-specific probe of Sox6 was performed as described previously and micrographs were captured using a Nikon Eclipse 80i microscope with 4×/0.13 or 10×/0.30 NA objectives with a Hamamatsu Orca R2 camera. Images were processed in Photoshop CS4 and pseudocolored (brightfield blue, positive signal darkfield silver grains red) and merged.15,25
Analysis of ROS content in erythroid cells
Reactive oxygen species (ROS) levels were detected using CM-H2DCFDA (Invitrogen) in freshly isolated and H2O2-treated primitive and definitive murine erythroid cells as described previously.26,27 E10.5 (APC-Ter119+) primitive erythroblasts, adult marrow (FSC-mid, APC-Ter119+, Draq5+) definitive erythroblasts, and adult peripheral (APC-Ter119+) RBCs were isolated by FACS and incubated with 0.3μM or 1μM H2O2 for 15 minutes. ROS levels were quantitated using an LSR II flow cytometer (BD Biosciences).
Results
Isolation of primitive and definitive erythroid cell populations at progressive stages of terminal maturation
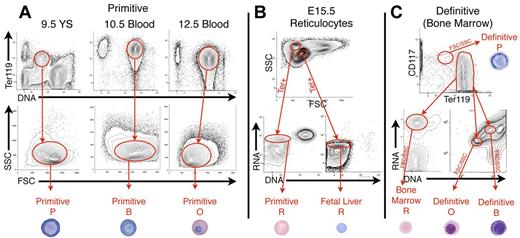
To provide a comprehensive toolbox of erythroid gene expression during terminal maturation throughout ontogeny, we isolated primary erythroid precursors at comparable stages of maturation from mouse embryos, fetuses, and adults. Specifically, primitive proerythroblasts, basophilic erythroblasts, polychromatophilic/orthochromatic erythroblasts, and reticulocytes were isolated by FACS from E9.5 yolk sacs and E10.5, E12.5, and E15.5 blood, respectively, using FSC/SSC characteristics, Ter119 expression, and DNA/RNA content (Figure 1A-B and supplemental Figure 3). To distinguish these same maturational stages in the BM, we made use of: (1) FSC/SSC characteristics, (2) surface expression of Ter119 and Kit (CD117), (3) RNA content quantified by Thiazole Orange staining, and (4) nuclear presence and degree of condensation assessed by the accessibility of the DNA dye Vybrant Violet (Figure 1C and supplemental Figure 3). This morphology-driven strategy incorporates measures of nuclear condensation and RNA content used classically to distinguish these morphologically defined stages of erythroid precursor maturation. We have used these parameters previously to define erythroid precursor stages using an analytical imaging flow cytometry platform.28 The same approach was used to isolate definitive erythroid precursors and reticulocytes from the E14.5 fetal liver and E15.5 bloodstream, respectively (Figure 1B, supplemental Figure 3, and data not shown).15 Representative cells of each maturational stage are shown at the bottom of Figure 1. This morphology-based approach optimizes separation of the basophilic and polychromatophilic/orthochromatic erythroblast precursor populations compared with the CD71/Ter119/FSC29 or CD44/Ter19/FSC30 surface marker strategies (compare Figure 1C bottom right panel B vs O with supplemental Figure 4B,D green vs purple.) Using our morphology-based FACS strategy, 5 independent replicates of 4 maturational stages from primitive, fetal definitive, and adult definitive erythropoiesis were obtained for global gene-expression analysis using the Affymetrix GeneChip Mouse Genome 430 2.0 Array platform.
Isolation of primitive and definitive erythroid cells at specific stages of maturation. (A) Because primitive erythroid cells mature semisynchronously, progressive cell stages were isolated from E9.5 yolk sacs (proerythroblasts, P), E10.5 blood (basophilic erythroblasts, B), E12.5 blood (polychromatic/orthochromatic erythroblasts, O), and E15.5 blood (reticulocytes, R, using Ter119 expression, DNA content, and FSC/SSC characteristics. (B) Co-circulating primitive and fetal definitive reticulocytes were isolated from E15.5 blood using FSC/SSC characteristics, Ter119 expression, RNA content (Thiazole Orange, TO), and lack of DNA (VybrantViolet, VV), as described previously.15 (C) Definitive erythroblasts were isolated from BM (shown) and fetal liver (not shown), using Ter119lokit+ for P, Ter119+, VVhigherTOhigher for B, VVlowerTOlower for O, and Ter119+TO+VV− for R. A representative example of each primitive and definitive erythroid cell is shown.
Isolation of primitive and definitive erythroid cells at specific stages of maturation. (A) Because primitive erythroid cells mature semisynchronously, progressive cell stages were isolated from E9.5 yolk sacs (proerythroblasts, P), E10.5 blood (basophilic erythroblasts, B), E12.5 blood (polychromatic/orthochromatic erythroblasts, O), and E15.5 blood (reticulocytes, R, using Ter119 expression, DNA content, and FSC/SSC characteristics. (B) Co-circulating primitive and fetal definitive reticulocytes were isolated from E15.5 blood using FSC/SSC characteristics, Ter119 expression, RNA content (Thiazole Orange, TO), and lack of DNA (VybrantViolet, VV), as described previously.15 (C) Definitive erythroblasts were isolated from BM (shown) and fetal liver (not shown), using Ter119lokit+ for P, Ter119+, VVhigherTOhigher for B, VVlowerTOlower for O, and Ter119+TO+VV− for R. A representative example of each primitive and definitive erythroid cell is shown.
Overall quality and reproducibility of the erythroid datasets
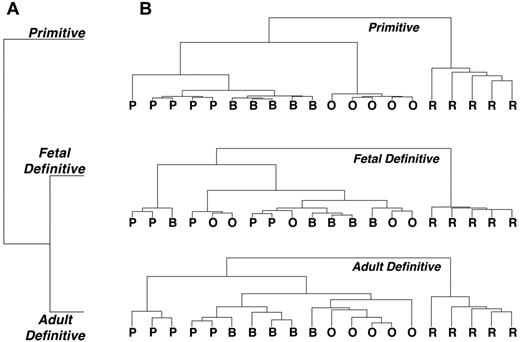
Hierarchical cluster analysis was used to determine the overall characteristics and quality of the erythroid expression data. As expected, the 2 (fetal and adult) definitive erythroid datasets clustered closer to each other than to the primitive erythroid samples (Figure 2A). Cluster analysis indicated that the maturational stages are distinct from each other in both the primitive and in the adult definitive erythroid lineages (Figure 2B). Although the fetal liver–derived definitive reticulocytes are well separated from the erythroblast stages, the replicates for the nucleated erythroid precursor stages had gene-expression profiles that intermixed (Figure 2B), perhaps reflecting rapid maturation during the massive expansion of the fetal erythroid niche. The reticulocyte stage is most different from the nucleated erythroblast stages for all 3 erythroid datasets (Figure 2B). We also compared our primitive erythroid lineage data with a recently published primitive erythroid-specific dataset8 and found excellent agreement with the expression of 10 previously validated genes (supplemental Figure 5), as well as for the 2 primitive erythroid-restricted aquaporin genes discussed below (data not shown).
Clustering diagrams indicating reproducibility of replicate samples. (A) Definitive erythroid lineages cluster more closely to each other than to the primitive erythroid lineage. (B) Reproducibility of primitive and BM definitive erythroid sample replicates clearly separates the replicates by maturational stage. Fetal definitive erythroid replicate samples are less clearly resolved, with only the reticulocyte stage clearly separated from the erythroblast stages. P indicates proerythroblast; B, basophilic erythroblast; O, polychromatophilic/orthochromatic erythroblasts; and R, reticulocyte.
Clustering diagrams indicating reproducibility of replicate samples. (A) Definitive erythroid lineages cluster more closely to each other than to the primitive erythroid lineage. (B) Reproducibility of primitive and BM definitive erythroid sample replicates clearly separates the replicates by maturational stage. Fetal definitive erythroid replicate samples are less clearly resolved, with only the reticulocyte stage clearly separated from the erythroblast stages. P indicates proerythroblast; B, basophilic erythroblast; O, polychromatophilic/orthochromatic erythroblasts; and R, reticulocyte.
Analysis of erythroid gene expression during terminal maturation
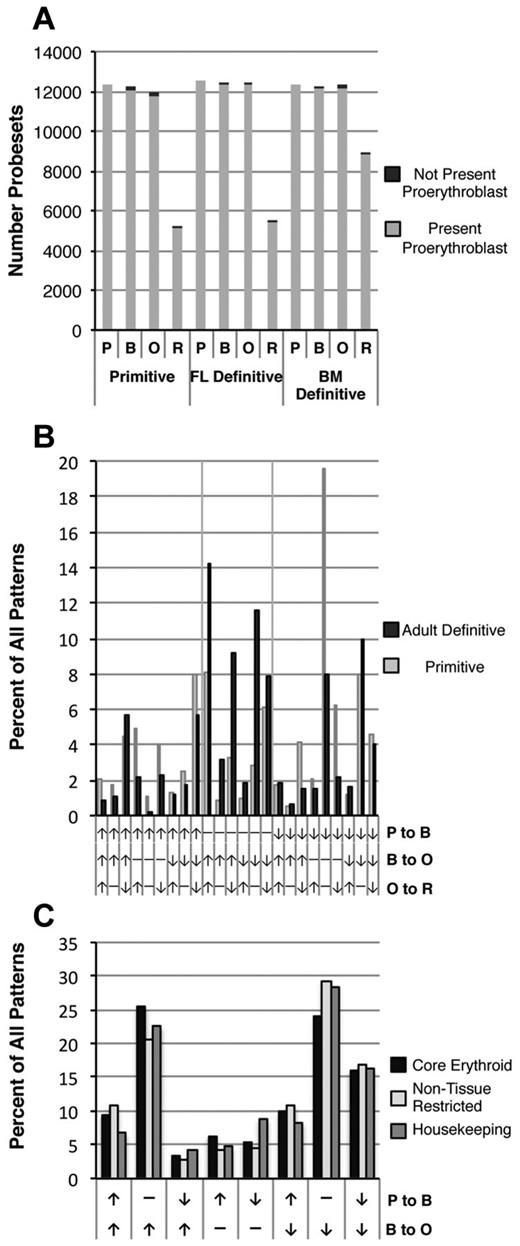
We examined the distribution of transcripts during the cellular progression from the proerythroblast to the reticulocyte stages of maturation. Both in the primitive and in the definitive erythroid lineages, proerythroblasts contain the highest transcript complexity, as shown by the number of different probe sets present (Figure 3A). Surprisingly, a high level of transcript complexity persists throughout erythroblast maturation in both primitive and definitive erythroid lineages, whereas, as expected, reticulocytes contain markedly fewer different transcripts. We investigated whether most of the transcriptional complexity present in proerythroblasts persists or if a large number of new transcripts are expressed as maturation proceeds. The dark bars in Figure 3A indicate probe sets absent in proerythroblasts but present at later stages of maturation (Figure 3A). These probe sets, representing less than 3% of the 12 000 probe sets present in proerythroblasts, were annotated using DAVID22,31 and were found in a variety of functional categories, including protein ubiquitination and catabolism, chromatin modification, and apoptosis (not shown).
Patterns of gene expression during erythroid precursor maturation. (A) The number of Affymetrix probe sets expressed in each of the 3 erythroid datasets is similar and decreases between the polychromatophilic/orthochromatic erythroblast (O) and reticulocyte (R) stages. Light gray indicates probe sets initially present in proerythroblasts (P), black indicates probe sets present at each subsequent stage that were not present in proerythroblasts. (B) Probe sets were classified by changes in levels between erythroblast stages during primitive erythroid (gray bars) and adult definitive erythroid (black bars) maturation. Twenty-four patterns based on up-regulation (↑), no change (−), or down-regulation (↓) between stages are identified. Vertical grid lines indicate changes between the proerythroblast and basophilic erythroblast stages. Probe sets that did not change among the first 3 stages (−, −, x) are not shown. (C) Comparison of temporal patterns of “core erythroid” (tissue-restricted genes for which expression is shared in the primitive, fetal liver, and adult BM datasets, see “Methods”), “non–tissue-restricted” probe sets (widely expressed in multiple adult tissues, see “Methods”), and housekeeping/maintenance genes35 during erythroid maturation.
Patterns of gene expression during erythroid precursor maturation. (A) The number of Affymetrix probe sets expressed in each of the 3 erythroid datasets is similar and decreases between the polychromatophilic/orthochromatic erythroblast (O) and reticulocyte (R) stages. Light gray indicates probe sets initially present in proerythroblasts (P), black indicates probe sets present at each subsequent stage that were not present in proerythroblasts. (B) Probe sets were classified by changes in levels between erythroblast stages during primitive erythroid (gray bars) and adult definitive erythroid (black bars) maturation. Twenty-four patterns based on up-regulation (↑), no change (−), or down-regulation (↓) between stages are identified. Vertical grid lines indicate changes between the proerythroblast and basophilic erythroblast stages. Probe sets that did not change among the first 3 stages (−, −, x) are not shown. (C) Comparison of temporal patterns of “core erythroid” (tissue-restricted genes for which expression is shared in the primitive, fetal liver, and adult BM datasets, see “Methods”), “non–tissue-restricted” probe sets (widely expressed in multiple adult tissues, see “Methods”), and housekeeping/maintenance genes35 during erythroid maturation.
Because the majority of the transcriptional complexity in proerythroblasts persisted, we next investigated whether these transcripts are differentially regulated or simply decay during erythroid maturation. To this end, we assessed whether transcript levels increased, decreased, or remained constant as cells transitioned from the proerythroblast to the basophilic and polychromatophilic/orthochromatic erythroblast stages in both the primitive and adult definitive erythroid lineages. As shown in Figure 3B and C, a plethora of accumulation patterns occurred, reflecting a diversity of control of transcript accumulation and/or decay rates during terminal maturation. Among this variety of patterns, there were some that were more prevalent. For example, during the transition from proerythroblast to basophilic erythroblast, the primitive erythroid lineage was characterized by more down-regulated transcripts, whereas the adult definitive erythroid lineage maintained more transcripts at the same level (Figure 3B). These dynamic expression kinetics imply that transcript levels are actively regulated during erythroblast maturation and are not subjected to simple global transcriptional down-regulation or decay.
The transition from basophilic erythroblast to orthochromatic erythroblast is characterized by a global reduction of transcription.32-34 To further examine the regulation of transcript levels during late-stage maturation we investigated whether erythroid-restricted transcripts were differentially retained compared with more broadly expressed genes. Shannon entropy measurements were used to distinguish tissue-restricted transcripts from transcripts expressed in a wide variety of tissues.23 A previously defined housekeeping gene set35 was also analyzed. “Core erythroid” genes were defined as transcripts present in all 3 (primitive, fetal definitive, and adult definitive) erythroid datasets that have lower Shannon entropy values, reflecting greater tissue restriction and indicating less likelihood of performing housekeeping function. As shown in Figure 3C, the global reduction of transcription during terminal erythroid maturation was not associated with significant differences in the maintenance of expression of core erythroid versus broadly expressed or housekeeping genes. Therefore, although specific transcripts do increase or decrease in abundance as erythroid maturation proceeds, such variations are not correlated with broadly determined categories of erythroid-restricted versus housekeeping genes. In addition, we examined whether there was a differential accumulation of transcripts containing AU-rich elements in the 3′-untranslated region36 because these are associated with mRNA destabilization as well as globin mRNA stabilization.32 We did not observe preferential accumulation of this set of mRNAs during erythroid maturation (data not shown).
We next investigated whether the loss of 30%-50% of transcript complexity at the reticulocyte stage could be explained by uniform rates of decay that would result in the loss of the least abundant transcripts present in polychromatophilic/orthochromatic erythroblasts. Although many of the more rare transcripts were lost, assuming uniform decay rates, more than 20% of the transcripts expected to be lost after the polychromatophilic/orthochromatic erythroblast stage were still present in reticulocytes. Indeed, a subset of mRNAs was present at similar or higher levels in reticulocytes compared with polychromatophilic/orthochromatic erythroblasts (not shown). This finding implies that some transcripts are preferentially maintained during later stages of terminal erythroid differentiation, perhaps through altered half-lives or rates of transcription.
Comparison of gene expression between primitive and definitive erythroid lineages
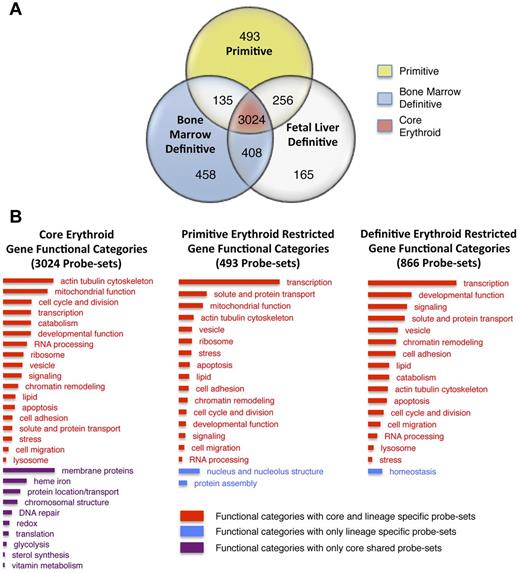
To further characterize primitive versus definitive erythropoiesis, we focused on genes that are more tissue restricted as defined by lower Shannon entropy values23 (see “Tissue specificity”). This constrained the analysis to approximately 5000 probe sets, of which 3024 were present in all 3 erythroid datasets and constituted a population of “core” erythroid genes (Figure 3C and Figure 4A red center). These core erythroid probe sets were annotated using DAVID and coalesced into 31 functional categories (Figure 4B). For example, the Gene Ontology (GO) terms “transcription factor activity,” “transcription coactivator activity,” “positive regulation of DNA binding,” and the Interpro term “Homeodomain related” were from 4 different clusters that were combined under the heading “Transcription.” The probe set IDs and descriptors that constitute each category are available in supplemental Table 4. Core erythroid functional categories were separated into 2 groups. The first group contained functional categories for which no lineage-restricted probe sets were found (Figure 4B purple). These functional categories, which include heme and iron metabolism (eg, transferrin receptor and Alas2), apparently do not require optimization based on developmental stage or maturational niche. The second group contained functional categories for which lineage-restricted subsets of genes were identified (Figure 4B red in first column). These latter functional categories regulate the shape and structure of the cell (eg, Rac2 and annexin A2), cell division (eg, Rad51c and Cep55), and transcription (eg, Sox6 and Cited2).
Functional annotation of the erythroid transcriptomes. (A) Venn diagram indicating lineage restriction of moderate and abundant probe sets. Primitive erythroid probe set expression is exclusive to the primitive erythroid lineage (yellow), adult definitive-restricted probe set expression includes BM erythroid expression as well as probe sets expressed in both the BM and the fetal definitive erythroid lineage (blue). (B) Functional annotation of shared and lineage-restricted probe sets based on DAVID clustering22 were further grouped to reduce complexity. Bar length indicates the relative number of probe sets within each column associated with a functional category. Bar color indicates whether the functional category contains probe sets present in all (core) erythroid cells as well as probe sets restricted to one or both lineages (red), only probe sets found in all erythroid cells (purple), or probe sets restricted to specific lineages (blue). Although the probe sets constituting primitive erythroid, definitive erythroid, and core erythroid functional categories are nonoverlapping, specific probe sets may be listed in more than one functional category. Lists of probe sets that constitute each functional category are available in supplemental Table 4.
Functional annotation of the erythroid transcriptomes. (A) Venn diagram indicating lineage restriction of moderate and abundant probe sets. Primitive erythroid probe set expression is exclusive to the primitive erythroid lineage (yellow), adult definitive-restricted probe set expression includes BM erythroid expression as well as probe sets expressed in both the BM and the fetal definitive erythroid lineage (blue). (B) Functional annotation of shared and lineage-restricted probe sets based on DAVID clustering22 were further grouped to reduce complexity. Bar length indicates the relative number of probe sets within each column associated with a functional category. Bar color indicates whether the functional category contains probe sets present in all (core) erythroid cells as well as probe sets restricted to one or both lineages (red), only probe sets found in all erythroid cells (purple), or probe sets restricted to specific lineages (blue). Although the probe sets constituting primitive erythroid, definitive erythroid, and core erythroid functional categories are nonoverlapping, specific probe sets may be listed in more than one functional category. Lists of probe sets that constitute each functional category are available in supplemental Table 4.
Little is known about gene expression that distinguishes the primitive and definitive erythroid lineages. Of the approximately 5000 tissue-restricted probe sets, in the present study, we identified 493 primitive erythroid-restricted probe sets and 866 adult definitive-restricted probe sets. We functionally annotated these probe sets (Figure 4A yellow vs blue regions) using DAVID 6.7 and categorized them as described above (Figure 4B middle and right columns). This analysis indicated that there are few erythroid lineage-restricted functional categories (Figure 4B blue categories) and the bulk of the lineage-restricted complexity can be categorized into shared functional categories (Figure 4B red categories). We conclude that the majority of core erythroid and lineage-restricted genes are found in functional categories that are shared by the primitive and definitive erythroid lineages.
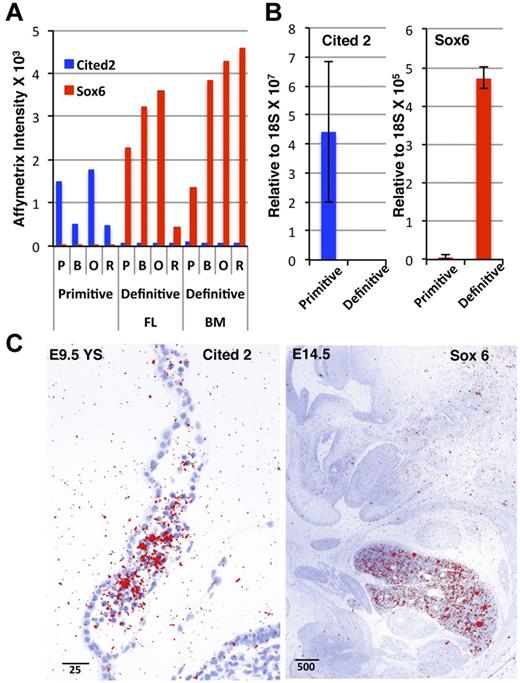
The functional category “transcription,” encompassing not only transcription factors but also those genes that support transcriptional activity (eg, regulation of DNA binding and transcription coactivator activity), contained the highest number of lineage-restricted probe sets (Figure 4B and supplemental Table 4). We identified several transcriptional regulators differentially expressed in the primitive and definitive erythroid lineages (Table 1, supplemental Table 5, and supplemental Figure 6). We corroborated the differential temporal and spatial expression of 2 transcription factors, Cited2 and Sox6, using both qPCR and in situ hybridization (Figure 5A-B). Cited2, a transcriptional coactivator downstream of erythropoietin and Stat signaling,37 was expressed in primitive erythroblasts in E9.5 yolk sacs (Figure 5C). The definitive erythroid-restricted transcription factor Sox638 was specifically expressed in the liver, the site of definitive erythroid maturation in the E14.5 mouse embryo (Figure 5C). The expression levels of additional core (Klf1, Gata1, Foxn2, and Nfe2), definitive erythroid-specific (Myb, Nr3c1, Cebpa, and Irf9) and primitive erythroid–specific (Pbx1, Arid3a, Foxh1, and Pdlim7) transcription factors are shown in supplemental Figure 6. Although many of these transcription factors are known to be involved in erythropoiesis, several are novel and remain to have their expression and function explored in erythroid maturation.
Select transcription factors from core erythroid, primitive erythroid–enriched, and definitive erythroid–enriched probe sets
| Core . | Primitive . | Adult definitive . | |||
|---|---|---|---|---|---|
| Gene name . | Fold enriched* . | Gene name . | Fold enriched* . | Gene name . | Fold enriched* . |
| Klf1 | 1.4 | Pbx1 | 63 | Sox6 | 29 |
| Nfe2 | 1.4 | Foxh1 | 61 | Nr3c1 | 28 |
| Foxn2 | 1.1 | Arid3a | 22 | Cebpa | 27 |
| Gata1 | 1 | Pdlim7 | 13 | Myb | 22 |
| Hif1a | 0.4 | Cited2 | 12 | Irf9 | 13 |
Fold enrichment was calculated as the mean enrichment for proerythroblast, basophilic erythroblast, and polychromatophilic/orthochromatic erythroblast stages. Fold enrichment for the core erythroid subset represents the adult definitive/primitive erythroid ratio.
Erythroid lineage-restricted expression patterns of Cited2 and Sox6. (A) Affymetrix intensity indicates erythroid lineage–restricted expression of the transcription factors Cited2 and Sox6. (B) qPCR quantitation of Cited2 and Sox6 expression in primitive basophilic erythroblasts from E10.5 blood and definitive basophilic erythroblasts from adult BM. (C) In situ hybridization reveals Cited2 expression in primitive erythroid cells within the blood islands of the E9.5 yolk sac (left) and Sox6 exon 1E expression in the E15.5 fetal liver.
Erythroid lineage-restricted expression patterns of Cited2 and Sox6. (A) Affymetrix intensity indicates erythroid lineage–restricted expression of the transcription factors Cited2 and Sox6. (B) qPCR quantitation of Cited2 and Sox6 expression in primitive basophilic erythroblasts from E10.5 blood and definitive basophilic erythroblasts from adult BM. (C) In situ hybridization reveals Cited2 expression in primitive erythroid cells within the blood islands of the E9.5 yolk sac (left) and Sox6 exon 1E expression in the E15.5 fetal liver.
Aquaporin genes are differentially expressed in primitive versus definitive erythropoiesis
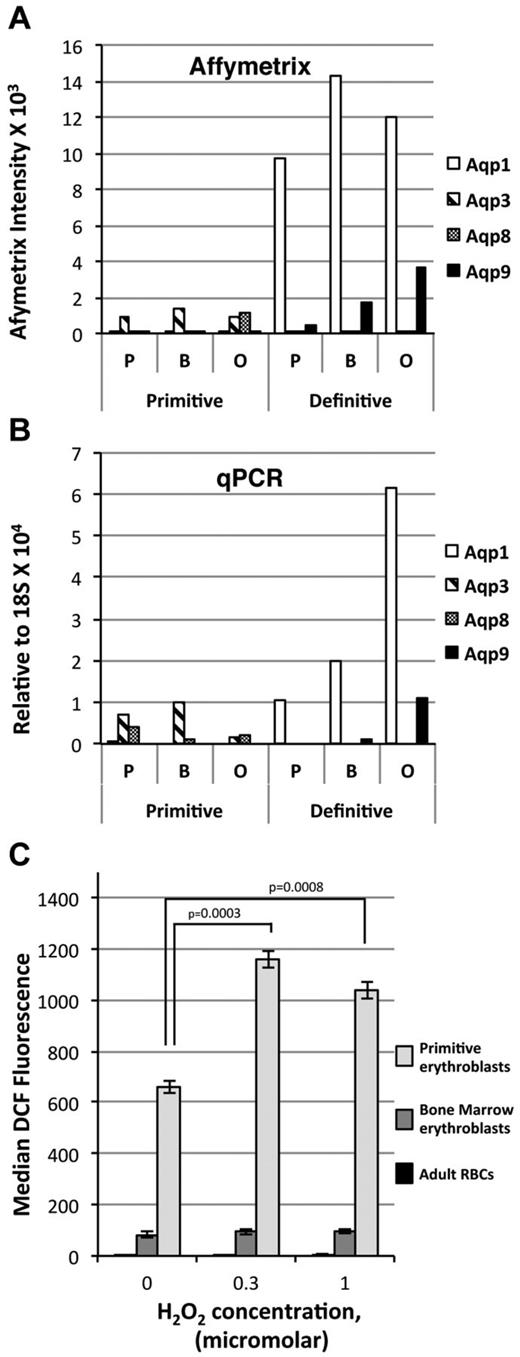
The functional category “solute and protein transport” includes the aquaporin gene family that consists of integral membrane proteins that transport water. Members of the aquaporin gene family differentially transport glycerol and other small, uncharged molecules such as CO2, urea, and H2O2.39 We found that primitive and adult definitive erythroid cells expressed different aquaporins (Figure 6A). Specifically, AQP1 and AQP9 are expressed in definitive erythroid cells, whereas AQP3 and AQP8 are expressed in primitive erythroid cells (Figure 6A). These differences, which were predicted from the array analysis, were confirmed by qPCR (Figure 6B). Interestingly, the primitive erythroid–restricted AQP3 and AQP8 are transporters not only of H2O but also of H2O2.40,41 We therefore investigated whether primitive and definitive erythroid precursors differentially accumulate ROS when exposed to exogenous H2O2. Intracellular ROS levels, measured using CM-H2DCFDA,27 were nearly undetectable in adult RBCs at baseline and after exposure to 0.3 and 1μM H2O2 (Figure 6C). Definitive erythroblasts isolated from the BM of adult mice also contained low levels of ROS that did not increase on H2O2 exposure. In contrast, primitive erythroblasts isolated from E10.5 mouse embryos contained markedly elevated levels of ROS at baseline (Figure 6C). Furthermore, exposure of primitive erythroblasts to low levels of exogenous H2O2 led to a large increase in intracellular ROS, which is consistent with the ability of AQP3 and AQP8 to transport H2O2. Our findings indicate that the oxidative state of primary primitive erythroid cells differs from that of definitive erythroid cells despite similar expression levels of the major antioxidant systems present in RBCs: catalase, peroxiredoxin, and glutathione peroxidase (not shown). Primitive erythroid precursors, unlike their definitive counterparts, can accumulate significant amounts of exogenous H2O2, raising the possibility that primitive erythroblasts actively use H2O2 and/or serve as an “ROS sink” to protect the growing embryo in a hypoxic environment.
Differential expression of aquaporin gene transcripts in primitive and adult definitive erythroid cells. Aqp1, Aqp3, Aqp8, and Aqp9 expression in primitive and BM definitive erythroblasts quantitated by Affymetrix intensity (A) and qPCR (B) relative to 18S RN(A) (C). Primitive erythroblasts (E10.5) have higher baseline levels of ROS compared with adult definitive erythroblasts and circulating RBCs. Exogenous H2O2 causes ROS to accumulate in primitive but not definitive erythroblasts.
Differential expression of aquaporin gene transcripts in primitive and adult definitive erythroid cells. Aqp1, Aqp3, Aqp8, and Aqp9 expression in primitive and BM definitive erythroblasts quantitated by Affymetrix intensity (A) and qPCR (B) relative to 18S RN(A) (C). Primitive erythroblasts (E10.5) have higher baseline levels of ROS compared with adult definitive erythroblasts and circulating RBCs. Exogenous H2O2 causes ROS to accumulate in primitive but not definitive erythroblasts.
ErythronDB Web site
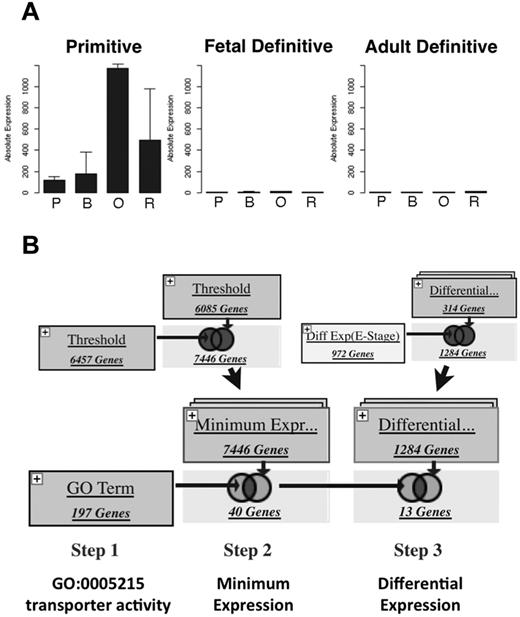
We have created a Web site (http://www.cbil.upenn.edu/ErythronDB) designed to facilitate access to and analysis of the erythroid expression data reported herein. Queries by gene name return the mean expression profile of primitive, fetal liver definitive, and adult BM definitive erythroid datasets, with data for each of 4 maturational stages (Figure 7A and supplemental Figure 7A). Additional information displayed for gene queries include GO terms associated with the queried gene and links to external databases including Mouse Genome Informatics, EntrezGene, and ArrayExpress Gene Atlas. This Web site also facilitates performance of complex search strategies on a variety of expression parameters (eg, stage of maximal expression, pattern of expression, and fold change during maturation) and gene annotations (eg, GO and KEGG pathway inclusion).42 For example, searching for abundant carbonate dehydratases (GO:004089) indicates that carbonic anhydrase 1 is absent during primitive erythroid maturation, whereas carbonic anhydrase 2 is abundantly expressed in both lineages (supplemental Table 6). A search for cell size–associated genes (GO:0008361) indicates that Cln8 and Wdtc1 are more abundantly expressed during late stages of primitive erythroid maturation and E2f4, Vpreb1, Vpreb2 are differentially expressed between primitive and definitive lineages (supplemental Table 6). Searches can also include user-defined lists that can be combined with Boolean logic (Figure 7B and supplemental Figure 7B). Logins are available so that users can save their search history for future reference. This Web site allows scientists without formal training in bioinformatics to explore and construct intuitive searches of these comparative erythroid gene-expression data to facilitate a better understanding of the cellular and molecular underpinnings of mammalian erythropoiesis.
ErythronDB Web site. (A) Expression profile for gene query of Aqp8. P indicates proerythroblast; B, basophilic erythroblast; O, polychromatophilic/orthochromatic erythroblasts; and R, reticulocyte. See supplemental Figure 3A for a complete screen shot. (B) Example of a Boolean search strategy to identify differentially expressed transporter molecules. Gene sets expressed at a threshold level in both populations (top left) are functionally restricted based on GO term (bottom left) and then further limited to gene sets that were differentially expressed (right).
ErythronDB Web site. (A) Expression profile for gene query of Aqp8. P indicates proerythroblast; B, basophilic erythroblast; O, polychromatophilic/orthochromatic erythroblasts; and R, reticulocyte. See supplemental Figure 3A for a complete screen shot. (B) Example of a Boolean search strategy to identify differentially expressed transporter molecules. Gene sets expressed at a threshold level in both populations (top left) are functionally restricted based on GO term (bottom left) and then further limited to gene sets that were differentially expressed (right).
Discussion
The present study is a global gene-expression analysis of both primitive and definitive erythroid precursors in the mouse. Primary cells were isolated from the proerythroblast to the reticulocyte stages of maturation incorporating traditional discriminators of DNA condensation, RNA content, and cell size in the purification strategy. This novel staining and gating strategy provides a correspondence between classic morphologic definitions of erythroid precursors and standard flow cytometry.29,30 This is the first study of erythroid maturation to take a developmental approach specifically comparing gene expression from primary cells of the primitive and definitive erythroid lineages.
Both primitive and definitive erythropoiesis are characterized by the progression of lineage-committed cells from colony-forming progenitors to morphologically identifiable precursors that enucleate to form reticulocytes.1,4,6 Our analysis of gene expression indicates that the majority of genes expressed during terminal stages of erythropoiesis have already been activated by the time erythroid progenitors (BFU-Es and CFU-Es) have transitioned to the precursor stages of differentiation. Nonetheless, terminal maturation is associated with the complex regulation of transcript levels, including differential accumulation and loss of transcripts in all possible temporal patterns. One advantage of such a regulatory model of erythropoiesis is that transcriptional priming at such an early maturational stage might facilitate rapid terminal maturation associated with stress erythropoiesis. In fact, we have found that after genotoxic injury, a wave of proerythroblasts within the murine BM transition to orthochromatic erythroblasts in just 48 hours.43
A set of several thousand core erythroid genes composed of tissue-restricted transcripts are expressed in the primitive, fetal definitive, and adult definitive erythroid lineages. Surprisingly, we found no evidence that these transcripts were preferentially retained compared with non–tissue-restricted or housekeeping genes during the terminal stages of erythroid maturation. These core erythroid genes largely constitute specialized erythroid functional categories, such as heme and iron metabolism, and processes associated with terminal erythroid maturation, including changing nuclear dynamics (HP1 and Hdac2) and progressive elimination of organelles (ubiquitin peptidases and cathepsins). Therefore, our analysis supports a model of erythroid differentiation in which the majority of genes are activated in the progenitor compartment and transcript complexity is subsequently maintained and regulated in complex patterns during the terminal maturation of erythroid precursors.
A direct comparison of primitive and definitive erythroid lineages led to the identification of several hundred erythroid lineage–restricted genes, including many transcriptional regulators that will be the subject of future studies. When the functions of the core erythroid, primitive erythroid-, and definitive erythroid-restricted genes were categorized, we discovered that lineage-restricted gene expression generally is composed of functional categories present in all erythroid cells, but the lineage-restricted genes appear to optimize those functions for the requirements of each lineage. A classic example of a common function performed by lineage-restricted genes is the differential use of globin genes for the purpose of carrying oxygen. Another example highlighted herein is the differential utilization of aquaporin genes in the functional category of protein and solute transport. Aquaporins are a widely expressed family of 9 water transport molecules with distinct tissue-restricted patterns of expression. The founding member, Aqp1, was originally identified in adult RBCs.44 Although Aqp1 and Aqp9 are specifically expressed in adult mouse erythroid cells, Aqp3 and Aqp8, but not Aqp1 or Aqp9, are expressed in primitive erythroid cells. Interestingly, Aqp3 and Aqp8 share the ability to facilitate the transport of not only water, but also H2O2,40,41 and primitive erythroblasts accumulate large amounts of ROS when exposed to low concentrations of exogenous H2O2. The functional consequences of H2O2 accumulation in primitive erythroid cells remain unclear. Although H2O2 can act as a signaling molecule in some cell types,41 our results raise the intriguing possibility that circulating primitive erythroid cells might serve as a scavenging system to take up H2O245 within the embryonic environment.
We have created a Web site (http://www.cbil.upenn.edu/ErythronDB) that provides readily available access to the gene-expression data from our carefully staged primary primitive and definitive erythroid precursors and reticulocytes. ErythonDB also provides links to other complementary Web sites, including MGI, PubMed, Entrez Gene, and several gene-expression atlases for further information regarding queried genes. Tools are available to upload user-defined lists for more robust gene queries and to combine multiple queries to identify erythroid-expressed genes that meet defined characteristics such as temporal pattern, fold change between stages, GO function, and KEGG pathway, as well as curated metrics such as tissue specificity. This Web site will serve as a valuable resource for the scientific community to explore comparative erythroid gene-expression data without the need for additional specialized software.
This article contains a data supplement.
The publication costs of this article were defrayed in part by page charge payment. Therefore, and solely to indicate this fact, this article is hereby marked “advertisement” in accordance with 18 USC section 1734.
Acknowledgments
The authors thank Kate Fegan and David Fuller (University of Rochester Medical Center Flow Cytometry Core) for technical assistance, Dr Michael Bulger for providing the Sox6 exon1E construct and for helpful discussions, Drs Andrew Brooks and Qi Wang (Bionomics Research and Technology Center, Environmental and Occupational Health Sciences Institute) for facilitating sample processing and Affymetrix analysis, and Drs David Tuck, Vincent Schulz, and Pat Gallagher at Yale University for fruitful discussions regarding bioinformatics analyses.
This research was supported by funding from the National Institute of Diabetes and Digestive and Kidney Diseases, National Institutes of Health (DK071116), and the Michael Napoleone Memorial Foundation.
National Institutes of Health
Authorship
Contribution: P.D.K. designed and performed the experiments, analyzed the data, and wrote the manuscript; E.G.-A. analyzed the data and established and maintained the ErythronDB Web site; J.M.F. performed the experiments and wrote the manuscript; T.P.B. and J.M. performed the experiments; K.E.M. performed the experiments, analyzed the data, and wrote the manuscript; C.J.S. designed the experiments, analyzed the data, and designed the ErythronDB Web site; and J.P. designed the experiments, analyzed the data, and wrote the manuscript.
Conflict-of-interest disclosure: The authors declare no competing financial interests.
Correspondence: James Palis, University of Rochester Medical Center, Center for Pediatric Biomedical Research, Box 703, 601 Elmwood Ave, Rochester, NY 14642; e-mail: james_palis@urmc.rochester.edu.

