To the editor:
Published reports have demonstrated coordinate expression between messenger RNA and proteins in platelets.1-3 It was therefore surprising that, comparing our RNA-seq data set4 to their quantitative proteomics data set, Burkhart et al5 concluded that “in platelets, the occurrence of proteins is not interrelated to the presence of transcripts.” The accompanying highlight article reiterated that “the protein profile does not correlate at all with earlier published transcriptome analyses.”6 Are these statements valid and to what extent? Can transcript profiling be used to predict protein expression and differences in platelets? Because transcript profiling forms the basis of many published and ongoing platelet studies, the answers to these questions are critical.
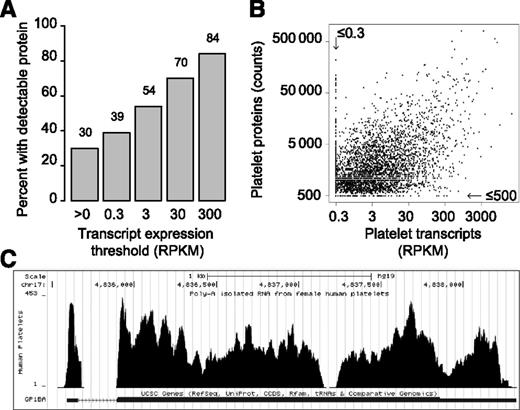
Two lines of evidence led to their conclusion. First, no correlation in expression was found between the top 20% of proteins and transcripts. Second, transcript expression for a limited number of receptor complexes did not match the expected stoichiometry. To further evaluate these, we remapped the proteomics data set onto our published RNA-seq data set (supplemental Table 1, see the Blood Web site). Of the 3992 detectable proteins with an ID match, 96% are detected within the RNA-seq data set and 87% expressed at >0.3 reads per kilobase of exon model per million mapped reads (RPKM; 0.3 RPKM is an expression threshold well above background). Thus, the presence of protein is highly predictive of the presence of transcript. Conversely, 30% of the detected transcripts correspond to a detectable protein. Furthermore, as the transcript abundance threshold increases, so does the likelihood that the protein is present (Figure 1A). For example, of transcripts expressed above 300 RPKM, 84% correspond to a detectable protein. This overlap is remarkable considering “undetectable” (by the assay) is not equivalent to “unexpressed.”
Transcript and protein expression in platelets is correlated. (A) The percentage of transcripts where the coordinate protein is detected is plotted for each threshold of transcript expression. (B) Scatter plot comparing log-adjusted transcript expression (x-axis) with log-adjusted protein expression (y-axis) for all proteins with an ID match to a transcript. For visual simplicity, transcripts or proteins below the arbitrary background threshold (0.3 RPKM or 500 count, respectively) were adjusted to the threshold. Values were left unadjusted for the correlation analysis described in the text. (C) Visualization of our RNA-seq data for GPIbα in the UCSC genome browser (http://genome.ucsc.edu) via direct links in GNomEx (https://bioserver.hci.utah.edu/gnomex/). To view the data, sign in as a guest, type “platelet” in the search box, double click on the track of interest, and then click the University of California Santa Cruz browser link next to the data track title.
Transcript and protein expression in platelets is correlated. (A) The percentage of transcripts where the coordinate protein is detected is plotted for each threshold of transcript expression. (B) Scatter plot comparing log-adjusted transcript expression (x-axis) with log-adjusted protein expression (y-axis) for all proteins with an ID match to a transcript. For visual simplicity, transcripts or proteins below the arbitrary background threshold (0.3 RPKM or 500 count, respectively) were adjusted to the threshold. Values were left unadjusted for the correlation analysis described in the text. (C) Visualization of our RNA-seq data for GPIbα in the UCSC genome browser (http://genome.ucsc.edu) via direct links in GNomEx (https://bioserver.hci.utah.edu/gnomex/). To view the data, sign in as a guest, type “platelet” in the search box, double click on the track of interest, and then click the University of California Santa Cruz browser link next to the data track title.
Figure 1B demonstrates a clear correlation in protein vs RNA expression when both the protein and transcript are detectable. This coincides with a Spearman correlation of 0.40 between protein (>500 count) and RNA expression (>0.3 RPKM). Bearing in mind that the RNA/protein measurements were generated from different individuals, that RNA/protein methodologies are different, and that the platelet proteome contains many plasma derived proteins,5 we conclude that transcript expression correlates well with protein expression in platelets.
Our correlation analysis considered all values quantitatively assessed above background. In contrast, Burkhart et al analyzed a smaller subset of the data. In addition, their ID mapping strategy may have introduced occasional, yet significant, discrepancies. For example, as evidence for the nonstoichiometric expression of GPIb/IX/V in our RNA-seq data set, they reason that “GPIbα is missing in the transcriptome data.” However, as found within our published supplementary data set, GPIbα is abundant (198 RPKM). To avoid “missing” information (ie, because of different naming conventions; even UniProt’s ID mapper7 “missed” mapping GPIbα between the data sets), we recommend visualization of our RNA-seq data by genomic location. This can now be done directly in GNomEx8 (https://bioserver.hci.utah.edu/gnomex/), which includes links to the University of California Santa Cruz genome browser9 (Figure 1C, see figure legend for access instructions).
Proteomics technologies boast the opportunity to quantitatively assess thousands of proteins at once. RNA-seq provides sensitive expression and sequence-level information. Together, these complementary technologies provide unprecedented capabilities to assess the imperfect yet correlated relationship between RNA, protein, platelet function, and ultimately disease.
The online version of this article contains a data supplement.
Authorship
Acknowledgments: This work was supported by grants from the National Institutes of Health (1U54 HL112311-01, 1K01 GM103806-01, and 2R01 HL066277-11).
Contribution: J.W.R. performed the research and drafted and prepared the manuscript; and A.S.W. reviewed the manuscript.
Conflict-of-interest disclosure: The authors declare no competing financial interests.
Correspondence: Jesse W. Rowley, Department of Internal Medicine, University of Utah School of Medicine, Eccles Institute of Human Genetics, Building 533, Room 4260, 15 North 2030 East, Salt Lake City, UT 84112; e-mail: jesse.rowley@u2m2.utah.edu.


This feature is available to Subscribers Only
Sign In or Create an Account Close Modal