Key Points
RAPA-resistant mTOR negatively regulates DC B7-H1 expression through signal transducer and activator of transcription 3 and suppressor of cytokine signaling 3.
Adenosine triphosphate–competitive mTOR inhibition promotes B7-H1–dependent DC induction of Tregs.
Abstract
Mammalian target of rapamycin (mTOR) is an important, yet poorly understood integrative kinase that regulates immune cell function. mTOR functions in 2 independent complexes: mTOR complex (mTORC) 1 and 2. The immunosuppressant rapamycin (RAPA) inhibits mTORC1 but not mTORC2 and causes a paradoxical reduction in anti-inflammatory interleukin (IL) 10 and B7-homolog 1 (B7-H1) expression by dendritic cells (DCs). Using catalytic mTOR inhibitors and DCs lacking mTORC2, we show that restraint of signal transducer and activator of transcription 3–mediated IL-10 and B7-H1 expression during DC maturation involves a RAPA-insensitive and mTORC2-independent mTOR mechanism. Relatedly, catalytic mTOR inhibition promotes B7-H1–dependent and IL-1β–dependent DC induction of regulatory T cells (Tregs). Thus, we define an immunoregulatory pathway in which RAPA-sensitive mTORC1 in DCs promotes effector T-cell expansion and RAPA-insensitive mTORC1 restrains Treg induction. These findings identify the first known RAPA-insensitive mTOR pathway that is not mediated solely by mTORC2 and have implications for the use of catalytic mTOR inhibitors in inflammatory disease settings.
Introduction
Dendritic cells (DCs) are innate professional antigen-presenting cells (APCs) that initiate and regulate adaptive immunity.1,2 DCs control T-cell reactivity by coordinating display of Ag to T cells in the context of major histocompatibility class molecules with the delivery of costimulation and cytokines that dictate T-cell differentiation and function. Although costimulatory molecules support T-cell responses, coinhibitory molecules restrain T-cell reactivity. Our understanding of the precise molecular mechanisms regulating expression of proinflammatory vs regulatory signals by DCs remains unclear.
B7-homolog 1 (B7-H1, programmed death 1 [PD-1] ligand 1; CD274) is a B7 family coinhibitory molecule expressed on DCs in a regulated manner that binds to PD-1 (CD279) on activated T cells, thereby reducing their proliferation and proinflammatory cytokine production.3,4 The B7-H1/PD-1 pathway plays a crucial role in the maintenance of peripheral tolerance.5 B7-H1 stimulates T-cell secretion of anti-inflammatory interleukin (IL) 106 and promotes the induction, maintenance, and function of regulatory T cells (Tregs) from naive T cells.7 Importantly, the precise upstream mechanisms regulating B7-H1 expression remain elusive, and the differential regulation of costimulatory vs coinhibitory molecule expression is poorly understood, despite their central role in the activation and constraint of adaptive T-cell responses by DCs.
Mammalian target of rapamycin (mTOR) is a highly conserved, serine/threonine kinase that controls APC and T-cell function.8,9 The mTOR kinase performs the catalytic function of 2 independent complexes: mTOR complex (mTORC) 1 and mTORC2.10,11 mTORC1 consists of mTOR, regulatory associated protein of mTOR (raptor), mammalian lethal with Sec13 protein 8 (mLST8), and proline-rich substrate of Akt of 40 kD (PRAS40), whereas mTORC2 contains mTOR, rapamycin (RAPA)-insensitive companion of mTOR (rictor), mLST8, mSIN1, and protein associated with rictor (PROTOR).12 Although RAPA is a potent allosteric inhibitor of mTORC1, it exerts little activity against RAPA-insensitive mTORC2.10,11 However, novel, highly selective adenosine triphosphate (ATP)–competitive active site mTOR inhibitors that block both mTOR-containing complexes have revealed RAPA-resistant mTORC1 and mTORC2 signaling in nonimmune cells.13,14 mTORC1 inhibition suppresses conventional DC maturation and promotes their tolerogenicity.2,8,15 Conversely, RAPA has paradoxical, proinflammatory effects on DCs, including increased secretion of IL-12p70 and IL-1β, with concomitant reduced secretion of IL-10 and expression of B7-H1.16-21 These effects on DCs are mediated by augmentation of nuclear factor κB (NF-κB) activity and reduction in signal transducer and activator of transcription (STAT) 3 activity.17,20,21
RAPA-insensitive mTORC2 regulates the actin cytoskeleton in nonimmune cells,10,11 and insight is emerging into its function in T lymphocytes. Selective deletion of mTORC2 in T cells impairs their differentiation into T helper (Th) 1 and Th222 or only Th2 subsets.23 In contrast to the well-defined role of mTORC1, little is known about the function of mTORC2 in APCs or innate immunity. In this study, we sought to define the role of RAPA-resistant mTOR in molecular regulation of the ability of DCs to promote T-cell immunity.
We find that RAPA-resistant mTOR negatively regulates conventional DC STAT3-mediated IL-10 and B7-H1 expression. Deletion of the mTORC2 subunit rictor had the opposite effect, suggesting that residual RAPA-resistant mTORC1 activity or dual mTORC1 and 2 inhibition mediates this central anti-inflammatory pathway in DCs. Enhanced STAT3 activation in DCs exposed to ATP-competitive mTOR inhibitors correlated with a reduction in suppressor of cytokine signaling (SOCS) 3. Functionally, mTORC1-inhibited DCs were unable to stimulate proliferation of forkhead box P3 (Foxp3–) effector T cells (Teffs), whereas ATP-competitive mTOR inhibition additionally promoted the induction of Foxp3+ Tregs in a B7-H1–dependent manner that also required IL-1β. These data reveal a novel, RAPA-resistant anti-inflammatory pathway in DCs that regulates IL-10 and B7-H1 and identifies divergent regulation of Teff and Treg responses by DCs due to RAPA-sensitive and RAPA-resistant mTOR.
Methods
Animals and drug administration
Male C57BL/6 (B6; H2Kb), BALB/c (H2Kd), B6.129S2-Irf1tm1Mak/J (interferon regulatory factor 1; IRF-1 null), B6.129P2-Il10tm1Cgn/J (IL-10−/−), B6.129X1-Ebi3tm1Rsb/J (Epstein-Barr virus–induced gene 3; Ebi3−/−), and B6.129S1-Il12btm1Jm/J (IL-12/23p40−/−) mice were purchased from The Jackson Laboratory. Male B6.129S2-Il6tm1Kopf/J (IL-6−/−) and IL-10–green fluorescent protein (IL-10-gfp) mice were kindly provided by Dr A. Jake Demetris and Dr David Rothstein, respectively (University of Pittsburgh). Femurs and tibiae from mice containing loxP-flanked O class forkhead box (FoxO) 1, FoxO3, and FoxO4 crossed to mice containing tamoxifen-inducible Cre recombinase under the ROSA26 promoter (FoxO1/3/4fl/fl × ROSA26-CreERT2) were used to generate bone marrow (BM)–derived DCs. B7-H1−/− mouse pairs on a B6 background were kindly provided by Dr Lieping Chen (Johns Hopkins University) and bred at the University of Pittsburgh. Mice containing loxP-flanked rictor (rictorfl/fl) and ROSA26-CreERT2 were maintained at the University of Pittsburgh. WYE-125132 (50 mg/kg24 intraperitoneally; Selleck Chemicals) was dissolved in dimethylsulfoxide (DMSO) and administered in a vehicle composed of 5% Tween 80 and 54% polyethylene glycol (Sigma-Aldrich; average Mn 300) at the time of lipopolysaccharide (LPS) injection (Escherichia coli 0111:B4; Sigma-Aldrich; 100 μg/kg intraperitoneally). The work performed in this study was covered under University of Pittsburgh Institutional Animal Care and Use Committee (IACUC) protocol 1102281.
DC differentiation, purification, and stimulation
DCs were generated from BM cells, as described19,25 using recombinant (r) mouse granulocyte macrophage–colony-stimulating factor and r mouse IL-4 (both 1000 U/mL; R&D Systems). On day 8 of culture, myeloid DCs were selected from nonadherent cells by anti-CD11c immunomagnetic bead purification (Miltenyi Biotec). Torin113 (kindly provided by Dr Nathanael S. Gray [Dana-Farber Cancer Institute] or purchased from Tocris Bioscience), AZD805526 (Selleck Chemicals), WYE-125132, or RAPA (LC Laboratories) was added to cultures on day 2 at the concentration indicated and refreshed on day 4 and day 6. Where indicated, Toll-like receptor (TLR) 4–specific LPS (Salmonellaminnesota R595; 100 ng/mL; Alexis Biochemicals) was used to stimulate DC cultures on day 7 for 16 to 18 hours. In some experiments, 250 nM STAT3 inhibitor VII (EMD Chemicals) was added on day 7, 2 hours before LPS stimulation.
Flow cytometric analyses
Cell surface and intracellular staining was performed as described.19,25 Fluorochrome-conjugated monoclonal antibodies were purchased from eBioscience, BD Bioscience, or Biolegend. P-STAT3 quantification by flow cytometry was performed as described.20 Data were acquired using an LSR II or LSR Fortessa flow cytometer (BD Bioscience) and analyzed using FlowJo 8.8.6 (Tree Star). Percent P-STAT3 positive cells was determined using Overton Subtraction (FlowJo) by comparing experimental samples with corresponding control samples stained with secondary antibody (Ab) only.
Mixed leukocyte reaction (MLR)
ϒ-irradiated (20 Gy) DCs (B6; 1 × 10⁴) were used as stimulators in 5-day allogeneic MLR as described.27 Normal CD4+CD25– BALB/c T-cell responders (1 × 10⁵) were isolated by negative selection and labeled with carboxyfluorescein succinimidyl ester (CFSE) according to the manufacturer’s protocol (Invitrogen). In some experiments, neutralizing Ab was added to cultures at 10 μg/mL (αIL-1β [B122], αIL-10 [JES5-16E3; BD Bioscience], αB7-H1 [MIH5], or αPD-1 [RMP1-14; eBioscience]).
Cytokine quantification
Enzyme-linked immunosorbent assays were performed on cell-free DC supernatants according to the manufacturer’s instructions to quantify IL-12p40 and IL-6 (Biolegend). IL-1β was quantified by cytometric bead array (BD Bioscience) according to the manufacturer’s protocol.
Tamoxifen induction of Cre recombinase
One hundred nanomolar (Z)-4-hydroxytamoxifen (4OHT; Sigma-Aldrich) was added to BM cultures on day 0 to delete FoxO transcription factors from FoxO1/3/4fl/fl × ROSA26-CreERT2 BM-derived DCs. Tamoxifen (15 mg/mL; Sigma-Aldrich) was administered intraperitoneally in sunflower seed oil (Sigma-Aldrich) every 2 days for 3 doses to rictorfl/fl × ROSA26-CreERT2 mice. BM cells were harvested from these mice 7 days later and cultured to generate rictor−/− BM-derived DCs.
Immunoblot
Statistical analyses
Results are expressed as means +1 standard deviation. The unpaired, 2-tailed Student t test was used to determine the significance of differences between means (GraphPad Prism).
Results
RAPA-resistant mTOR is a negative regulator of conventional DC B7-H1 expression
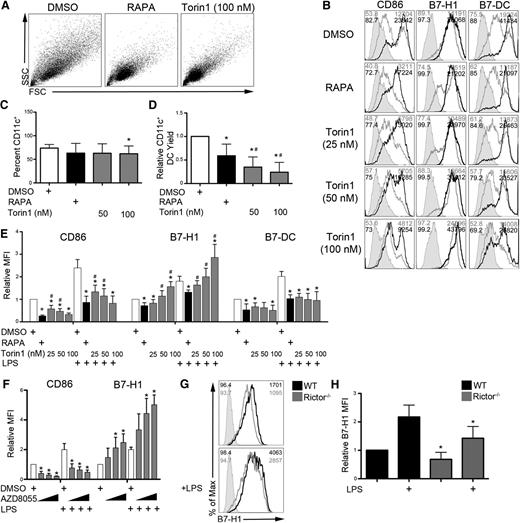
We first examined the surface phenotype of B6 BM-derived conventional DCs propagated under conditions of either mTORC1 inhibition with RAPA or mTORC1 and 2 inhibition with the ATP-competitive mTOR inhibitor Torin1. As reported previously for RAPA,16 DCs differentiated in Torin1 were small and homogenous compared with control DCs (Figure 1A). Although mTOR inhibition did not affect CD11c+ DC differentiation (Figure 1C), both RAPA and Torin1 reduced the DC yield from BM cell cultures (Figure 1D). In agreement with previous studies,17,20 RAPA reduced the expression of CD80, CD86, B7-H1, and B7-DC on both unstimulated and LPS-stimulated DCs (Figure 1B,E; supplemental Figure 1, see the Blood Web site). Although Torin1 also reduced CD80, CD86, and B7-DC expression, by contrast with RAPA, Torin1 selectively and dose-dependently enhanced B7-H1 expression on DCs (Figure 1B,E). Expression of major histocompatibility class molecules, CD40, CD54, CD80, and B7RP-1 was similarly regulated by RAPA and Torin1 (supplemental Figure 1). B7-H3 and B7-H4 were not detected (data not shown). Torin1 reduced CD86 expression similarly to RAPA on human monocyte-derived DCs and CD34+ cell-derived DCs; however, B7-H1 expression was spared by Torin1, resulting in significantly higher expression than on RAPA-exposed DCs (supplemental Figure 2).
ATP-competitive dual mTORC1 and 2 inhibition dose-dependently and selectively upregulates DC B7-H1 expression. B6 mouse BM-derived conventional DCs were differentiated in the presence of vehicle (DMSO) or the indicated mTOR inhibitor (10 ng/mL RAPA or various concentrations of Torin1 or AZD8055). (A) Forward scatter (FSC) vs side scatter (SSC) flow cytometry plots of CD11c+-purified DCs. (B) CD11c-gated cells were analyzed for CD86, B7-H1 (PD-1 ligand 1), and B7-DC (PD-1 ligand 2) expression by flow cytometry in unstimulated cultures and cultures stimulated with LPS on day 7 for 18 hours. Isotype controls are indicated by the shaded histogram; unstimulated (gray line) and LPS-stimulated cells (black line) are also shown. The percent of cells staining positive and the MFI are indicated in the upper left and right corners, respectively. (C) The frequency of CD11c+ DCs in BM cell cultures was determined on day 8. (D) mTOR inhibition reduced the yield of CD11c+ DCs isolated from BM cell cultures on day 8. Viable cell numbers were determined by trypan blue exclusion. (E) Quantification of CD86, B7-H1, and B7-DC expression (MFI) across multiple experiments. (F) CD11c-gated cells from BM cultures exposed to increasing concentrations of AZD8055 (400, 800, and 1200 nM) were assessed for CD86 and B7-H1 expression. (G) B7-H1 expression on wild-type (WT) or rictor−/− BM-derived DCs. Percent positive cells and MFI are indicated in the upper left and right corners, respectively. (H) Quantification of panel G across multiple experiments. Bar graph values are normalized to WT or the DMSO treatment condition. n ≥ 3 experiments for all data presented. *, # P < .05 when compared with control and RAPA, respectively.
ATP-competitive dual mTORC1 and 2 inhibition dose-dependently and selectively upregulates DC B7-H1 expression. B6 mouse BM-derived conventional DCs were differentiated in the presence of vehicle (DMSO) or the indicated mTOR inhibitor (10 ng/mL RAPA or various concentrations of Torin1 or AZD8055). (A) Forward scatter (FSC) vs side scatter (SSC) flow cytometry plots of CD11c+-purified DCs. (B) CD11c-gated cells were analyzed for CD86, B7-H1 (PD-1 ligand 1), and B7-DC (PD-1 ligand 2) expression by flow cytometry in unstimulated cultures and cultures stimulated with LPS on day 7 for 18 hours. Isotype controls are indicated by the shaded histogram; unstimulated (gray line) and LPS-stimulated cells (black line) are also shown. The percent of cells staining positive and the MFI are indicated in the upper left and right corners, respectively. (C) The frequency of CD11c+ DCs in BM cell cultures was determined on day 8. (D) mTOR inhibition reduced the yield of CD11c+ DCs isolated from BM cell cultures on day 8. Viable cell numbers were determined by trypan blue exclusion. (E) Quantification of CD86, B7-H1, and B7-DC expression (MFI) across multiple experiments. (F) CD11c-gated cells from BM cultures exposed to increasing concentrations of AZD8055 (400, 800, and 1200 nM) were assessed for CD86 and B7-H1 expression. (G) B7-H1 expression on wild-type (WT) or rictor−/− BM-derived DCs. Percent positive cells and MFI are indicated in the upper left and right corners, respectively. (H) Quantification of panel G across multiple experiments. Bar graph values are normalized to WT or the DMSO treatment condition. n ≥ 3 experiments for all data presented. *, # P < .05 when compared with control and RAPA, respectively.
AZD8055, another ATP-competitive mTOR inhibitor, similarly increased B6 DC B7-H1 expression (Figure 1F; supplemental Figure 3A), thus confirming that B7-H1 upregulation was due to on-target mTOR inhibition. Surprisingly, rictor−/− DCs lacking mTORC2 activity displayed diminished B7-H1 expression following LPS stimulation (Figure 1G-H). DC differentiation was not affected, whereas the DC yield was reduced slightly in rictor−/− BM cultures (supplemental Figure 3B-C). Together, these data suggest that RAPA-resistant mTORC1 is a negative regulator of DC B7-H1 expression downstream of TLR4, whereas mTORC2 is a positive regulator of B7-H1 expression.
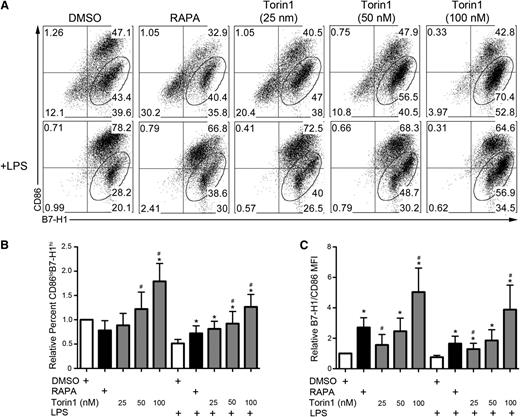
Further analysis revealed that enhanced B7-H1 expression on Torin1-conditioned DCs occurred predominantly on immature CD86lo cells (Figure 2A-B). Similarly, AZD8055-conditioned DCs were mainly CD86loB7-H1hi (supplemental Figure 3A,D-E). The ratio of coinhibitory (B7-H1) to costimulatory (CD86) B7 family molecule expression was enhanced on Torin1- and AZD8055-conditioned DCs to a greater extent than on RAPA-conditioned DCs, with or without LPS stimulation (Figure 2C; supplemental Figure 3F). Human monocyte-derived DCs, but not CD34+ cell-derived DCs, differentiated in Torin1 exhibited a trend toward an elevated ratio of B7-H1 to CD86 expression compared with those differentiated in RAPA (supplemental Figure 2C,F).
Torin1-conditioned DCs are predominantly CD86loB7-H1hi. (A) Analysis of the coexpression of CD86 and B7-H1 on CD11c-gated cells with percentage of CD86loB7-H1hi DCs indicated in the gate. (B) Quantification of the frequency of CD86loB7-H1hi DCs across multiple experiments. (C) Ratio of the normalized B7-H1 MFI divided by the normalized CD86 MFI for the indicated culture conditions. n ≥ 5 experiments for all data presented. *, # P < .05 when compared with DMSO and RAPA, respectively.
Torin1-conditioned DCs are predominantly CD86loB7-H1hi. (A) Analysis of the coexpression of CD86 and B7-H1 on CD11c-gated cells with percentage of CD86loB7-H1hi DCs indicated in the gate. (B) Quantification of the frequency of CD86loB7-H1hi DCs across multiple experiments. (C) Ratio of the normalized B7-H1 MFI divided by the normalized CD86 MFI for the indicated culture conditions. n ≥ 5 experiments for all data presented. *, # P < .05 when compared with DMSO and RAPA, respectively.
STAT3 but not IRF-1 is required for upregulation of B7-H1 on DCs by Torin1
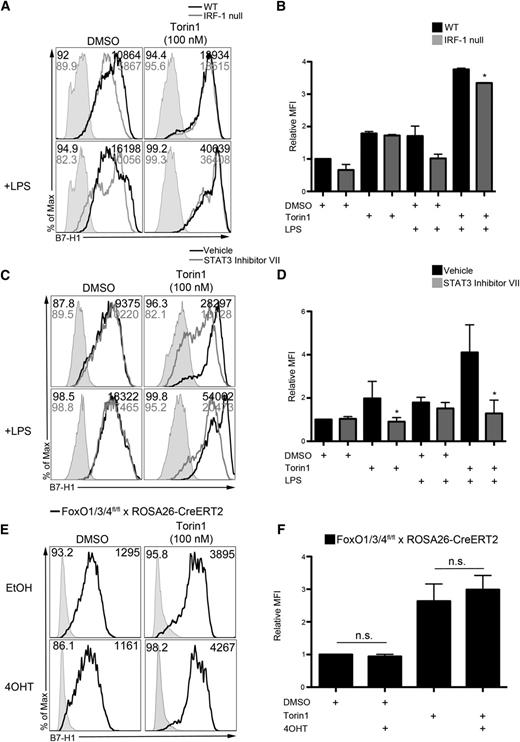
The B7-H1 promoter contains 2 IRF-1 binding sites that are required for constitutive expression and interferon ϒ–induced upregulation of B7-H1 in cancer cell lines.28 We analyzed B7-H1 expression on wild-type and IRF-1–null Torin1-conditioned DCs, but IRF-1 was not required for augmented DC B7-H1 expression (Figure 3A-B; supplemental Figure 4A-C).
RAPA-resistant mTOR negatively regulates B7-H1 expression by reducing STAT3 activation independent of FoxO. (A) WT or IRF-1–null BM cell cultures were exposed to Torin1 (100 nM), stimulated with LPS (100 ng/mL) overnight on day 7, and CD11c+ DCs interrogated for B7-H1 expression by flow cytometry on day 8. (B) Quantification of B7-H1 MFI from panel A relative to DMSO control. *P < .05 compared with WT. (C) DMSO or Torin1-exposed DCs were cultured as described in “Methods.” STAT3 inhibitor VII (250 nM) was added to cultures 2 hours before LPS stimulation for 18 hours, and B7-H1 expression analyzed on CD11c-gated DCs. (D) Quantification of B7-H1 MFI from panel C across multiple experiments normalized to DMSO control DC expression. *P < .05 compared with the corresponding group not receiving STAT3 inhibitor VII. (E) FoxO1/3/4fl/fl × ROSA26-CreERT2 BM cells were exposed to 4OHT, and B7-H1 expression determined on CD11c-gated DCs on day 8. (F) Quantification of B7-H1 MFI from panel E normalized to the DMSO+EtOH group. Data are from n = 2 to 4 independent experiments.
RAPA-resistant mTOR negatively regulates B7-H1 expression by reducing STAT3 activation independent of FoxO. (A) WT or IRF-1–null BM cell cultures were exposed to Torin1 (100 nM), stimulated with LPS (100 ng/mL) overnight on day 7, and CD11c+ DCs interrogated for B7-H1 expression by flow cytometry on day 8. (B) Quantification of B7-H1 MFI from panel A relative to DMSO control. *P < .05 compared with WT. (C) DMSO or Torin1-exposed DCs were cultured as described in “Methods.” STAT3 inhibitor VII (250 nM) was added to cultures 2 hours before LPS stimulation for 18 hours, and B7-H1 expression analyzed on CD11c-gated DCs. (D) Quantification of B7-H1 MFI from panel C across multiple experiments normalized to DMSO control DC expression. *P < .05 compared with the corresponding group not receiving STAT3 inhibitor VII. (E) FoxO1/3/4fl/fl × ROSA26-CreERT2 BM cells were exposed to 4OHT, and B7-H1 expression determined on CD11c-gated DCs on day 8. (F) Quantification of B7-H1 MFI from panel E normalized to the DMSO+EtOH group. Data are from n = 2 to 4 independent experiments.
STAT3 binds the B7-H1 promoter and is required for B7-H1 expression by lymphoma cell lines.29 Importantly, STAT3 has also been identified as a critical regulator of B7-H1 on human APC.30 STAT3 inhibition reversed enhanced B7-H1 expression (Figure 3C-D), eliminated concomitant CD86loB7-H1hi expression (supplemental Figure 4D-E), and reduced the B7-H1/CD86 ratio on Torin1-conditioned DCs (supplemental Figure 4F). These data demonstrate that enhanced DC B7-H1 expression induced by Torin1 occurs through an IRF-1–independent and STAT3-dependent pathway.
FoxO transcription factors mediate immune homeostasis31 and control the ability of DCs to limit T-cell expansion following viral infection.32 FoxO promotes STAT3 activity, and FoxO3 transcription correlates with elevated B7-H1 expression by tumor-associated DCs.33 Torin1-conditioned DCs were generated from FoxO1/3/4−/− BM cells by exposing FoxO1/3/4fl/fl × ROSA26-CreERT2 BM cells to 4OHT.34 Deletion of FoxO3a was confirmed by immunoblot (data not shown). FoxO was not required for B7-H1 upregulation by Torin1 (Figure 3E-F), thus suggesting a STAT3-dependent but FoxO-independent mechanism of RAPA-resistant mTOR negative regulation of B7-H1.
ATP-competitive mTOR inhibition enhances STAT3 signaling by reducing SOCS3 expression
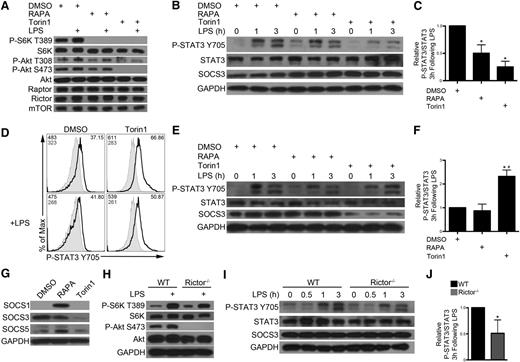
Studies with RAPA have implicated mTORC1 as a positive regulator of STAT3 in DCs17,20 ; however, reduced IL-10 secretion by RAPA-exposed DCs leads to reduced autocrine STAT3 activation.21 DCs were preincubated with RAPA or Torin1 for 2 hours before LPS stimulation (hereby referred to as “short-term” mTOR inhibition). As reported,12 RAPA abolished mTORC1 signaling (P-S6K T389), but only Torin1 blocked mTORC2 signaling (P-Akt S473; Figure 4A). Both short-term RAPA and Torin1 inhibited STAT3 phosphorylation following LPS stimulation (Figure 4B-C). In contrast, DC differentiated in the presence of Torin1, but not RAPA, from day 2 to day 8 (hereby referred to as “RAPA- or Torin1-conditioned DC”) demonstrated augmented STAT3 phosphorylation 3 hours after LPS stimulation (Figure 4D-F). SOCS proteins regulate cytokine signaling by inhibiting Janus kinase (JAK)–STAT pathways.35 RAPA conditioning led to augmented SOCS1 and SOCS5, which are negative regulators of STAT136 and STAT6,37 respectively (Figure 4G). Torin1 suppressed expression of the key STAT3 negative regulator SOCS3 (Figure 4E,G).38 As such, we make the novel observation that extended mTORC1 and 2 inhibition by Torin1, but not mTORC1 inhibition by RAPA, downregulates SOCS3 and enhances STAT3 signaling.
Extended exposure to ATP-competitive mTOR inhibition reduces SOCS3 expression, resulting in sustained STAT3 activation. CD11c+ cells were isolated from 7-day BM cell cultures and pretreated with DMSO, RAPA (10 ng/mL), or Torin1 (100 nM) for 2 hours before LPS stimulation for 30 minutes (A) or 1 to 3 hours (B). Total cell lysates were immunoblotted for the indicated protein. (C) P-STAT3 signal was quantified relative to total STAT3 signal at 3 hours following LPS stimulation and normalized to control. (D) DCs were differentiated in the presence of DMSO (vehicle) or Torin1 (100 nM) from day 2 to day 8. DCs were isolated by CD11c immunomagnetic purification, and P-STAT3 signal determined by flow cytometric analysis following LPS stimulation for 3 hours. Gray histogram depicts samples stained with secondary Ab only. MFI for P-STAT3 signal and secondary Ab only are indicated in the top left corner, and percent positive cells is indicated in the upper right corner. (E) RAPA- or Torin1-conditioned DCs were purified as described in panel D, stimulated with LPS for 0 to 3 hours, and total cell lysates immunoblotted for the indicated protein. (F) Quantification of P-STAT3/STAT3 signal 3 hours after LPS stimulation. (G) SOCS protein was assessed in RAPA- or Torin1-conditioned DCs. WT or rictor−/− DC were stimulated with LPS for 30 minutes (H) or 0 to 3 hours (I) and probed as indicated. (J) P-STAT3/STAT3 signal was quantified at 3 hours post-LPS. Data are representative of n = 2 to 3 independent experiments. *, # P < .05 when compared with DMSO or WT and RAPA, respectively.
Extended exposure to ATP-competitive mTOR inhibition reduces SOCS3 expression, resulting in sustained STAT3 activation. CD11c+ cells were isolated from 7-day BM cell cultures and pretreated with DMSO, RAPA (10 ng/mL), or Torin1 (100 nM) for 2 hours before LPS stimulation for 30 minutes (A) or 1 to 3 hours (B). Total cell lysates were immunoblotted for the indicated protein. (C) P-STAT3 signal was quantified relative to total STAT3 signal at 3 hours following LPS stimulation and normalized to control. (D) DCs were differentiated in the presence of DMSO (vehicle) or Torin1 (100 nM) from day 2 to day 8. DCs were isolated by CD11c immunomagnetic purification, and P-STAT3 signal determined by flow cytometric analysis following LPS stimulation for 3 hours. Gray histogram depicts samples stained with secondary Ab only. MFI for P-STAT3 signal and secondary Ab only are indicated in the top left corner, and percent positive cells is indicated in the upper right corner. (E) RAPA- or Torin1-conditioned DCs were purified as described in panel D, stimulated with LPS for 0 to 3 hours, and total cell lysates immunoblotted for the indicated protein. (F) Quantification of P-STAT3/STAT3 signal 3 hours after LPS stimulation. (G) SOCS protein was assessed in RAPA- or Torin1-conditioned DCs. WT or rictor−/− DC were stimulated with LPS for 30 minutes (H) or 0 to 3 hours (I) and probed as indicated. (J) P-STAT3/STAT3 signal was quantified at 3 hours post-LPS. Data are representative of n = 2 to 3 independent experiments. *, # P < .05 when compared with DMSO or WT and RAPA, respectively.
Rictor−/− DCs were unable to phosphorylate Akt S473; however, mTORC1 signaling was intact (Figure 4H). These cells exhibited diminished P-STAT3 following LPS stimulation, and there was no change in SOCS3 expression (Figure 4I-J). Importantly, these data establish that RAPA-resistant mTORC1 negatively regulates STAT3, whereas mTORC2 is a positive regulator of STAT3.
RAPA-resistant mTOR inhibition augments IL-10 production, but it is not required for B7-H1 upregulation
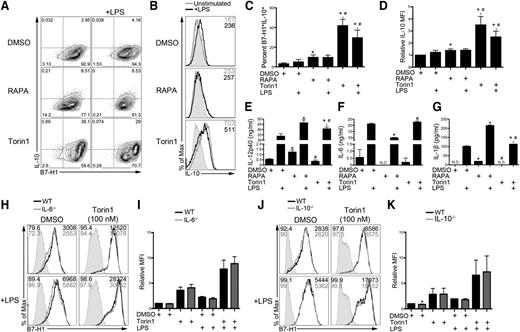
STAT3 phosphorylation occurs late (1-3 hours) after LPS stimulation of DCs (Figure 4), suggesting autocrine signaling that induces phosphorylation. Autocrine IL-10 signaling is required for STAT3 phosphorylation following LPS stimulation.21 IL-10 production was increased markedly in B7-H1hi Torin1-conditioned IL-10-gfp reporter DCs (Figure 5A,C). The IL-10 mean fluorescence intensity (MFI) was increased in Torin1-conditioned DCs compared with RAPA-conditioned and control DCs (Figure 5B,D). Both RAPA- and Torin1-conditioned DCs secreted increased IL-12/23p40 (Figure 5E). Rictor−/− DCs also secreted elevated IL-12p40 (data not shown). IL-6 and IL-1β secretion by DCs after LPS stimulation was reduced and increased, respectively, by RAPA, but unaffected by Torin1 (Figure 5F-G).
Torin1-exposed DCs produce increased IL-10, but B7-H1 upregulation does not require autocrine IL-6 or IL-10. (A) BM from IL-10-gfp reporter mice was differentiated in RAPA or Torin1 from day 2 to day 8. DCs were stimulated on day 7 where indicated and interrogated for B7-H1 and IL-10 coexpression by flow cytometry. (B) IL-10-gfp histogram for CD11c-gated DCs. MFI is indicated in the upper right corner. (C) The percentage of B7-H1+IL-10+ DCs from panel A was quantified across multiple experiments. (D) Quantification of IL-10 MFI across multiple experiments normalized to DMSO control DCs. Cell-free supernatants were assessed for IL-12/23p40 (E), IL-6 (F), and IL-1β (G). *, # P < .05 compared with DMSO or DMSO+LPS and RAPA or RAPA+LPS, respectively. DCs were differentiated from IL-6−/− (H,I) or IL-10−/− (J,K) BM cells in the presence of Torin1. B7-H1 expression was analyzed on CD11c-gated DCs by flow cytometry and quantified. *P < .05 compared with WT or WT+LPS. Data are from n = 2 to 3 independent experiments. N.D., not detected.
Torin1-exposed DCs produce increased IL-10, but B7-H1 upregulation does not require autocrine IL-6 or IL-10. (A) BM from IL-10-gfp reporter mice was differentiated in RAPA or Torin1 from day 2 to day 8. DCs were stimulated on day 7 where indicated and interrogated for B7-H1 and IL-10 coexpression by flow cytometry. (B) IL-10-gfp histogram for CD11c-gated DCs. MFI is indicated in the upper right corner. (C) The percentage of B7-H1+IL-10+ DCs from panel A was quantified across multiple experiments. (D) Quantification of IL-10 MFI across multiple experiments normalized to DMSO control DCs. Cell-free supernatants were assessed for IL-12/23p40 (E), IL-6 (F), and IL-1β (G). *, # P < .05 compared with DMSO or DMSO+LPS and RAPA or RAPA+LPS, respectively. DCs were differentiated from IL-6−/− (H,I) or IL-10−/− (J,K) BM cells in the presence of Torin1. B7-H1 expression was analyzed on CD11c-gated DCs by flow cytometry and quantified. *P < .05 compared with WT or WT+LPS. Data are from n = 2 to 3 independent experiments. N.D., not detected.
IL-6, IL-10, IL-23, and IL-27 all stimulate STAT3 phosphorylation.38-40 Neither autocrine IL-6 nor IL-10 was required for enhanced B7-H1 expression by Torin1 on control or LPS-stimulated DCs (Figure 5H-K). Autocrine IL-23 and IL-27 were also not required, as determined using IL-12/23p40−/− and Ebi3−/− BM cell cultures, respectively (supplemental Figure 5A-D). Collectively, these results identify a RAPA-resistant mTOR pathway that coregulates B7-H1 and IL-10 expression that does not depend on autocrine cytokine stimulation.
DC mTORC1 promotes Teff expansion, whereas RAPA-resistant mTOR restrains Treg induction via B7-H1
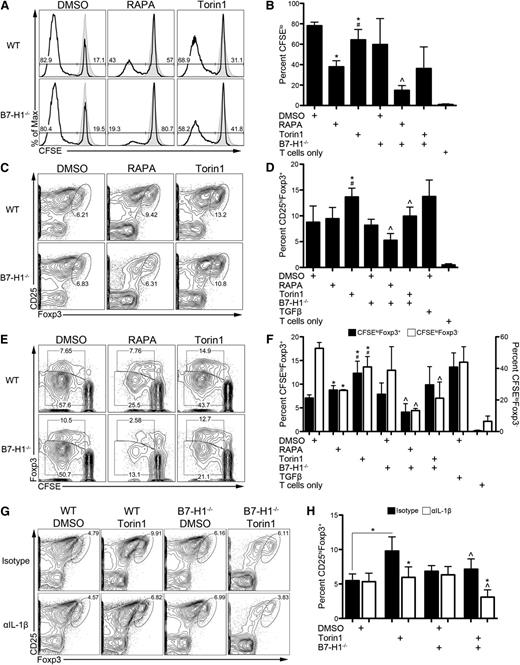
We next sought to determine how ATP-competitive mTOR inhibition modulates the T-cell stimulatory function of DCs. RAPA reduces the T-cell stimulatory capacity of DCs.15,16,19,27,41 Torin1 shared this ability, although its effect was less than that of RAPA (Figure 6A-B). Although B7-H1 has been shown to restrain T-cell proliferation,3 B7-H1−/− RAPA-DCs that express low CD80 and CD86 were less stimulatory than wild-type DCs (Figure 6A-B). These data are in agreement with early reports describing a T-cell proliferation–promoting effect of B7-H1.6
Enhanced induction of Tregs by Torin1-exposed DCs is B7-H1 and IL-1β dependent. (A) WT or B7-H1−/− DCs propagated in the indicated mTOR inhibitor were washed extensively and used as stimulators of CD4+CD25– normal BALB/c T cells in a 5-day CFSE-dilution MLR. (B) Percent of proliferating T cells (CFSElo) was calculated across multiple experiments. (C) Representative contour plots depicting the percentage of induced Tregs (CD25hiFoxp3+) in the MLR from panel A are shown. (D) The data from panel C were calculated across multiple experiments. (E) Representative contour plot of CFSE dilution of Foxp3+ and Foxp3– T cells. (F) Quantification of multiple experiments from panel E. *, #, ^ P < .05 compared with WT DMSO, WT RAPA, and the corresponding WT condition, respectively. IL-1β was neutralized in MLR, and Treg induction determined as in panel C (G) and quantified across experiments (H). *, ^ P < .05 compared with corresponding isotype control and WT conditions, respectively, unless otherwise indicated. All data are representative of n ≥ 3 independent experiments. In some experiments, transforming growth factor β (TGFβ) (10 ng/mL) was added at the start of culture as a positive control, and T cells without DC stimulators were included as a negative control.
Enhanced induction of Tregs by Torin1-exposed DCs is B7-H1 and IL-1β dependent. (A) WT or B7-H1−/− DCs propagated in the indicated mTOR inhibitor were washed extensively and used as stimulators of CD4+CD25– normal BALB/c T cells in a 5-day CFSE-dilution MLR. (B) Percent of proliferating T cells (CFSElo) was calculated across multiple experiments. (C) Representative contour plots depicting the percentage of induced Tregs (CD25hiFoxp3+) in the MLR from panel A are shown. (D) The data from panel C were calculated across multiple experiments. (E) Representative contour plot of CFSE dilution of Foxp3+ and Foxp3– T cells. (F) Quantification of multiple experiments from panel E. *, #, ^ P < .05 compared with WT DMSO, WT RAPA, and the corresponding WT condition, respectively. IL-1β was neutralized in MLR, and Treg induction determined as in panel C (G) and quantified across experiments (H). *, ^ P < .05 compared with corresponding isotype control and WT conditions, respectively, unless otherwise indicated. All data are representative of n ≥ 3 independent experiments. In some experiments, transforming growth factor β (TGFβ) (10 ng/mL) was added at the start of culture as a positive control, and T cells without DC stimulators were included as a negative control.
B7-H1 is a key regulator of Treg induction and function.7 Because Torin1-conditioned DCs express elevated levels of B7-H1, we determined their ability to induce Tregs (Figure 6C-F). Torin1-conditioned DCs induced a significantly greater frequency of Tregs compared with control and RAPA-conditioned DCs (Figure 6C-D). Enhanced induction of Tregs by Torin1-conditioned DCs was dependent on B7-H1 (Figure 6C-D) but independent of PD-1 (supplemental Figure 6A-B). Although Torin1-conditioned DCs made increased IL-10 (Figure 5A-D), it was not required for their ability to induce Tregs (supplemental Figure 6A-B). Neither genetic deletion nor neutralization of B7-H1 reduced Treg induction by control DCs (Figure 6C-D; supplemental Figure 6A-B). The absolute number of Tregs induced by RAPA-conditioned DCs was reduced dramatically compared with control (supplemental Figure 6C). Torin1-conditioned DCs induced a greater number of Tregs compared with RAPA-conditioned DCs, which was reduced in the absence of B7-H1 (supplemental Figure 6C).
CFSE dilution profiles of Foxp3+ and Foxp3– T cells were used to determine the relative contribution of inhibition of Teff (Foxp3–) proliferation to induction of Tregs (Figure 6E-F). Consistent with our previous report,27 RAPA-conditioned DCs stimulated Teffs poorly but stimulated CFSEloFoxp3+ T cells similarly to control DCs (Figure 6E-F). Torin1-conditioned DCs also stimulated Teffs less than control DCs; however, they approximately doubled the frequency of CFSEloFoxp3+ T cells (Figure 6E-F). These data demonstrate that ATP-competitive mTOR inhibition in DCs enhances their ability to induce Tregs in a B7-H1–dependent manner and augment CFSEloFoxp3+ T cells, whereas RAPA-conditioned DCs specifically reduce proliferation of Teffs without affecting CFSEloFoxp3+ T cells.
There is evidence that IL-1β promotes Treg induction42 and mTORC1 regulates IL-1β production by DCs.16,18 Although Torin1 did not alter IL-1β secretion by DCs (Figure 5G), neutralization of IL-1β suppressed Treg induction by Torin1-conditioned DCs (Figure 6G-H). Treg induction and augmentation of CFSEloFoxp3+ T cells were further reduced when IL-1β–inhibited Torin1-conditioned DCs were B7-H1 deficient (Figure 6G-H; supplemental Figure 6D-F). These data suggest that B7-H1 and IL-1β act cooperatively to promote Treg induction by Torin1-conditioned DCs.
ATP-competitive mTOR inhibition elevates DC B7-H1 expression in vivo and augments their ability to induce Tregs
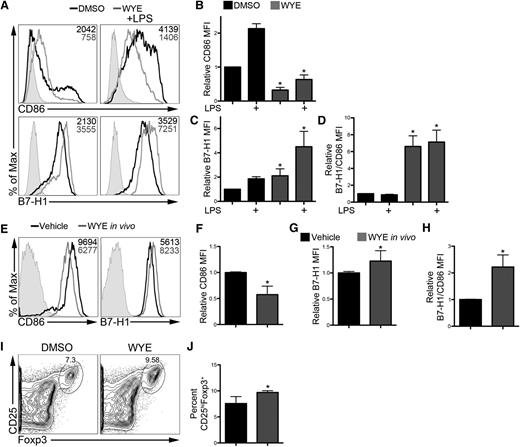
To determine if RAPA-resistant mTOR modulates DC B7-H1 expression in a more physiological setting, we investigated in vivo modulation of DCs by ATP-competitive mTOR inhibition. WYE-125132 is an ATP-competitive mTOR inhibitor with in vivo bioavailability.24 We first verified that WYE-125132 augmented DC B7-H1 expression while reducing CD86 expression in vitro (Figure 7A-D). When given as a single dose at the time of LPS administration, WYE-125132 enhanced splenic DC B7-H1 expression while reducing CD86 expression (Figure 7E-G). Furthermore, the ratio of B7-H1 to CD86 expression was increased (Figure 7H). These DCs augmented Treg induction ex vivo compared with control DCs (Figure 7I-J). Together, these findings confirm that RAPA-resistant mTOR controls B7-H1 expression and modulates the ability of DCs to induce Tregs in vivo.
ATP-competitive mTOR inhibition in vivo augments DC B7-H1 expression and their ability to induce Tregs. (A-D) DCs were differentiated in the presence of DMSO or WYE-125132 (WYE; 400 nM) from day 2 to day 8 and stimulated with LPS. Representative histograms (A) and quantification of CD86 (B) and B7-H1 (C) expression. MFI is indicated in the upper right corner of each histogram. (D) Ratio of B7-H1 to CD86 expression. Values were normalized to unstimulated DMSO DCs. (E-H) Mice were treated with WYE (50 mg/kg) and given LPS (100 μg/kg). Data are representative of n = 3 independent experiments. (E) Splenic CD11b+CD11c+ DCs were analyzed by flow cytometry for CD86 and B7-H1 expression 18 hours later with representative histograms shown. MFI values are shown in the upper right corner of each histogram. CD86 (F), B7-H1 (G), and the ratio of B7-H1 to CD86 (H) were determined across several experiments and normalized to the vehicle control. (I) Splenic DCs isolated in panel E were used to induce Tregs ex vivo from CD4+CD25– BALB/c T cells. (J) Treg induction was quantified across multiple experiments. Data are representative of n = 4 mice per treatment group. *P < .05 compared with DMSO.
ATP-competitive mTOR inhibition in vivo augments DC B7-H1 expression and their ability to induce Tregs. (A-D) DCs were differentiated in the presence of DMSO or WYE-125132 (WYE; 400 nM) from day 2 to day 8 and stimulated with LPS. Representative histograms (A) and quantification of CD86 (B) and B7-H1 (C) expression. MFI is indicated in the upper right corner of each histogram. (D) Ratio of B7-H1 to CD86 expression. Values were normalized to unstimulated DMSO DCs. (E-H) Mice were treated with WYE (50 mg/kg) and given LPS (100 μg/kg). Data are representative of n = 3 independent experiments. (E) Splenic CD11b+CD11c+ DCs were analyzed by flow cytometry for CD86 and B7-H1 expression 18 hours later with representative histograms shown. MFI values are shown in the upper right corner of each histogram. CD86 (F), B7-H1 (G), and the ratio of B7-H1 to CD86 (H) were determined across several experiments and normalized to the vehicle control. (I) Splenic DCs isolated in panel E were used to induce Tregs ex vivo from CD4+CD25– BALB/c T cells. (J) Treg induction was quantified across multiple experiments. Data are representative of n = 4 mice per treatment group. *P < .05 compared with DMSO.
Discussion
Herein we describe a novel RAPA-resistant and mTORC2-independent signaling pathway in conventional DCs that controls B7-H1 and IL-10 expression downstream of TLR4. This novel signaling network coordinates the ability of DCs to stimulate Teff and Treg responses. DCs conditioned in ATP-competitive mTOR inhibitors dose-dependently and selectively upregulated B7-H1 expression. Elevated IL-10 production by Torin1-conditioned DCs was found in a B7-H1hi population. B7-H1 upregulation by Torin1 was STAT3 dependent but did not require FoxO1/3/4 or autocrine IL-6, IL-10, IL-12/23, or IL-27 signaling. Augmented STAT3 phosphorylation correlated with a reduction in SOCS3 expression. Rictor−/− DCs did not exhibit augmented STAT3 phosphorylation or B7-H1 expression. ATP-competitive mTOR inhibition resulted in DCs that markedly enhanced B7-H1–dependent but PD-1–independent Treg induction in the absence of exogenous TGFβ. IL-1β, but not IL-10, was required for enhanced Treg induction by DCs conditioned in Torin1 and acted additively with B7-H1. Together, these findings establish how distinct mTORC signaling coordinates to regulate DC stimulatory function at a molecular level.
mTOR is a central regulator of T-cell function9 that is targeted for clinical immunosuppression, yet the impact of mTOR, particularly RAPA-resistant mTOR, on innate immune cells is poorly understood.8,43 RAPA is a potent and selective mTORC1 inhibitor; however, prolonged exposure can inhibit mTORC2 by preventing its assembly in certain cell types.44 After verifying the mTORC specificity of RAPA and ATP-competitive mTOR inhibitors, we used this strategy to dissect the function of RAPA-sensitive and RAPA-resistant pathways in conventional DCs. RAPA-sensitive mTOR (mTORC1) promoted costimulatory CD80 and CD86 expression and reduced IL-12 secretion. RAPA inhibits phosphorylation of inhibitory residues on glycogen synthase kinase 3 leading to NF-κB p65 activation and increased IL-12 secretion after TLR4 ligation.17,19-21,45 Our data support these findings where RAPA-sensitive mTORC1 suppresses IL-12 production. A recent study demonstrated a similar role for mTORC2 in DCs following LPS activation where rictor knockdown enhanced proinflammatory cytokine and reduced IL-10 secretion. However, elevated IL-12 secretion in these cells did not require NF-κB but was due to hyperactive FoxO1.46 The present study identifies, for the first time, a RAPA-resistant mTORC1 pathway that is critical for controlling the immune regulatory properties of DCs and further elaborates on signaling events downstream of TLR4.
ATP-competitive mTOR inhibition promoted DC IL-10 and B7-H1 expression and enhanced STAT3 activation. Enhanced STAT3 activation and reduced SOCS3 expression were only seen following prolonged ATP-competitive mTOR inhibition. These data demonstrate that the kinetics of mTOR inhibition (short-term exposure vs long-term conditioning), in addition to the complexes being targeted, are critical to understanding the function of mTOR in DCs. Initial publications describing ATP-competitive mTOR inhibitors revealed, unexpectedly, that RAPA did not inhibit mTORC1 completely; however, ATP-competitive mTOR inhibitors fully inhibited residual, RAPA-resistant mTORC1.13,14 To our knowledge, the present report describes the first RAPA-resistant mTOR pathway that is not dependent on RAPA-sensitive mTORC1. Contrastingly, RAPA produces the opposite effects, whereby B7-H1 and IL-10 are diminished. Raptor-deficient DCs lacking RAPA-sensitive and RAPA-resistant mTORC1 activity display reduced IL-10 production.47 Extended exposure of rictor−/− DCs to RAPA was not sufficient to upregulate B7-H1 (data not shown). Our findings can therefore be ascribed to a novel, RAPA-resistant mTORC1 pathway that is subordinate to RAPA-sensitive mTORC1 or to concomitant inhibition of RAPA-resistant mTORC1 and mTORC2.
Our data highlight the distinct function of mTOR-containing complexes in DCs when compared with T cells. mTOR-deficient T cells show reduced STAT3 phosphorylation,48 similarly to DCs exposed to short-term mTOR inhibition. However, extended exposure of DCs to ATP-competitive mTOR inhibition augmented STAT3 activation. Although rictor−/− DCs demonstrate reduced STAT3 activation, rictor−/− T cells exhibit normal STAT3 activation.22,23 Furthermore, resting rictor−/− T cells express reduced SOCS3.23 Our data show that extended ATP-competitive mTOR inhibitor conditioning reduces DC SOCS3 expression, but rictor deletion has no effect on SOCS3 in DCs. These apparent inconsistencies support how mTOR signaling occurs differentially in DCs and T cells.
Evidence is accumulating for a role of mTOR in DCs in shaping T-cell responses. Our data demonstrate that, although RAPA-sensitive mTORC1 promotes costimulatory molecule expression and Foxp3– Teff proliferation, RAPA-resistant and rictor-independent mTOR reduces IL-10 secretion and restrains Treg induction by downregulating coinhibitory B7-H1. Interestingly, although DC B7-H1 expression was required for augmented Treg induction by Torin1-conditioned DCs, the only known receptor for B7-H1, PD-1, was not required. PD-1–independent B7-H1 activity has been reported,49 and our data also suggest that unidentified B7-H1 receptors may exist. IL-1β was required for Treg induction and functioned additively with B7-H1 on Torin1-conditioned DCs. Neutralization of IL-1β (data not shown) and genetic deletion of B7-H1 also reduced Treg induction by RAPA-conditioned DCs but not control DCs, which suggests that other effects of mTORC1 inhibition are required that function collectively with IL-1β and B7-H1 to promote Treg induction.
ATP-competitive inhibition to target RAPA-resistant mTOR may be useful for the treatment of inflammatory disorders. mTORC2 signaling is required for Th1 and Th222 or only Th223 differentiation, and deletion of mTOR in T cells causes diversion to Foxp3+ Tregs following stimulation.48 Our data support the development of ATP-competitive mTOR inhibitors for clinical use, especially because similar findings regarding B7-H1 expression were obtained in human DC cultures and following administration of an ATP-competitive mTOR inhibitor to mice. Further development of ATP-competitive mTOR inhibitors will be required because some have brief half-lives,26 and their in vivo pharmacology is poorly understood. Given the paradoxical enhancement of IL-12p7017,19,45 and IL-1β16,18 production by RAPA-conditioned DCs and the reported pulmonary inflammation that can be associated with RAPA,50 augmentation of DC-derived IL-10 secretion and lack of increased IL-1β production by ATP-competitive mTOR inhibitors may mitigate untoward side effects of mTORC1 inhibition. Together, these studies demonstrate a novel, immune regulatory pathway mediated by RAPA-resistant mTOR downstream of TLR4 that is relevant for clinical applications of mTOR inhibition.
The online version of this article contains a data supplement.
The publication costs of this article were defrayed in part by page charge payment. Therefore, and solely to indicate this fact, this article is hereby marked “advertisement” in accordance with 18 USC section 1734.
Acknowledgments
The authors thank Ms Gabriela Michel for technical assistance with the human CD34+ cell-derived DC experiments.
This work was supported by an American Heart Association Predoctoral Fellowship (11PRE7070020) (B.R.R.) and National Institutes of Health grants R01AI67541 (A.W.T.), R00HL97155 (H.R.T.), and T32AI74490 (A.W.T.). D.R.-R. was supported by a European Society for Organ Transplantation/American Society of Transplantation grant, and B.G. was supported by a Leukemia & Lymphoma Society fellowship.
Authorship
Contribution: B.R.R. designed the research, performed experiments, analyzed results, made the figures, and wrote the paper; D.R.-R., B.M.M., and H.H. designed the research, performed experiments, and analyzed data; K.L., B.G., R.A.D., and M.B. analyzed data and wrote the paper; and H.R.T. and A.W.T. designed the research, analyzed data, and wrote the paper.
Conflict-of-interest disclosure: A.W.T. is an inventor of US patents for the generation of DCs to promote organ allograft tolerance. The remaining authors declare no competing financial interests.
Correspondence: Angus W. Thomson, Thomas E. Starzl Transplantation Institute, Departments of Surgery and Immunology, University of Pittsburgh School of Medicine, 200 Lothrop St, Biomedical Science Tower W1540, Pittsburgh, PA 15213; e-mail: thomsonaw@upmc.edu; and Hēth R. Turnquist, Thomas E. Starzl Transplantation Institute, Departments of Surgery and Immunology, University of Pittsburgh School of Medicine, 200 Lothrop St, Biomedical Science Tower E1554, Pittsburgh, PA 15213; e-mail: turnquisthr@upmc.edu.

This feature is available to Subscribers Only
Sign In or Create an Account Close Modal