

Abstract
Abstract 777
Protein kinase C β (PKCβ) is critical for B-cell signaling and survival. Over-expression of PKCβ is implicated in the pathogenesis of follicular lymphoma (FL). Enzastaurin (ENZ), an oral serine/threonine kinase inhibitor, targets the PKCβ and PI3K/AKT pathways to inhibit tumor cell proliferation, induce apoptosis, and suppress tumor-induced angiogenesis. Reported here are the final clinical and correlative study results from a phase II study.
This was an open-label, single-arm, study of patients (pts) with hiastologically confirmed grade 1/2 and stage III/IV measurable FL. Pts were either chemonaive or relapsed after 1 chemotherapy regimen or single-agent rituximab. Pts received 500 mg oral ENZ once daily (1125-mg loading dose on D1) ≤ 3 years or until progression, withdrawal, or toxicity. The primary endpoint was response rate (RR). Secondary objectives included progression-free survival (PFS), duration of response (DoR), and safety. Pre-treatment samples were used for correlative research. Staining was performed for BCL2, BCL6, CD10, Ki67, FOXP1, FOXP3, CD20, MUM1, CD68, and PD1 expression. ENZ-specific biomarkers investigated by immunohistochemistry (IHC; standard H scores range 0–300) included PKCβ2, PTEN, pS6, pGSK3β, and pCREB. Logistic/Cox regression determined the statistical correlation between clinical outcomes (RR or PFS) and IHC for each marker. All tests of association were conducted at a 2-sided α = 0.05.
Sixty-six pts (23 male, 43 female; median age 62 years
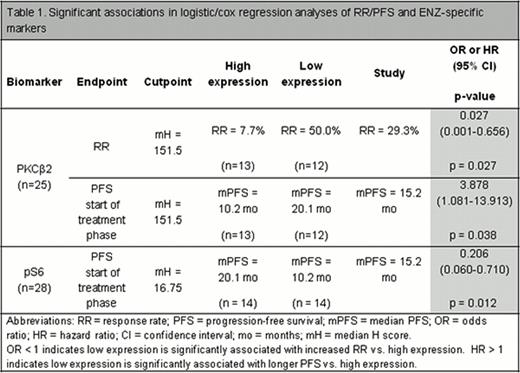
Tumor tissue was obtained from 28 pts. Patient demographics and overall RR were well balanced between protocol and correlative study populations. No significant associations with RR or PFS were observed for any FL-specific markers. Significant associations were observed between low cytoplasmic PKCβ2 and increased RR (median H score cutpoint 151.5, odds ratio (OR) [95%CI] = 0.027 [0.001-0.656], p=0.027) (Table 1, Figure 1). Significant associations were also observed between PFS and both cytoplasmic PKCβ2 and cytoplasmic pS6 using median H score cutpoint (Table 1).
ENZ has clinical activity and is well tolerated in pts with grade 1/2 FL. Low cytoplasmic PKCβ2 was significantly associated with increased RR and longer PFS; high cytoplasmic pS6 was significantly associated with longer PFS. The correlative results are hypothesis generating given the study's size and nonrandomized nature.

A) Plot of response rate vs. dichotomized PKCβ2 IHC H score, assessing the inner 80% of the marker distribution. At each of the H scores within the inner 80% of cytoplasmic PKCβ2 range, the patient population is dichotomized into high and low expression groups. The response rate is calculated and plotted for each of these two groups. Regardless of the cutpoint chosen, the RR in the low expression group is higher than the RR in the high expression group and higher than the overall study RR. B) Plot of unadjusted p-value (transformed on the –log10 scale) vs. H score comparing high to low expression group in the logistic regression model. Adjusted p-value is based on the asymptotic distribution of the maximal chi square statistics (Miller and Siegmund. Biometrics.1982; 38:1011-1016), limiting the assessment on the inner 80% of marker values.
A) Plot of response rate vs. dichotomized PKCβ2 IHC H score, assessing the inner 80% of the marker distribution. At each of the H scores within the inner 80% of cytoplasmic PKCβ2 range, the patient population is dichotomized into high and low expression groups. The response rate is calculated and plotted for each of these two groups. Regardless of the cutpoint chosen, the RR in the low expression group is higher than the RR in the high expression group and higher than the overall study RR. B) Plot of unadjusted p-value (transformed on the –log10 scale) vs. H score comparing high to low expression group in the logistic regression model. Adjusted p-value is based on the asymptotic distribution of the maximal chi square statistics (Miller and Siegmund. Biometrics.1982; 38:1011-1016), limiting the assessment on the inner 80% of marker values.
Hermann:Eli Lilly and Company: Research Funding. Hsi:Eli Lilly and Company: Research Funding. Hamid:Eli Lilly and Company: Employment. Myrand:Eli Lilly and Company: Employment. Lin:Eli Lilly and Company: Employment. Thornton:Eli Lilly and Company: Employment. Shi:Eli Lilly and Company: Employment. Nguyen:Eli Lilly and Company: Employment.

This feature is available to Subscribers Only
Sign In or Create an Account Close Modal