Abstract
Abstract 3797
Since the time of initial proposal of the MD Anderson Prognostic Score (MDAPS) in 2000, there has been substantial development in diagnosis and treatment for patients (pts) with CMML. MDAPS did not incorporate cytogenetic abnormalities, which is one of the most important factors of prognostication in other myeloid malignancies. Therefore, we analyzed a large cohort of patients with CMML and developed new prognostic scoring system that also incorporates cytogenetic abnormalities (named MDAPS-R).
From 2003 and 2012, we identified 358 pts with diagnosis of CMML, using standards strictly defined by World Health Organization (WHO) criteria. Potential prognostic factors were identified by log-rank test. Of those, independent prognostic factors were extracted after Cox proportional hazard regression. Based on the relative strength of hazard ratio (HR), MDAPS-R was developed and was verified by log-rank test.
Median age of the analyzed group was 68 years (range:23–89);113 (32%) pts were female. Two hundred twenty one (62%) pts were classified as CMML-1 and 104 (29%) were CMML-2 (unknown in 33 pts). Thirty nine (11%) pts had prior exposure to chemotherapy and/or radiation therapy. Mean (± SE) white blood cell count (WBC) was 24.5 ± 1.5 (x103/μL), hemoglobin (Hb) was 10.8 ± 0.1(g/dL), platelet count (Plt) was 132 ± 7.0 (x103/μL) and bone marrow blast count (BMBL) was 6.9 ± 0.3 (%), respectively. Cytogenetics was diploid in 224 (63%) pts. Trisomy 8 was detected in 14 (4%) pts, del 20q in 12 (3.4%), -Y in 13 (3.6%), del 7q/-7 in 25 (7%), and del 5q/-5 in 10 (2.8%) pts, respectively. Complex cytogenetic abnormality was detected in 16 (4.5%) pts. Two hundred eighty (78%) pts had RAS mutation analysis and 49 (18%) had NRAS mutation while 16 (5.7%) had KRAS mutation. FLT3 alteration was tested in 297 pts (83%):3 (1%) had D835 mutation while 10 (3.4%) had ITD. JAK2 mutation was tested in 161 (45%) pts of which 19 (12%) had V617F mutation. Less commonly occurring mutations included: NPM1 (5/88 tested), c-kit (3/156), CEBPA (6/83), IDH1 (1/59), IDH2 (3/58), and DNMT3a (1/4).
During the median follow up duration of 15 months (range; 1–145), 53 (15%) pts transformed to acute leukemia and 182 (51%) pts died. Median transformation free survival (TFS) and overall survival (OS) of the analyzed group was 24.9 months (range; 1–145) and 26.8 months (range; 1–145), respectively.
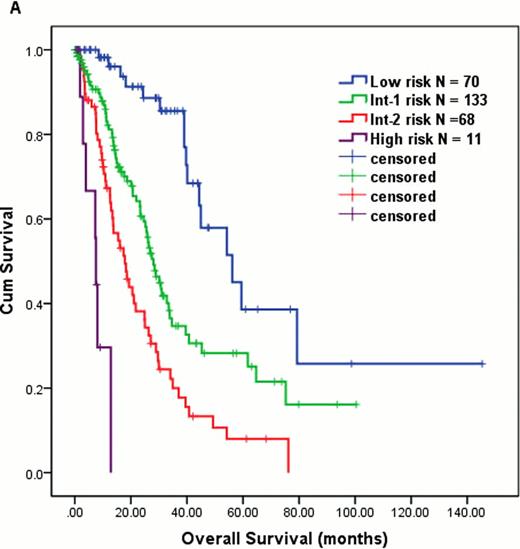
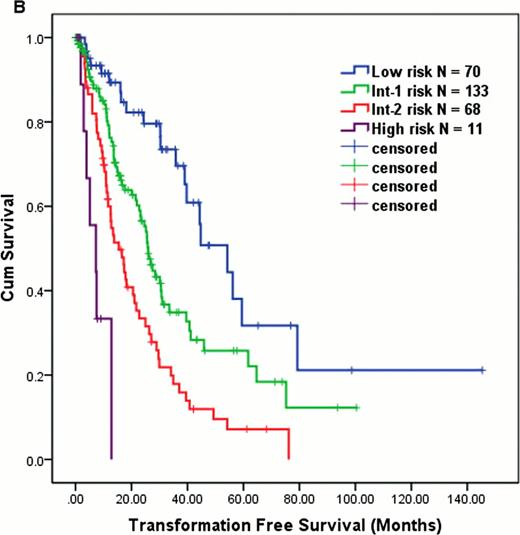
Log-rank test identified significant covariates in association with OS that include: BMBL (<10 vs. ≥10; P = 0.024), WBC (≤10 vs. >10; P = 0.01), Hb (<12 vs. ≥12; P < 0.001), CMML subtype (CMML-1 vs. 2; P = 0.007), prior exposure to chemo and/or radiation (Yes vs. No; P < 0.001), cytogenetics (diploid vs. complex or del7q/-7 vs. others; P < 0.001), serum β2 microglobulin (β2MG) (≤4.0 vs >4.0; P < 0.001), serum LDH (≤700 vs. >700; P < 0.001), peripheral absolute lymphocyte count (ALC) (≤2.5 vs. >2.5; P < 0.001), and peripheral absolute monocyte count (≤4.0 vs. >4.0; P = 0.012). None of the molecular mutations had impact on OS. After being fitted into Cox proportional hazard regression, following covariates remained independently significant: BMBL ≥10 % (vs. <10; HR = 1.6), Hb < 12 g/dL (vs. ≥12; HR = 1.9), LDH > 700 IU/L (vs. ≤700; HR = 1.5), ALC > 2.5 × 10³/μL (vs. <2.5; HR = 1.7), β2MG > 4.0 mg/L (vs. ≤ 4.0; HR = 1.6), and complex cytogenetics or del 7q/-7 (vs. diploid; HR = 2.3 and others vs. diploid; HR = 1.5). We developed MDAPS-R based on relative strength of HR in each of these above factors (1 point assigned to each of the following: BM BL '10 %, Hb<12 g/dL, LDH 700 IU/L, ALC .2.5 × 103/μL, and β2MG > 4.0 mg/L; 0 points for diploid cytogenetics, 2 points for −7/del 7q or complex cytogenetics, and 1 point for all other abnormal karyotype). Among 358 pts, 282 (79%) were evaluable for analysis via MDAPS-R. MDAPS-R stratified pts into 4 distinct prognostic groups: score 0–1 = low risk (N = 70, median OS 56 months), 2–3 = intermediate-1 risk (N = 133, median OS 28 months), 4–5 = intermediate-2 risk (N = 68, median OS 18 months), and 6–7 = high risk (N = 11, median OS 7.5 months) (P < 0.001, Figure 1A). MDAPS-R also predicted TFS in the same cohort (median TFS: low = 54, int-1 = 26, int-2 = 15, and high = 7 months, P < 0.001, Figure 1B).
We propose a refined version of MDAPS (MDAPS-R) specifically for pts with CMML that incorporates cytogenetic abnormalities. This model may help risk-stratified decision making in CMML pts.
OS (A) and TFS (B) in CMML pts using MDAPS-R.
No relevant conflicts of interest to declare.
Author notes
Asterisk with author names denotes non-ASH members.


This feature is available to Subscribers Only
Sign In or Create an Account Close Modal