Abstract
Abstract 2123
The leading cause of death in thalassemia major patients remains the heart failure, but impairment of the endocrine and exocrine function of the pancreas is a common complication. Multiecho T2* Magnetic Resonance Imaging (MRI) is a well established technique for heart and liver iron overload assessment. Little is known about the relationship between myocardial iron burden and cardiac function with pancreatic siderosis.
Aim of our study was to investigate using quantitative MRI the correlation between heart iron overload and function with pancreatic siderosis in thalassemia major patients.
We studied 147 thalassemia major patients (233 males, mean age 31±9 years) consecutively enrolled in the Myocardial Iron Overload in Thalassemia network where MRI (1.5 T) was performed using standardized and validated procedures. Myocardial iron overload was measured by T2* multislice multiecho technique. Biventricular function parameters were quantitatively evaluated by cine images. Pancreatic iron burden was measured using a T2* gradient-echo multiecho sequence. The images were analyzed using a previously validated, custom-written software (HIPPO-MIOT IFC-CNR®).
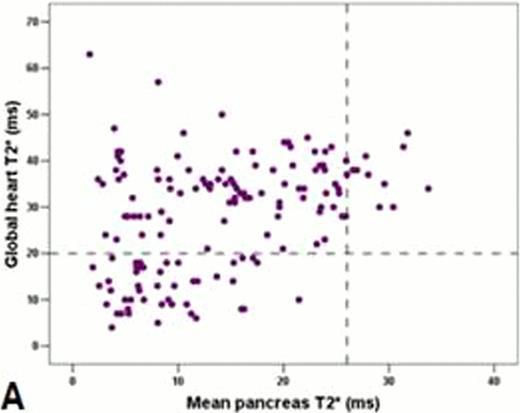
Significant positive correlations of the global pancreas T2* values were demonstrated for global heart T2* values (r=0.355, P<0.0001; Figure 1), number of segments with normal T2* (r=0.389, P<0.0001) and T2* values in the mid-ventricular septum (r=0.323, P<0.0001). Of the 136 patients with pancreatic iron overload, 45 (33.1%) had a pathological global heart T2* value. No patients without pancreatic iron overload had cardiac iron overload. A normal global pancreas T2* value showed a negative predictive value of 100% for cardiac iron.
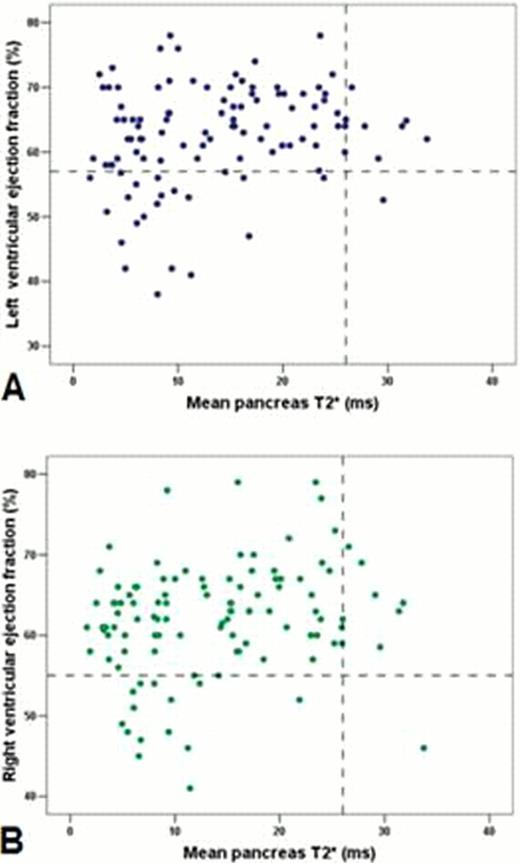
Pancreatic T2* values were positively related with left ventricular (r=0.21, P=0.028; Figure 2A) and right ventricular (r=0.23, P=0.015; Figure 2B) ejection fractions. No significant correlation was found between pancreatic T2* values and biventricular volumes.
Pancreatic iron overload is positively correlated to myocardial iron overload and negatively correlated to bi-ventricular systolic function.
Scatter diagram and regression line of global heart T2*values versus global pancreas T2* values. The horizontal and vertical dotted lines in each graph represent the cut-off for T2* values.
Scatter diagram and regression line of global heart T2*values versus global pancreas T2* values. The horizontal and vertical dotted lines in each graph represent the cut-off for T2* values.
Scatter diagram of left ventricular (A) and right ventricular (B) ejection fractions versus global pancreas T2*. The horizontal and vertical dotted lines in each graph represent the cut-off for ejection fractions and T2* values, respectively.
Scatter diagram of left ventricular (A) and right ventricular (B) ejection fractions versus global pancreas T2*. The horizontal and vertical dotted lines in each graph represent the cut-off for ejection fractions and T2* values, respectively.
No relevant conflicts of interest to declare.
Author notes
Asterisk with author names denotes non-ASH members.


This feature is available to Subscribers Only
Sign In or Create an Account Close Modal