Abstract
Abstract 1682
With the success of targeted oral tyrosine kinase inhibitor (TKI) therapy, long-term/life-long therapy for patients with chronic myelogenous leukemia (CML) can now be envisaged. Dasatinib is a second generation TKI, which in a phase I clinical trial was found to be 100–300 times more potent at inhibiting tyrosine kinases than imatinib. In vitro data suggest that dasatinib therapy also may have a direct effect on bone metabolism by interfering with c-FMS, c-SRC and the PDGF-R pathways (Boufker et al, BMC Cancer 2010, 10:298). In this study, we evaluated the effects of dasatinib monotherapy on bone homeostasis of CML patients treated at our center between 2006 and 2011. The levels of traditional biomarkers of bone health, namely serum bone specific alkaline phosphatase isoenzyme (BAP) and osteoprotegerin (OPG) were measured and were correlated with morphometric assessment of bone marrow biopsy specimens (BM Bx). We also assessed for any correlations between bone homeostasis and the results of conventional cytogenetics and molecular analysis with respect to treatment response.
The study group included 23 patients with chronic phase CML without evidence of clonal evolution who were treated with dasatinib. The median age was 51 years (range, 25–63) with a male to female ratio of 1.5: 1. Four different treatment groups were assessed (20mg/day, 40 mg/day, 80 mg/day and 100 mg/day). We compared paired BM specimens, obtained at initial diagnosis and 12–51 months (mos) after commencing dasatinib therapy. We performed whole slide imaging (Philips) on routinely stained BM Bx and specimen compartments were quantified using an area pixel count algorithm (Image Pro Plus system Version 6.3, MediaCybernetics, Bethesda, MD, USA) to calculate trabecular bone volume as a percentage area. The morphometric results were correlated with the results of conventional cytogenetics and molecular analysis obtained every 3 mos after enrollment. We also performed competitive inhibition ELISA assays to measure serum levels of OPG (baseline and after 12/18 mos) and BAP (every 4 mos), respectively.
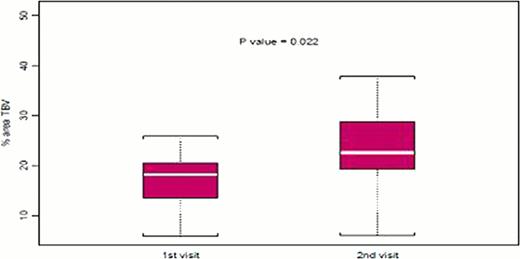
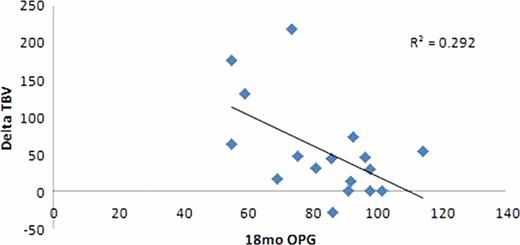
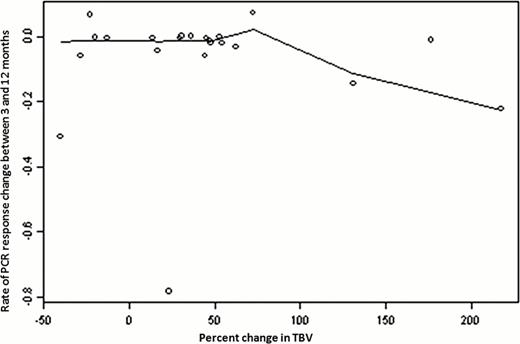
With a median follow up of 24 mos (range 12–51mo), a significant increase in trabecular bone volume (TBV) was noted (p=0.022, Figure 1); 74% (17 pts) showed an increase in TBV on therapy, with an absolute increase of 5.2% (mean). Twelve of 16 pts (75%) evaluated had a decrease in OPG after 18 mos, which correlated in 90% of pts with an increase in TBV using a linear regression model (p= 0.0017, Figure 2). No significant difference was detected in TBV changes among the four dose groups. There was no significant trend in serum BAP levels, thus no statistical correlation was performed at this time point. All patients treated with dasatinib showed cytogenetic and molecular BCR-ABL1 response. There was no correlation between the degree of TBV change and either cytogenetic or molecular response (Figure 3)
Our results indicate that within the therapeutic range for CML patients, dasatinib therapy promotes bone formation. However, there was no correlation between the dose levels studied and degree of bone formation and no correlation between TBV change and either cytogenetic or molecular response. The combination of digital image analysis and bone biomarkers enhances our understanding of bone homeostasis in patients on dasatinib. Further studies in a larger cohort of patients will be helpful to further validate our results.
Figure 1 : mean and standard deviation of TBV for each visit.
Figure 2 : correlation between “percent change TBV between visit 1 and visit 2” and 18 months OPG levels (linear regression model R2 =0.292, p= 0.0017)
Figure 3 : association between “percent change in TBV between visit 1 and visit 2” and “Rate of PCR response change between 3 and 12 months” (Spearman correlation coefficient = −0.05; p =0.81)
Association between delta TBV and the rate of change in BCR-ABL1 transcript levels
Association between delta TBV and the rate of change in BCR-ABL1 transcript levels
Cortes:Ariad: research support and consulting, research support and consulting Other; Pfizer: research support and consulting, research support and consulting Other; Novartis: research support and consulting, research support and consulting Other; BMS: research support and consulting Other.
Author notes
Asterisk with author names denotes non-ASH members.


This feature is available to Subscribers Only
Sign In or Create an Account Close Modal