To the editor:
The HemaExplorer Web server allows for an easy display of mRNA expression profiles for query genes in murine and human hematopoietic stem and progenitor cells that represent consecutive developmental stages along the myeloid differentiation pathway. In addition, it provides the ability to compare gene expression levels in human acute myeloid leukemia (AML) cells with expression levels in normal human hematopoietic stem cells and hematopoietic progenitor cells. The Web server is freely available at http://servers.binf.ku.dk/hemaexplorer/.
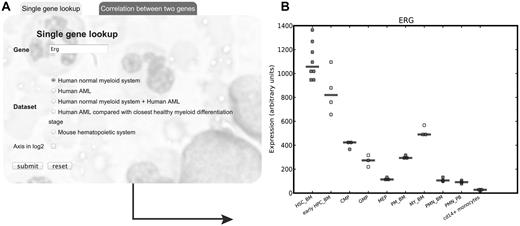
The HemaExplorer Web server can take 1 gene as query and provides a plot of the expression of the gene in both hematopoietic stem and progenitor populations as well as in mature lineages. Alternatively, a query of 2 genes depicts their relationship in a scatter plot. Currently the database contains options for the human hematopoietic system, human AML, and the murine hematopoietic system (see Figure 1).
Example of gene query to the HemaExplorer Web server. (A) Web server interface for single gene lookup with gene query, options for dataset and scale of axis. (B) Output plot from the Web server displaying gene expression for the ERG transcription factor in the normal myeloid system. CMP indicates common myeloid progenitor cell; GMP, granulocyte monocyte progenitors; HSC_BM, hematopoietic stem cells from bone marrow; MEP, megakaryocyte-erythroid progenitor cell; MY_BM, myelocyte from bone marrow; PMN_BM, polymorphonuclear cells from bone marrow; PMN_PB, polymorphonuclear cells from peripheral blood; PM_BM, promyelocyte from bone marrow; and early HPC_BM, hematopoietic progenitor cells from bone marrow.
Example of gene query to the HemaExplorer Web server. (A) Web server interface for single gene lookup with gene query, options for dataset and scale of axis. (B) Output plot from the Web server displaying gene expression for the ERG transcription factor in the normal myeloid system. CMP indicates common myeloid progenitor cell; GMP, granulocyte monocyte progenitors; HSC_BM, hematopoietic stem cells from bone marrow; MEP, megakaryocyte-erythroid progenitor cell; MY_BM, myelocyte from bone marrow; PMN_BM, polymorphonuclear cells from bone marrow; PMN_PB, polymorphonuclear cells from peripheral blood; PM_BM, promyelocyte from bone marrow; and early HPC_BM, hematopoietic progenitor cells from bone marrow.
The Web server accepts gene symbol aliases as long as they are unambiguous, for example the query “p53” will be interpreted as TP53. The Web server will provide output plots for download in ready-to-publish quality. In addition, the raw data for the query gene is available for download. There is also an advanced option allowing for selection of the cell types presented by the output plot.
The database was build using manually curated public available gene expression datasets from multiple studies all generated on the Affymetrix platform (Human 133UA and 133UB and 133.Plus2 microarrays; Mouse Genome 430 2.0 Array).1,,,,,,,–9
To correct for batch effect the datasets were sorted by platform and laboratory, before RMA normalization and subsequent processing with ComBat.10 As several platforms are represented in the dataset, only the overlapping probe sets were retained for further processing. Importantly, fold changes for AML samples were computed using a novel normalization method that first identifies the nearest normal counterpart to the individual AML sample and use this to compute gene expression changes in the AML sample (N.R., J.J., K.T.M., O.W. and B.T.P, unpublished data, May 2012). For genes detected by more than 1 probe sets on the microarrays, gene expression levels are presented by the probe set with the highest mean expression level; data from all available array probe sets are available for download.
In summary, the HemaExplorer Web server will provide researchers with a powerful tool to check expression levels for genes of interest in normal hematopoiesis as well as AML.
Authorship
F.O.B. and N.R. contributed equally to this work.
Acknowledgments: This work was supported by grants from the Danish Agency for Science Technology and Innovation, and The NovaNordisk Foundation.
Contribution: N.R., K.T.-M., and B.P. developed the original idea; F.O.B. made the Web server; B.K., N.R, and K.T.M. conducted data collection; F.O.B., N.R., K.T.M., and B.P. wrote the letter; and O.W. and L.J.J. reviewed the Web server.
Conflict-of-interest disclosure: The authors declare no competing financial interests.
Correspondence: Bo Porse, Finsen Laboratory, Rigshospitalet, University of Copenhagen, Ole Maaløesvej 5, 2200 Copenhagen N, Denmark; e-mail: bo.porse@finsenlab.dk.


This feature is available to Subscribers Only
Sign In or Create an Account Close Modal