

Comparison of the pharmacokinetics (PK) of a coagulation factor between groups of patients can be biased by differences in study protocols, in particular between blood sampling schedules. This could affect clinical dose tailoring, especially in children. The aim of this study was to describe the relationships of the PK of factor VIII (FVIII) with age and body weight by a population PK model. The potential to reduce blood sampling was also explored. A model was built for FVIII PK from 236 infusions of recombinant FVIII in 152 patients (1-65 years of age) with severe hemophilia A. The PK of FVIII over the entire age range was well described by a 2-compartment model and a previously reported problem, resulting from differences in blood sampling, to compare findings from children and adults was practically abolished. The decline in FVIII clearance and increase in half-life with age could be described as continuous functions. Retrospective reduction of blood sampling from 11 to 5 samples made no important difference to the estimates of PK parameters. The obtained findings can be used as a basis for PK-based dose tailoring of FVIII in clinical practice, in all age groups, with minimal blood sampling.
Introduction
Prevention or treatment of bleedings in patients with hemophilia A requires that an adequate plasma level of factor VIII (FVIII) is achieved by infusion of FVIII concentrate. The plasma level versus time curve of FVIII depends on the dose and on the pharmacokinetics (PK) of FVIII in the patient. The clinical implications of this have recently been reviewed.1,2 Because FVIII PK is not easily determined in clinical practice, observable patient characteristics, such as age and body weight (BW), are commonly used to guide dosing. Therefore, several studies have aimed to clarify relationships between such characteristics and measured PK parameter values.3,,,,,,,,,–13
We have previously published a PK study on recombinant FVIII, comparing the results from patients 1 to 6 years of age and 10 to 65 years of age.13 In brief, in vivo recovery was lower, BW-adjusted clearance (CL) was higher and elimination half-life (t½) was on average shorter in children than in adults. However, a reduced blood sampling schedule for the small children (1 preinfusion and 4 postinfusion blood samples compared with 1 and 10 from the older patients) was shown to account for up to one-half of the observed differences in median recovery and t½. In addition, we confirmed a previous conclusion12 that the PK of FVIII cannot be predicted from a patient's BW and age. The implications are that comparisons of PK between children and adults should be performed using methodology that is not sensitive to differences in study protocols and that methods should be available to estimate individual FVIII PK in a clinical setting. The present study addresses these issues by the use of a population PK model.
Population PK modeling means that models are fitted to all concentration versus time data from all patients simultaneously, using a PK model integrated with a covariate and a statistical model.14,15 The covariate model describes relationships between PK parameters and patient characteristics. The statistical model describes the variance in PK between and within persons as well as residual variance caused by biologic variability, measurement errors, and errors in the fit of the model to the data. Population PK models are very suitable to combine data from several studies with different administration and blood sampling schemes. The application of such a model could therefore minimize the impact of differences in blood sampling schemes on estimated PK parameters. In addition, the information obtained from a population PK model can be used to simplify PK measurements in clinical practice.2,16,,–19
The aim of the study was thus to describe the relationships of the PK of FVIII with age and BW in our large sample of patients. The potential of the population PK model to minimize the influence of differences in blood sampling schedules on estimated parameters and to generally reduce blood sampling in PK studies was also explored.
Methods
Plasma FVIII versus time data (Figure 1) were compiled from 3 FVIII (ADVATE; Baxter Healthcare Corporation) clinical trials in previously treated patients with severe hemophilia A (FVIII ≤ 2 IU/dL): 184 full PK datasets (10 postinfusion samples) for 100 adults/adolescents 10 to 65 years of age,20 and 52 reduced sample PK datasets (4 postinfusion samples) for 52 children 1 to 6 years of age (Table 1).11 No patient had inhibitors detectable by Bethesda assay or a history of known inhibitors. The data compilation and PK analysis by conventional methods have been described in detail in our previous publication.13 In brief, terminal t½ was estimated by linear regression according to Lee et al21 and CL and volume of distribution at steady state (Vss) by noncompartmental methods.22 Incremental in vivo recovery (ie, peak level of FVIII in IU/dL divided by dose in IU/kg) was calculated from the observed maximum level of FVIII. This was most often at 15 minutes with the full, and always at 1 hour with the reduced, blood sampling scheme. The results are used without modification for comparison with the new population modeling estimates.

Patients and FVIII data
| Children | Adolescent/adult | |
|---|---|---|
| Study | Pediatric11 | Pivotal and continuation20 |
| Median age, y (range) | 3.5 (1.1-6.0) | 19 (10-66) |
| Median weight, kg (range) | 16 (11-27) | 68 (35-108) |
| No. of subjects | 52 | 100 |
| No. of PK assessments | 52 | 184 |
| No. of FVIII activity data | 206 | 1829 |
| Blood sampling schedule | Reduced schedule | Full schedule |
| Preinfusion sample | Within 30 minutes | Immediately before |
| Postinfusion samples | 1, 9, 24, and 48 hours | 15 and 30 minutes, 1, 3, 6, 9, 24, 28, 32, and 48 hours |
The model was built using nonlinear mixed effects modeling with the first-order integral approximation method in the SAS Version 9.13 software (NLMIXED procedure), similar to the procedure in an earlier study using the NONMEM Version 6 software.12 The model is described in detail in supplemental Methods (available on the Blood Web site; see the Supplemental Materials link at the top of the online article). It was built in a stepwise fashion. First, the structural (compartmental PK) model was developed together with the residual error model. Interindividual variance was added; and because some patients had received FVIII twice, the inclusion of interoccasion (or within-individual) variance was tested.23 Finally, age was tested as a covariate (BW was included already in the structural model). The ability of each successive model to describe the data was evaluated using the −2 log likelihood (−2LL) value and graphical evaluation of observed versus predicted values.
The structural models tested were the standard 1- and 2-compartment PK models. The 1-compartment model parameters were CL and volume of distribution (V1). For the 2-compartment model, intercompartmental clearance (Q) and volume of the second compartment (V2) were added. Three different models were evaluated to describe the residual error; an additive error, a proportional error, and a combined additive and proportional error. Exponential models were applied to account for interindividual and interoccasion variance in the PK parameters according to:

The subscripts i and k indicate individual and occasion, respectively, and the typical value is the mean value of the parameter in the population. ηi is the random effect accounting for interindividual, and κik for interoccasion, variance.
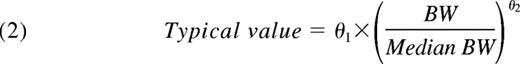
In this expression, θ1 is the parameter value for a subject with a BW corresponding to the median BW of the population and θ2 is the allometric exponent. Finally, the possible additional covariate effects of age on CL and V1 were explored.
After the model building, individual values for CL, Q, V1, V2, Vss (V1 + V2), and elimination t½ were obtained for all patients and all study occasions as empirical Bayes estimates (ie, by Bayesian estimation using the population model parameters in conjunction with the FVIII level data from each person).25 Typical values of CL and elimination t½ were calculated for a person with average BW at each age and used for plotting these parameters as functions of age. Individual CL values (or the mean of the 2 values in case of repeated infusion) from the 100 patients were used to investigate the statistical distribution of CL in the 10- to 65-year age group (the pediatric data were excluded to decrease bias caused by age-related changes).
Because in vivo recovery represents the FVIII level observed immediately after distribution of the dose in V1 (often assumed to correspond to plasma volume), model-predicted recovery was calculated for each individual from the model-estimated zero time FVIII level (C0) obtained as:
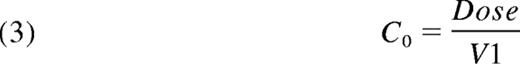
Finally, the effect on estimated PK parameters of reduced blood sampling was tested by rerunning the model using only data corresponding to the reduced sampling schedule applied in the pediatric study. Thus, the data from all patients were from sampling at 1, 9, 24, and 48 hours only. New estimates of both typical values (θ) and individual empirical Bayes estimates were thus obtained.
Results
The stepwise model development is outlined in Table 2. Based on the relative decrease in −2LL values, a 2-compartment model was superior to a 1-compartment model, and in both cases incorporation of interindividual variance led to further improvement. Inclusion of interoccasion variance for CL and V1 did not significantly improve the model, and these changes were thus rejected. As for the tested covariates, BW was accounted for by the allometric scaling. Despite an expected strong correlation between age and BW (r2 = 0.82 for the children and 0.46 for the adolescents/adults), the already weight-adjusted CL showed a significant relationship with age, whereas weight-adjusted V1 did not.
Summary of model building steps, with the −2LL values
| Model | Characteristics | No. of parameters* | −2LL |
|---|---|---|---|
| Structural model | |||
| 1 | 1 compartment | 5 | 17 215 |
| 2 | 1 compartment with IIV† allowed for V1 and CL | 8 | 17 053 |
| 3 | 2 compartments | 8 | 15 705 |
| 4 | 2 compartments with IIV† allowed for V1 and CL | 11 | 15 237 |
| Interoccasion variance (added to model 4) | |||
| 5 | Allowed for CL | 12 | 15 243 |
| 6 | Allowed for V1 | 12 | 15 264 |
| Covariate (added to model 4) | |||
| 7 | Age as covariate on CL | 12 | 15 232 |
| 8 | Age as covariate on V1 | 12 | 15 237 |
A lower value indicates a better model (a change of 3.85 units is significant at P = .05); thus, model 7 was the final one.
Number of estimated parameters in the model.
Interindividual variance.
Thus, the final population PK model for FVIII was a 2-compartment model with an additive residual error model. There was good agreement between model predictions and observations of FVIII levels (Figure 2). The primary parameter estimates for all 152 patients are presented in Table 3. With applicable covariates, the expressions for the parameters of the first compartment consequently were:
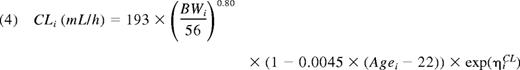
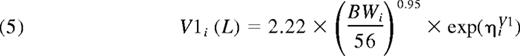
This equals 0.040 L/kg. Equations 6 and 7 give the expressions for the second compartment. Because the Q proved not to be significantly related to BW, the allometric relationship was deleted. Thus:

And, finally:
The typical V2 equals 0.013 L/kg. Thus, the typical Vss was V1 + V2 = 0.053 L/kg.

Observed and individually model-predicted FVIII levels plotted against each other. (A) Linear scale. (B) Logarithmic scale. Lines of identity are shown.
Observed and individually model-predicted FVIII levels plotted against each other. (A) Linear scale. (B) Logarithmic scale. Lines of identity are shown.
Parameter estimates for the final model, based on data from all patients
| Parameter | Full sampling* | Reduced sampling† | ||
|---|---|---|---|---|
| Mean | % RSE | Mean | % RSE | |
| Structural model parameters | ||||
| Clearance (CL), mL/h‡ | 193 | 2.7 | 188 | 2.8 |
| Volume of central compartment (V1), L§ | 2.22 | 1.9 | 2.26 | 2.2 |
| Intercompartmental clearance (Q), mL/h | 147 | 8.6 | 137 | 14 |
| Volume of peripheral compartment (V2), L§ | 0.73 | 7.8 | 0.75 | 7.9 |
| Interindividual variability parameters | ||||
| Clearance (% CV) | 30 | 15 | 30 | 15 |
| Volume of central compartment (% CV) | 21 | 14 | 23 | 14 |
| Correlation between CL and V1 | 0.45 | 22 | 0.49 | 22 |
| Residual variability parameters | ||||
| Additive residual error (SD), IU/dL | 8.9 | 3.5 | 7.1 | 5.7 |
| Covariate parameters | ||||
| Allometric exponent for CL | 0.80 | 5.9 | 0.75 | 6.3 |
| Allometric exponent for V1 | 0.95 | 2.8 | 0.97 | 2.9 |
| Allometric exponent for V2 | 0.76 | 18 | 0.82 | 14 |
| CL (% change with age different from 22 y) | −0.45 | 41 | −0.13 | 152 |
RSE indicates relative standard error; and CV, coefficient of variation.
Four postinfusion samples in children, 10 in adolescents/adults.
Four postinfusion samples in all patients.
Typical value for a person with median body weight (56 kg) and age (22 y).
Typical value for a person with median body weight (56 kg).
The frequency distribution of the individually estimated BW-adjusted CL in the adult patients is shown in Figure 3. (Because equation 1 describes a log-normal distribution of individual parameter estimates, this is depicted also in Figure 3.) A unimodal Gaussian distribution was found. The Kolmogorov-Smirnov test failed to reject the zero hypothesis of normality (P = .15).

The log-normal distribution of individually estimated clearance (mL/h per kg) in the 100 adolescent/adult patients.
The log-normal distribution of individually estimated clearance (mL/h per kg) in the 100 adolescent/adult patients.
CL and elimination t½ are shown as functions of age in Figure 4. Table 4 gives the summary statistics of the individual PK estimates in the 2 age groups, where they are also compared with results from the previous conventional PK calculations.13 A comparison of the table and the figures reveals that the median values for CL and t½ in the 10- to 65-year age group are markedly influenced by the data from the 10- to 20-year-old patients. The typical values for an “adult” (70 kg) at the midpoint of the age range (38 years) would be a CL of 3.1 mL/h per kilogram and a t½ of 13 hours. Table 4 also reveals that the difference in incremental in vivo recovery between the age groups given by the conventional PK analysis was not found in the model-predicted recovery values estimated by the population analysis. The difference in elimination t½ was, on the other hand, augmented in the population analysis.

Individually estimated pharmacokinctic parameter values. FVIII as functions of age. (A) Clearance and (B) terminal half-life. The trend curves are for the typical person (with ideal BW) at each year of age.
Individually estimated pharmacokinctic parameter values. FVIII as functions of age. (A) Clearance and (B) terminal half-life. The trend curves are for the typical person (with ideal BW) at each year of age.
Summary of individual parameter estimates: median values and 25th and 75th percentiles
| Parameter | Children (age 1-6 years; N = 52) | Adolescents/adults (age 10-65; N = 184) | ||||
|---|---|---|---|---|---|---|
| Population PK model | Individual PK analysis13 | Difference* | Population PK model | Individual PK analysis13 | Difference* | |
| Incremental recovery, (IU/dL per IU/kg) | 2.39† (2.18-2.64) | 1.84 (1.64-2.02) | 0.57 (0.53-0.63) | 2.50† (2.19-2.83) | 2.43 (2.10-2.80) | 0.08 (−0.05-0.19) |
| Clearance, mL/(kg × hr) | 4.72 (3.83-5.53) | 4.34 (3.39-5.46) | 0.29 (0.00-0.49) | 3.34 (2.59-4.21) | 3.31 (2.69-4.22) | 0.03 (−0.21-0.22) |
| Volume of distribution (Vss), L/kg | 0.059 (0.055-0.063) | 0.050 (0.045-0.058) | 0.008 (0.005-0.010) | 0.053 (0.047-0.059) | 0.048 (0.041-0.055) | 0.005 (0.002-0.008) |
| Terminal half-life, hours | 9.2 (8.0-10.6) | 9.4 (8.1-10.8) | −0.08 (−1.02-0.42) | 12.2 (10.5-13.9) | 11.1 (9.7-12.6) | 0.85 (−0.18-2.25) |
Difference = (population PK − individual PK).
Based on the projected level at time 0.
The results of the reduced sampling are also illustrated in Table 3. The reduction in sampling points had practically no influence on the estimates of typical CL, V1, Q, or V2, or on the estimates of interindividual variance. There were, however, some differences in the estimates of covariate parameters. With reduced sampling, the allometric exponent for CL was changed and the relationship between CL and age per se could not be reliably estimated (152% relative standard error). Figure 5 shows the individual estimates of in vivo recovery (IU/dL per IU/kg) and terminal t½, obtained according to the previous conventional13 and the present population PK analysis using either 4 or 10 postinfusion FVIII values, in the 10- to 65-year-old patients. Looking at recovery, it is immediately apparent (Figure 5A) that calculation from the 1-hour level available with reduced blood sampling as expected yielded a lower value than calculation from the maximum level observed with a full sampling schedule. In contrast, corresponding population PK model-predicted recoveries (dose/V1; Figure 5B) with full and reduced sampling were closely correlated. As for terminal t½ (Figure 5C-D), there was a closer agreement between estimates with full and reduced sampling with the population PK model than with the linear regression method.

Comparisons of individually estimated in vivo recoveries (IU/dL per IU/kg) and terminal half-lives (t½; hours) in the 10- to 65-year-old patients, as obtained using 10 (y-axis) and 4 (x-axis) postinfusion sample values. Lines of identity are shown. (A) Recovery, as calculated from dose and the first sample value (R2 = 0.982). (B) Model-predicted recovery, as calculated from dose and model-estimated central volume of distribution (V1) in the population pharmacokinetic (PK) model (R2 = 0.996). (C) Terminal t½ as originally estimated by linear regression (R2 = 0.985).13 (D) Terminal t½ estimated by the population PK model (R2 = 0.997).
Comparisons of individually estimated in vivo recoveries (IU/dL per IU/kg) and terminal half-lives (t½; hours) in the 10- to 65-year-old patients, as obtained using 10 (y-axis) and 4 (x-axis) postinfusion sample values. Lines of identity are shown. (A) Recovery, as calculated from dose and the first sample value (R2 = 0.982). (B) Model-predicted recovery, as calculated from dose and model-estimated central volume of distribution (V1) in the population pharmacokinetic (PK) model (R2 = 0.996). (C) Terminal t½ as originally estimated by linear regression (R2 = 0.985).13 (D) Terminal t½ estimated by the population PK model (R2 = 0.997).
Discussion
Population PK modeling was developed in the 1970s and gained widespread acceptance in the 1990s.14,26 It was endorsed by the United States Food and Drug Administration in 1999.27 Despite this, population PK modeling has been applied only recently to FVIII.12,16,–18,28 None of these studies aimed to compare population PK modeling with conventional21,22 methods for analysis of FVIII data. Our work, which, compared with previous studies, also includes the largest number of patients and the greatest spans in age and BW, clearly demonstrates the superiority of the population modeling. The influence of blood sampling schedule on PK estimates was markedly diminished. The findings also strongly suggest that it is possible to reduce blood sampling in PK studies, decreasing the inconvenience to the patient, the discomfort of venipuncture, and the cost of sample handling and assays.
The finding that a 2-compartment model, with V1 similar to the expected plasma volume of the patient, was needed to describe the data agrees with previous results of modeling rich FVIII datasets.12,16,–18 Estimation and description of covariate effects differ more between studies, depending on the nature of the data. Because age and BW are markedly correlated in children and adolescents, their possible separate relationships with PK can be difficult or impossible to ascertain. A commonly used approach in studies on children is to assume exponential allometric relationships between BW and PK parameters and then test whether a covariate for chronologic age per se can further improve the model. If the data are not adequate to allow actual estimation of allometric exponents, it is often assumed that clearance terms (CL and Q) are related to BW to the power of 0.75.24,29 This is similar to using body surface area as a proportionality factor because body surface area is approximately related to BW to the power of 0.7. For volume terms (V1 and V2), direct proportionality with BW is often assumed (ie, exponent = 1). The use of allometric expressions allows PK modeling to be based on directly recorded data, such as BW and age. Using input values that themselves require calculation and are subject to biologic uncertainty, such as body surface area or lean or ideal BW, introduces variance that is not evaluated in the model itself. The wide range in BW in the present dataset allowed estimation of the allometric exponents, which significantly improved the model compared with fixing the values at 0.75 and 1.0. However, the estimates were still similar to the assumed values. The differences in estimates of exponent and relationship with age for CL between the full and the reduced sampling dataset (Table 3) illustrate that, in accordance with equation 4, a change in one of the descriptors is expected to influence the other one.
Incorporation of interoccasion variance for CL or V1 gave no significant improvement of the model. In our previous PK and statistical analysis of findings from 83 patients who received 2 infusions of FVIII,13 median interoccasion (or within-patient) variance in CL was less than one-sixth of median interindividual variance, and for V1 it was less than one-third. The failure of interoccasion variance to improve the model was thus expected. In practice, the much lower interoccasion than interindividual variance means that PK is fairly reproducible within the patient (at least at a certain age and BW). Thus, estimation of individual PK provides a better base for dose tailoring than the use of population mean values for PK parameters.
Looking then at the final results, the model and parameter estimates for ADVATE are remarkably similar to those for mainly plasma-derived FVIII based on data obtained in 1989 to 2004 at the Malmö center.12 For the reference “adult” patient (38 years, 70 kg; see Results section), the typical PK parameter values would be (ADVATE vs [plasma-derived FVIII] estimate): CL = 214 [205] mL/hr, Vss = 3.6 [3.9] L, terminal t½ = 13 [13] hours. These numbers agree with normally accepted mean values for FVIII in adult patients.7 Presented plots of CL and t½ as functions of age (Figure 4 in this publication and Figure 3 in Bjorkman et al).12 are superimposable. The unique feature of the present model, however, is the incorporation of abundant data from 1- to 6-year-old patients. This allows an estimation of PK as a function of age over the whole range from 1 year and upwards. No deviations from the model can reasonably be expected in the 6- to 10-year gap in the ADVATE data, and this gap is filled by the Malmö data. Thus, Figure 4A-B, with trend curves based on single or repeat PK assessments in 152 persons, shows relationships that have hitherto been illustrated more or less piecemeal, for limited ranges of age and BW, in the literature.4,–6,9,,–12 It can be confirmed that the CL per kilogram BW of FVIII decreases markedly during growth and continues to decline slightly during adulthood. Elimination t½, which is inversely related to CL, thus follows an opposite trend.
The observed changes in t½ with age will have a marked effect on the dose of FVIII required to maintain a desired trough level during prophylaxis1 and show that the dose of FVIII per kilogram BW required for adequate prophylaxis probably changes throughout a patient's life. The variance in t½, however, means that, if prophylaxis is to be based on t½, then this will have to be measured in each person rather than estimated based on age. The unimodal distribution of BW-adjusted CL in the 10- to 65-year-old patients also shows that patients (without inhibitors) cannot be grouped into persons with “slow” and “rapid” catabolism of FVIII. Inclusion of patients with detectable inhibitors and consequent high CL values would theoretically produce a separate peak to the right of the presented distribution.
In contrast to previous estimations using the same data,13 the model predicts no difference in incremental in vivo recovery between children and adolescents/adults. This has a direct bearing on dosing for treatment of bleedings and agrees with results from 297 direct measurements in 50 patients in the age range 1.5 to 67 years.30 It also demonstrates the robustness of the population PK model. Reducing blood sampling so that the first sample was taken at 1 hour influenced the directly calculated recovery but had little influence on the V1 (and thus recovery) that the PK model estimates from all available data. Even though ISTH guidelines22 allow the use of a 1-hour sample for assessment of recovery in small children, the decline in FVIII level from the actual peak obtained seems likely to produce an underestimation.
Creation of a population PK model for patients of all ages provides a basis for estimation of individual PK by sparse sampling FVIII data and Bayesian analysis.2,16,,–19 In the Bayesian procedure, the most likely PK parameter values in the individual patient are estimated from a limited number of FVIII levels, based on previous knowledge of FVIII PK in the population. Because population PK and Bayesian computer programs can use the patient's dosing history and predose FVIII levels as input data, there is no need for a “washout” of previous doses (ie, no interruption of treatment is required). The presented population parameter values provide the prior information needed for this type of analysis for the whole age range of inhibitor-free hemophilia A patients.
In conclusion, the full description of FVIII PK as a function of age and the parameter values and relationships shown here will help to design prophylactic schedules appropriate for the individual patient. The use of these potentially very useful tools to target predefined trough levels in routine clinical practice will require that the PK information is incorporated into easily used therapeutic drug monitoring computer programs, and this has already been shown to be feasible.19 This will allow hemophilia centers to assess individual FVIII PK in children and adults using only 2 or 3 postinfusion samples. The population PK model described here therefore has the potential to lead to a significant change in the way patients with hemophilia are monitored and treated.
The online version of this article contains a data supplement.
The publication costs of this article were defrayed in part by page charge payment. Therefore, and solely to indicate this fact, this article is hereby marked “advertisement” in accordance with 18 USC section 1734.
Acknowledgments
The ADVATE clinical program is sponsored by Baxter Healthcare Corporation.
Authorship
Contribution: S.B., M.O., P.S., and S.F. analyzed the data; and all authors conceived the study, interpreted the findings, critically wrote or revised the intellectual content, and approved the final version of the manuscript.
Conflict-of-interest disclosure: S.B., K.F., V.S.B., and P.W.C. have received consultant, advisory, and/or speakers honoraria from Baxter. M.O., G.S., P.S., S.F., B.M.E., and K.C. are Baxter employees.
Correspondence: Sven Björkman, Department of Pharmaceutical Biosciences, Box 591, Uppsala University, SE-751 24 Uppsala, Sweden; e-mail: sven.bjorkman@farmbio.uu.se.
