Abstract
Population-based registries may provide data complementary to that from basic science and clinical intervention studies, all of which are essential for establishing recommendations for the management of patients in the real world. The same quality criteria apply for the evidence-based label, and both high representation and good data quality are crucial in registry studies. Registries with high coverage of the target population reduce the impact of selection on outcome and the subsequent problem with extrapolating data to nonstudied populations. Thus, data useful for clinical decision in situations not well covered by clinical studies can be provided. The potential clinical impact of data from population-based studies is exemplified with analyses from the Swedish Acute Leukemia Registry containing more than 3300 acute myeloid leukemia (AML) patients diagnosed between 1997 and 2006 with a median follow-up of 6.2 years on (1) the role of intensive combination chemotherapy for older patients with AML, (2) the impact of allogeneic stem cell transplantation on survival of younger patients with AML, and (3) the continuing problem with early deaths in acute promyelocytic leukemia. We also present the first Web-based dynamic graph showing the complex interaction between age, performance status, the proportion of patients given intensive treatment, early death rate, complete remission rate, use of allogeneic transplants, and overall survival in AML (non-AML).
Introduction
“… every hospital should follow every patient it treats, long enough to determine whether or not the treatment has been successful, and then to inquire ‘if not, why not?’ with a view to preventing similar failures in the future.” E. Amory Codman, 1916
Quality registration to improve outcome of medical management is attributed to the Boston surgeon Ernest Amory Codman (1869-1940). In the early 1900s, he advocated systematic and prolonged follow-up of patients, with assessment of benefits and failures, the so-called End-Result Idea.1 In 1920, Codman created the first cancer registry on bone sarcomas. He anticipated his ideas to be established in a few years. However, not until several decades later did cancer registries with survival outcome start to develop in the United States, Scandinavia, the United Kingdom, and elsewhere. In addition, quality registries on performed procedures were launched; the first in Sweden was on knee surgery and started in 1975. There are currently 71 Swedish National Health Care registries funded by Swedish Association of Local Authorities and Regions (SKL), with 8 registries on the major hematologic malignant entities and 15 others in cancer.2
Population-based registries are required for the analysis of incidence and mortality rates and trends3 but are also useful as complement to clinical studies to support decision on individual patient management.2 To provide valid data, the registry must cover the majority (eg, > 95%) of the defined population, report relevant parameters with good quality, and have a close to complete follow-up. Here we discuss the pros and cons of population-based registry data from adults with acute myeloid leukemia (AML) and scrutinize accuracy and evidence of benefit. We will also present some recent examples on how registry data may have influence in our daily clinical practice. We further show the complex interaction between age, performance status (PS), management, and outcome in a large complete population of AML patients through a dynamic Web-based moving graph.
Evidence-based management
Evidence-based medicine requires, according to Sackett et al, integrating individual clinical expertise with the best available external clinical evidence from systematic research in basic sciences and from patient-centered clinical research of various kinds.4 Evidence-based medicine supports clinical recommendations. The strength of the given recommendation can be judged only after careful consideration of the balance between benefits and harms, the quality of the evidence, the translation of the evidence into the specific circumstances, and of the certainty of baseline risk. According to the GRADE Working group, one must consider all relevant outcome measures with the evidence for each specific outcome, and with an evaluation of the quality of that evidence.5 This requires analysis of study design, study quality, and consistency between results from different studies. The possibility to transfer the results from available studies to the situation of interest is also important. Surrogate outcomes and patient populations not representative of the actual situation decrease the usefulness of data. These criteria should be the same for clinical interventions and population-based studies.
Meta-analyses of data from several randomized studies provide the highest level of evidence. However, the investigated question must be relevant, the study population representative, the quality high, and the outcome interpretable. Large randomized trials are very expensive to run, especially with the regulations of today, and economy, patient numbers, and manpower limit the number of questions that can be addressed.6 There is a lack of older patients in clinical trials,7 and inclusion into clinical studies, especially those sponsored by the pharmaceutical industries, is often restricted8 in a way that few patients in the daily practice could be eligible. When looking at the inclusion rates in recent large phase 3 trials in AML worldwide, the typical finding is around 2 (range, 1-5) patients per institution and year, also in studies of older patients common in the ordinary clinical department. Publication bias9 still exists, although this problem is reduced by the clinical study registration. Outcome results from studies thus need to be extrapolated onto the patients in the real world. Even with great efforts and patient numbers, such as in the AML studies from the Medical Research Council in the United Kingdom,10,11 the amount of new knowledge gained has been limited. Thus, new approaches to run clinical studies have been discussed12 and developed, such as the “Pick a Winner” trial design, as recently described.13
At its best, a population-based study may involve not only a representative sample but the total defined population, although, like a clinical study, the results will be somewhat from the past. If data reporting is adequate, valid, and complete, useful results could be achieved in areas not accessible by clinical studies. However, the lack of intervention, the limited dataset available, and the restricted resources for validation require careful consideration, and differentiation between data on surrogate markers from those that provide direct information.
Acute leukemia: the size of the problem and trends
In the United States, every year 18 000 people are diagnosed with acute leukemia, of which over 12 000 are defined as myeloid, and 5000 more without specification on type of leukemia. More than 10 000 die from the disease,14 which constitutes approximately 2% of deaths because of cancer. Leukemia (all forms) is expected to strike 1% of females and 1.5% of males during their lifetime, and is the leading cause of cancer death in males younger than 40 years and in females younger than 20 years. In Sweden, approximately 0.2% of all hospitalizations in 2009 were because of acute leukemia, including allogeneic transplantation, with 0.6% of the costs for overall in-patient care according to diagnosis-related group15 estimates.16
Acute leukemia consists of a large number of distinct and somewhat less-defined entities,17-19 most of them with male predominance.20 Early registry studies, as well as clinical studies, suffer from pooling all or many types of leukemia into one bag and separate analyses of the distinct entities are often crucial.21
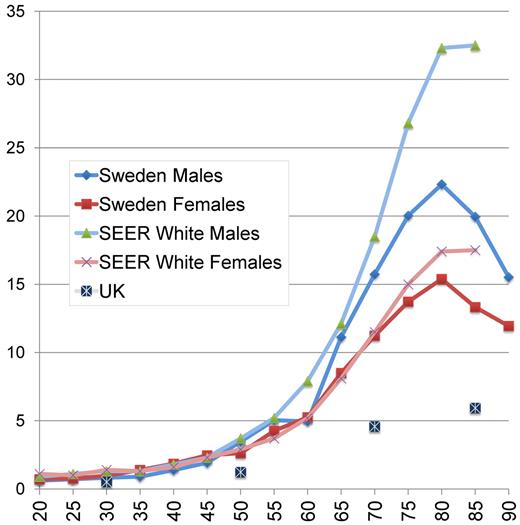
Acute lymphoblastic leukemia and acute promyelocytic leukemia (APL) are rare in adults, with an almost flat incidence by age.22,23 In contrast, AML is much more common in older people, with a continuous slow rise in young adulthood turning into a rapidly increasing incidence by age from approximately 50 years. The peak incidence occurs at approximately 80 years of age. According to the Surveillance, Epidemiology, and End Results (SEER) registry, the incidence of AML among males in the United States is higher than in Sweden for all age groups and markedly higher in men older than 50 years and women older than 75 years24 (Figure 1), whereas the United Kingdom incidence is reported to be lower25 ; the reason for this is unknown but could be of interest to study.
Yearly incidence of AML per 100 000 inhabitants according to age and sex in Sweden 1997 to 2006, in the SEER registry (whites, 2004-2008),24 and in the United Kingdom.25 United Kingdom data were given for 20-year age intervals (20-39, 40-59, 60-79, and 80+ years).
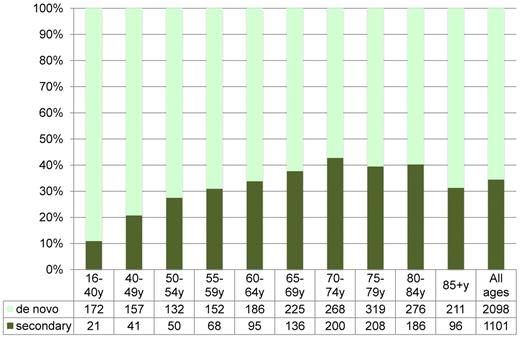
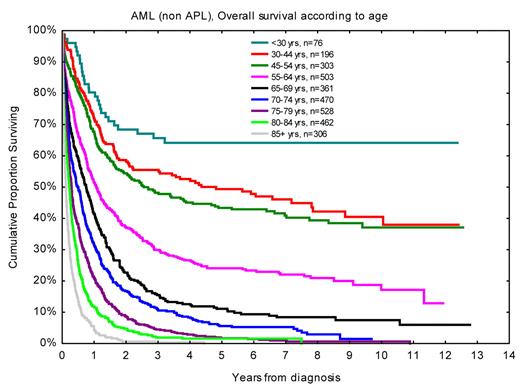
The age profile of AML, as in many other cancer entities, could indicate multiple pathogenetic events during the life span. As a consequence, secondary myelodysplasia and AML are increasing by age (Figure 2). However, the age distribution could also be explained by single-hit mutations,26-28 and the proportion of AML arising in patients with prior myelodysplasia or myeloproliferative neoplasia is not as different by age as the overall survival (OS; Figure 3). Therapy-related AML constitutes only approximately 5% of AML, with a female predominance because of chemotherapy for female cancers. The flat incidence rate by age in adult ALL and APL may support the concept of fewer genetic events in the development of these leukemia subtypes.29
Proportion of secondary AML (non-APL, secondary to previous hematologic disease and/or cytotoxic therapy) according to age in the Swedish Registry (1997-2006). Total number of patients is given below graph.
Proportion of secondary AML (non-APL, secondary to previous hematologic disease and/or cytotoxic therapy) according to age in the Swedish Registry (1997-2006). Total number of patients is given below graph.
OS according to age for AML (non-APL) patients diagnosed in 1997 to 2006, with follow-up in December 2008.31,41 Nine patients were younger than 20 years.
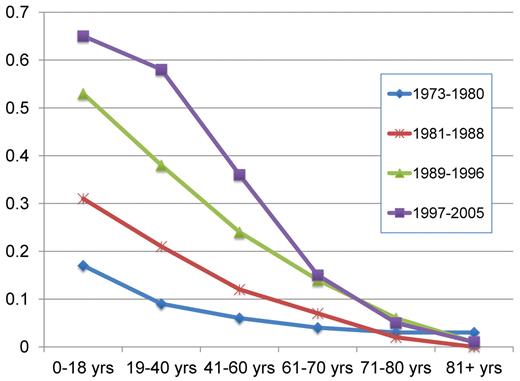
According to the SEER registry, the 5-year relative survival rates have improved from 6.2% during the period 1975 to 1977 to the estimated 23.6% in 2001 to 2007.24 Similar data from the Swedish Cancer Registry show improvements in all ages up to 80 years,30 although most prominent in younger people3 (Figure 4).
Projected relative 5-year survival in AML according to age and time period, with follow-up on December 31, 2006. Point estimates are from Derolf et al.3
Projected relative 5-year survival in AML according to age and time period, with follow-up on December 31, 2006. Point estimates are from Derolf et al.3
Patient age is the major risk determinant in acute leukemia31 (Figure 3), also when stratified according to established risk factors, and is therefore always important to consider when evaluating data in clinical studies. However, organ function measures could substitute for age.32 Differences in age distribution in studies might also give clues to the inclusion rates in the studied population, in addition to true differences between time periods and geographic regions as well as random variation.
Registries and data quality
SEER
The SEER registry is a National Cancer Institute program that collects data from United States hospitals since 1973, with patient demographics from 17 United States tumor registries covering a population of approximately 80 million people from 9 states and 5 metropolitan areas (ie, ∼ 25% of the United States population), with some predominance of ethnic minorities. Primary tumor site, morphologic class, and stage are registered.24 Data are linked with the National Longitudinal Mortality Study database since 1979, and with Medicare claims and Medicaid since 1991. Activities to ensure data quality are presented on the SEER Web site.24
The SEER-Medicare hospitals should be representative for the United States. However, this was questioned in a recent study of lung cancer treatment where major geographic differences were found and where the SEER areas were not representative.33 A 1989 study showed that smaller hospitals had a higher rate of missing cases,34,35 which is a concern because most patients in SEER are reported from community hospitals. Lack of complete reports on treatments and recurrences in ovarian cancer36 and of radiotherapy in breast cancer37 were among other limitations reported to reduce the possibility to draw conclusions. For AML, a major drawback of the SEER registry is that patients with AML secondary to myelodysplasia and myeloproliferative neoplasias have not been reported until 2010. Furthermore, underreporting of myeloid leukemias38 is suggested. Follow-up of vital status in AML is said to be more than or equal to 97% rather than complete.21
Swedish Cancer Registry
Sweden has a long history of legislated population registries, starting in 1686 for taxation and military purposes, with vital status included from 1746. Most importantly, the Swedish Cancer Registry has been running since 1958,30 and all pathology specimens indicating malignant disease must by law be reported by the pathologist to the Regional Tumor Registry. Once a year, all regional data are pooled into the National Cancer Registry. In addition, a clinical cancer report from the clinical department is required. If the clinical report is missing, there is an active request from the tumor registry; thus, every patient has 2 reports for every cancer. However, still a small proportion of patients may be missed in the registration, as identified in studies comparing the Swedish Cancer registry with other general registries, such as those of hospitalizations and death certificates.39,40
Importantly, since 1947, all Swedish citizens have a unique personal identification code, the same for all registrations, including, for instance, taxation, level of education, and medical purposes including causes of death; thus, all Swedish patients and their medical history are possible to track even after migration within the country or after return from stay abroad. Follow-up of vital status is therefore complete with a minimum of loss, and it is possible to perform socioeconomic grouping based on national registries.
Swedish Adult Acute Leukemia Registry
The Swedish Acute Leukemia Registry contains data on all adult patients (16 years or older and not treated at pediatric departments; these are instead reported to the Nordic Society for Pediatric Hematology and Oncology), with acute leukemia diagnosed from 1997. The registry was founded by the Swedish Society of Hematology (www.sfhem.se) and is supported by the Swedish Board for Health and Welfare (Socialstyrelsen) and SKL. The dataset includes baseline features at the diagnosis of acute leukemia, history of hematologic disease, PS, intention of primary therapy, treatment outcome, recurrences, transplantation, and survival. Reporting was previously made on paper forms, with regular updated information, and missing information was actively requested from the tumor registry. Overall coverage in relation to the Cancer Registry was 98%,41 and missing patients seemed to be random. In Sweden, 56% of the patients with acute leukemia are reported from the university hospitals, 35% from large county hospitals, and only 8% of preferably older patients from small hospitals. Some validation projects have been carried out (eg, reports from patients younger than 30 years), or with APL, or with stem cell transplantation (SCT) have been rechecked for specific purposes. The cohort diagnosed in 1997 to 2006 contains 3318 patients with AML, including 113 with APL, with a median age of 71 years, 472 with ALL (median age, 54 years), and 109 with undifferentiated or unclassified acute leukemia. The median survival follow-up is 6.2 years for survivors.
From 2007, the reporting is Web-based and significantly expanded, with more data on findings at diagnosis, including genetics, comorbidity, details on treatment, and resource requirements. The Web-based design permits logical controls and checks for missing data and gives support on compulsory parameters in the specific situation. The new registry will therefore provide better quality data with less need for queries and now includes 997 AML patients diagnosed in 2007 to 2009, with a median follow-up of 3.1 years.
A remaining problem is that few clinical departments have defined staffing and office hours for the workload required for reporting. This has to be resolved to ensure continuing high-quality data reporting but would be benefitted from improved on-line connection between clinical medical records and quality registries.
Survival end points
In acute leukemia, the most important end point is survival. However, survival can be measured in different ways.42 Cause-specific survival requires careful consideration on the cause of death, where death certificates not necessarily differentiate adequately between complications from leukemia, its treatment, fatal comorbidities, and unrelated causes. A lack of definition on treatment-related mortality was recently addressed.43 To avoid the need of detailed information and interpretation of data, some studies report relative survival (ie, observed survival in relation to the expected survival of a comparable general population); this captures both direct and indirect mortality.3,24 This is important when survival of patients with the specific disease is close to that of the general population, such as with indolent lymphoproliferative disorders in older people. However, we have used OS in patient cohorts stratified for age because also among older people the patients with acute leukemia do so much worse: at age 70 years, patients with AML have a median survival of less than one year, whereas the expected residual survival of the general Swedish population of that age is 14.2 years for males and 16.8 years for females.
Some population-based studies extrapolate survival trends from incomplete data, with the assumption that the hazard risk pattern by time from diagnosis is stable over time. However, this might not be true. In AML, for instance, allogeneic SCT (allo-SCT) and the change from traditional myeloablative conditioning toward reduced intensity conditioning impose significant changes in the shape of the survival curves. The improved availability for unrelated donors has greatly increased the use of allo-SCT, especially in the large patient group of ages 40 to 65 years. Instead, early and continuous survival follow-up through available national data systems should provide accurate real-time data as basis for better analysis and decision than projected estimates.
Impact of selection on outcome
Clinical studies have criteria for inclusion and exclusion, which impose selection. In addition, various logistic reasons lead to a low proportion of inclusion among eligible patients. Thus, in the large group of AML patients older than 60 years, clinical studies usually recruit only a few patients per institution and year. Those included are typically younger, more fit, with better PS and less comorbidity, and have more often de novo AML than most patients in the clinic.41 We calculated the consequences of the common selection criteria on the whole Swedish AML population diagnosed in 1997 to 2006 (Table 1). This has less implication in younger patients because most of them receive intensive treatment, fewer have secondary AML, and few have severely impaired PS.31 However, in ages 55 years and older, less than half of the AML patients have de novo disease with PS 0-II and are judged to be fit for intensive treatment, and these selected patients have more than a 50% better survival than the total AML population of the same age.
OS with AML, non-APL, 1997 to 2006 (n = 2511)
| Age, y . | AML (non-APL), unselected, % . | AML (non-APL), selected de novo, intensive treatment, PS 0-II, % . | Ratio of selected/unselected . | |||||||||
|---|---|---|---|---|---|---|---|---|---|---|---|---|
| n . | 2-year . | 5-year . | Median days . | n . | 2-year . | 5-year . | Median days . | n . | 2-year . | 5-year . | Median . | |
| < 30 | 65 | 65 | 60 | > 4000 | 44 | 72 | 63 | > 4000 | 0.68 | 1.11 | 1.05 | — |
| 30-44 | 171 | 57 | 49 | 1747 | 120 | 72 | 60 | > 4000 | 0.70 | 1.26 | 1.22 | — |
| 45-54 | 266 | 54 | 43 | 934 | 170 | 70 | 59 | > 4000 | 0.64 | 1.30 | 1.37 | — |
| 55-64 | 423 | 36 | 23 | 396 | 208 | 58 | 36 | 1022 | 0.49 | 1.61 | 1.57 | 2.58 |
| 65-69 | 308 | 22 | 12 | 263 | 132 | 43 | 26 | 655 | 0.43 | 1.95 | 2.17 | 2.49 |
| 70-74 | 419 | 16 | 5 | 174 | 134 | 34 | 13 | 447 | 0.32 | 2.13 | 2.60 | 2.57 |
| 75-79 | 448 | 9 | 2 | 108 | 143 | 17 | 6 | 248 | 0.32 | 1.89 | — | 2.30 |
| 80-84 | 411 | 4 | 1 | 81 | 123 | 8 | 4 | 111 | 0.30 | — | — | 1.37 |
— indicates not applicable.
Geographic variation
Many clinically relevant questions cannot be posed in randomized studies, for various reasons. Far from all important parameters could be defined and controlled for in clinical studies.44 Population-based registries also provide a way to achieve new information through the study of geographic differences. Healthcare authorities are interested in geographic variation to ensure equal level of health care for the citizens and the general population to know where to go for the best of care.
Geographic differences in medical management are well recognized, as exemplified by a recent United States article showing variable responses between different states and regions to changes in the reimbursement for chemotherapy; however, this study did not provide new clinical knowledge because no outcome data were available.33
Further prerequisites for useful data from studies of geographic differences are, as in clinical studies, relevant hypotheses on why and which difference that might lead to a different outcome. Adequate data must be of high quality, and the studied populations should be similar in different areas but the management still different. Such studies must be scrutinized so that the studied parameters are likely to have influence on the outcome in contrast to just being surrogate markers with correlations.
In Sweden, there are 6 different healthcare regions, each covering 0.9 million to 1.9 million people with a similar health profile, and we analyzed OS according to observed regional differences in the management of AML patients (ie, the use of intensive therapy for older31,45 and allogeneic SCT for younger patients41 ).
Intensive or palliative treatment of older patients with AML
When to give intensive treatment to older patients with AML is an important question with strong clinical impact. It is often claimed that older patients do not tolerate intensive treatment because of the risk of early death. A single randomized study from the 1980s has been performed, including 60 patients older than 65 years with AML, showing a median survival of 21 weeks with intensive chemotherapy compared with 11 weeks with palliation only, and no difference in the number of days in hospital.46 In the large MRC AML14 study, a randomization between intensive and palliative therapy was aimed at in the target population where the best treatment strategy is unknown, but of 1400 registered patients only 8 got randomized.47 Kantarjian et al based their view that older patients do not benefit from intensive treatment on a study of 446 patients 70 years or older who were referred to their institution from 1990 to 2008 and treated with cytarabine-based intensive chemotherapy.48 In contrast, the Swedish AML registry 1997 to 2006 contain 998 unselected patients 70 to 79 years of age, including those who were judged to be unfit for treatment.
Two of the Swedish healthcare regions aimed at intensive treatment for 75% of the AML patients between 70 and 80 years compared with 58% and 41% for the other regions. In this age group, every hematologist would treat mainly those with the presumed best outcome and advice palliation preferably to those with the worst prospects. Thus, if more patients in a cohort were treated, this would also include those with poorer prognosis, whereas if only few were treated those would be the persons judged to have the best prognosis. One would therefore expect that the overall result of treatment would be worse if more patients were given intensive treatment. However, in the Swedish study, both the complete remission (CR) rates and the early death rates were similar in all regions.31 Because intensively treated patients always do better than those given palliation only49 (Figure 5), the regions where most of the older patients were treated had a better OS of the whole AML population of that age than the other regions.
OS in days from diagnosis for patients 70 to 79 years of age with AML (non-APL) diagnosed in 1997 to 2006 according to palliative versus intensive intention and WHO/ECOG PS. (A) PS 0-I. (B) PS II. (C) PS III-IV. Note the logarithmic scale on x-axis to emphasize early deaths. Survival < 1 day was set to 1.
OS in days from diagnosis for patients 70 to 79 years of age with AML (non-APL) diagnosed in 1997 to 2006 according to palliative versus intensive intention and WHO/ECOG PS. (A) PS 0-I. (B) PS II. (C) PS III-IV. Note the logarithmic scale on x-axis to emphasize early deaths. Survival < 1 day was set to 1.
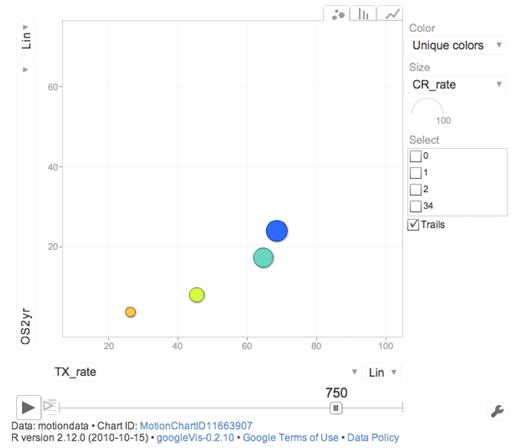
This tells us at least 2 things. We cannot properly select all the persons that benefit the most from active therapy, although baseline prognostic data, such as genetics, should improve the selection. We should also not restrict our analysis to those being treated but also include those not treated when drawing conclusions.50 In a Web-based dynamic moving graph (Figure 6), we show the complex interaction between age, PS, treatment intensity, allo-SCT rate, and outcome.
Screen shot from Web-based dynamic graph showing 2-year OS (OS2 years) and percentage intensive treatment (TX_rate) according to PS (blue represents PS 0; turquoise, PS I; yellow, PS II; and orange, PS III-IV) for AML non-APL patients 65 to 85 years of age. The full view requires Web connection http://www.ocsyd.se/SwedishAMLRegistry1997_2006/AML_who.html and shows overall 2-year and 3-year survival, early death rate by 8 weeks, proportion receiving intensive treatment, CR rate, and SCT rate by age and PS in patients from the Swedish national acute leukemia registry diagnosed in 1997 to 2006 (AML non-APL; supplemental data, available on the Blood Web site; see the Supplemental Materials link at the top of the online article).
Screen shot from Web-based dynamic graph showing 2-year OS (OS2 years) and percentage intensive treatment (TX_rate) according to PS (blue represents PS 0; turquoise, PS I; yellow, PS II; and orange, PS III-IV) for AML non-APL patients 65 to 85 years of age. The full view requires Web connection http://www.ocsyd.se/SwedishAMLRegistry1997_2006/AML_who.html and shows overall 2-year and 3-year survival, early death rate by 8 weeks, proportion receiving intensive treatment, CR rate, and SCT rate by age and PS in patients from the Swedish national acute leukemia registry diagnosed in 1997 to 2006 (AML non-APL; supplemental data, available on the Blood Web site; see the Supplemental Materials link at the top of the online article).
In practice, we recommend that most AML patients with PS 0-II up to 80 years of age should be considered for intensive treatment, but if secondary AML and/or PS II-IV, it would be justified to await cytogenetics and suggest palliation if high risk. The current Swedish AML Guidelines recommend cytarabine 1 g/m2 twice daily for 5 days, with daunorubicin 60 mg/m2 for 3 days, with dose reductions if urgently needed. We aim at full dose treatment because acute toxicity is a lesser problem than lack of response and prolonged cytopenia and more than 90% of patients younger than 70 years and 60% of those 70 to 79 years of age have actually received full dose in the real world setting. Older patients unresponsive to the first course of chemotherapy are withdrawn from further intensive treatment, whereas those with responsive disease receive adjusted consolidation.
In the most recent cohort diagnosed in 2007 to 2009, the geographic difference between the Swedish regions has evened out as a consequence of our National Guidelines and reporting of these data. Half of the older patients receiving intensive treatment achieve CR. The 2-year survival of all AML patients 70 to 79 years of age is now 18% compared with 13% in the previous time period.
Recently, Fehniger et al claimed that high-dose lenalidomide represents a novel therapeutic option for newly diagnosed older patients with AML because of a 30% CR/CR with incomplete recovery of blood counts (CRi) rate.51 Their uncontrolled study included 33 patients with a median age of 71 years, all but 4 with PS 0-I. However, the 1-month early death rate was 24%, the median survival 4 months, and the 1-year OS 30%, which corresponds very well with the one-third of the corresponding Swedish patients who did receive palliation only. The majority of our patients with similar characteristics had much better outcome after receiving intensive treatment (Table 2). The lack of relevant control in their study led to the interpretation that this treatment option was an improvement, which should be questioned.
| Patients . | N . | Median age, y . | Performance status 0/I/II, % . | De novo AML, % . | Death rate at 30 d, % . | Median OS, mo . | OS, 1 y, % . | OS, 3 y, % . |
|---|---|---|---|---|---|---|---|---|
| Sweden 60-84 y | ||||||||
| PS 0-II | 511 | 72 | 21/63/16 | 62 | 10 | 10 | 44 | 21 |
| PS 0 | 107 | 69 | 100/0/0 | 69 | 5 | 17 | 64 | 35 |
| PS I | 320 | 71 | 0/100/0 | 63 | 10 | 10 | 44 | 18 |
| PS II | 84 | 77 | 0/0/100 | 49 | 15 | 3 | 22 | 12 |
| PS 0-I | 427 | 71 | 25/75/0 | 64 | 8 | 12 | 49 | 22 |
| Intensive | 284 | 68 | 29/71/0 | 70 | 5 | 15 | 58 | 27 |
| Palliative | 129 | 77 | 16/84/0 | 50 | 16 | 5 | 30 | 12 |
| Lenalidomide study | 33 | 71 | 49/39/12 | 70 | 24 | 4 | 30 | 0 |
It is not a difficult task to identify risk factors for worse outcome in older patients, such as higher age, poor PS, high-risk genetics, and previous hematologic disease. However, the question for the individual patient is not mainly whether constitutive risk factors provide an increased risk, but instead which are the risks and chances with the different treatment options available to me.49,50 In all subsets of older AML patients, the early death rate was found to be lower with intensive treatment than with palliation with or without low-dose chemotherapy (Figure 5).49
Transplantation
Allo-SCT has been established as a routine treatment for AML for 30 years, at least for AML with high-risk genetics and HLA-matched sibling donors, but no randomized trial has been performed until recently (#NCT00766779). Most studies include only patients having received a transplant. Although the outcome of patients with different features and transplant procedures is of interest, an important question is whether to transplant or not. Given the specific features of the patient in front of you, the clinical consequences of transplant and nontransplant management must be defined. The surrogate of randomized studies has been the analysis of outcome for patients with or without stem cell donors, which however has drawbacks. Typically, one-fourth of those who have a donor in these studies do not get a transplant,52 and this analysis is further inadequate with the increased use of unrelated donors, where the donor availability is in scales of gray rather that black-and-white, and highly time dependent. Thus, the decision to perform an allogeneic transplant or not should be based on continuous evaluations of patient-, leukemia-, and donor-related risk factors with estimates on transplantation-related risk factors, and predictions on outcome with alternate treatment. Thus, early donor search is mandatory, to allow for transplantation at the optimal time point, which also is dependent on the logistics at the transplant center. It has been suggested that one allo-transplant center per million inhabitants is optimal.53
We recently performed a population-based analysis on which proportion of adult patients with acute leukemia diagnosed in 1997 to 2006 received allogeneic transplant.41 We found that in ages up to 55 years, 35% of those with AML and 34% with ALL received allo-SCT in CR1 (first CR), at a median of 153 days from diagnosis. Half of the donors for transplantation in CR1 were unrelated, whereas in later disease stages unrelated donors were more frequently used. With increasing patient age, the transplant frequency dropped rapidly. In a population-based United Kingdom study on bone marrow transplantation for AML, possibly including transplants also in later stages than CR1, 12% of the patients up to 50 years of age received bone marrow transplantation in 1998 to 2007.54 In the MRC AML12 study from 1994 to 2002, 10% received allogeneic SCT in CR1, partly because of protocol issues.10 In several other United States and European studies on AML patients up to 60 years, the reported transplant rates in CR1 ranged from 5% to 15%.41
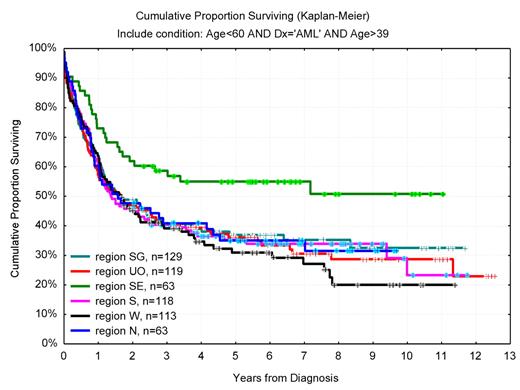
In one of the Swedish healthcare regions, as much as 46% of the 40- to 59-year-old AML patients received allo-SCT in CR1 compared with 22% in other parts of Sweden. In this region, with a higher proportion of allo-SCT in AML, the whole AML population of this age had a 55% 6-year OS compared with 34% in the rest of Sweden (Figure 7), despite similar age distribution, PS, and proportion secondary AML. Interestingly, the OS for young (< 60 years) adult Swedish AML patients was superior to that of patients in recent international clinical studies, including those given high-dose daunorubicin,55 despite that the unselected Swedish AML population had higher median age, more secondary disease, and worse initial PS.41
OS in years from diagnosis for AML (non-APL) patients 40 to 59 years of age according to geographic region (Southeast vs others, P = .005). In Southeast region, 46% received allogeneic transplantation compared with 22% (range, 20%-29%) in other regions (P < .01).
OS in years from diagnosis for AML (non-APL) patients 40 to 59 years of age according to geographic region (Southeast vs others, P = .005). In Southeast region, 46% received allogeneic transplantation compared with 22% (range, 20%-29%) in other regions (P < .01).
Thus, these studies show a positive correlation between the proportion of allo-SCTs performed in AML and the overall outcome. Although a direct causative relationship between a high transplant rate and long-term survival is not proven, our data support the use of allo-SCT also in intermediate-risk disease. It is also of interest that there was no such correlation between transplant rate and survival in ALL.41
APL and early death rates
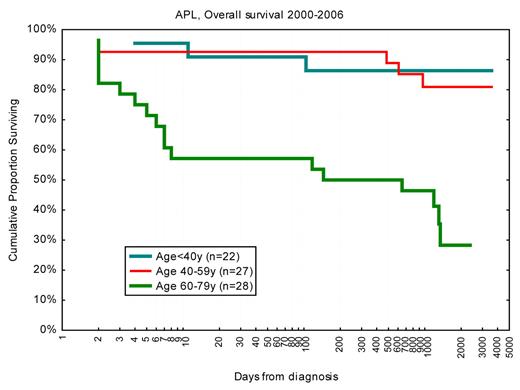
Inclusion of all-trans-retinoic acid and arsenic in the treatment of APL has led to major improvement in long-term outcome, with reported CR rates more than 90% and 3- to 6-year survival of 80%.56 Typically, the median age in these studies was 40 years compared with 54 years in Sweden. Importantly, the Swedish Acute Leukemia Registry reported in 2002 a 42% 1-month death rate in APL patients diagnosed in the late 1990s.57 In APL patients younger than 60 years, the 1-month death rate was then 25%, which however has dropped to 10% since the year 2001 (Figure 8). Our updated findings were reported at the 5th International APL Symposium in Rome 2009,58 and we then decided to identify and review the medical records of all Swedish APL cases to define causes of death and risk factors. Not only the early death rate but also the causes of death were clearly age-related: in younger patients, early death was almost entirely the result of cerebral bleeding, whereas in older patients the causes of death were more variable.23 Subsequently, our findings on the early death rates have been confirmed in the large but less-detailed SEER registry,21,59 and from a single institution study.60 Obviously, the older patients and those with severe initial symptoms and high risk of early death did not enter the clinical studies and were not identified in the large multicenter trials. Our findings from the Swedish registry emphasize that the most important area for improved management in APL is now early detection and intensified supportive care, especially in the significant fraction of patients older than 60 years, rather than changes in consolidation treatment and maintenance.
OS in days from diagnosis for patients with APL diagnosed 2000 to 2006 according to age. Note logarithmic scale on x-axis to emphasize early deaths. Survival < 1 day was set to 1.
OS in days from diagnosis for patients with APL diagnosed 2000 to 2006 according to age. Note logarithmic scale on x-axis to emphasize early deaths. Survival < 1 day was set to 1.
Conclusions
Randomized clinical trials remain the best way to evaluate specific interventions in acute leukemia. However, many clinical questions cannot be addressed in such studies because of limited patient numbers, problems with randomization or other logistics, or resource availability. Therefore, other types of controlled clinical studies must be developed further. In all studies, great care must be taken to minimize the consequences of patient selection. Interpretation of data with extrapolation to nonaddressed patient groups is delicate, where conflicts of interest because of industry sponsorship also must be considered. In clinical studies, patient selection is always at hand. Population-based studies may overcome selection and substitute for randomization in some situations. Data quality and relevance of the registered data for the clinical question are as important as for randomized trials. To avoid withdrawals and loss to follow-up and to monitor data reports properly are important and manageable in clinical trials. It is more cumbersome to ensure full coverage of target patients and to maximize data validity in population-based registries. Automatic transfer of crucial patient data from medical records to quality registries would improve data quality and accessibility. Authorities and healthcare providers should demand more data on outcome rather than on resource utilization for reimbursement, according to the expectations of Codman. If so, the development of high-quality registration of clinical data would be facilitated, and more importantly the quality of care would improve. Better registration would eventually provide an ample source of clinical data for scientific evaluation, addressing more of the many unknowns we struggle with in our daily clinical practice.
The online version of this article contains a data supplement.
Acknowledgments
The authors thank all Swedish hematologists and tumor registries that have contributed to data reporting and management.
This work was supported by SKL, Skåne University Hospital, Lund University, and Cancerfonden.
The Swedish Acute Leukemia Registry is a collaboration between the Swedish Society of Hematology and the Regional Tumor Registries of all Swedish Health Care Regions.
Authorship
Contribution: A.-S.H. and O.H. provided advice on analyses and data presentation and constructed the dynamic graph; G.J. wrote the paper; G.J., V.L., and M.H. are active members of the Swedish AML and AML registry working group; and all authors approved the manuscript.
Conflict-of-interest disclosure: The authors declare no competing financial interests.
Correspondence: Gunnar Juliusson, Stem Cell Center, BMC B10, Lund University, SE-221 85 Lund, Sweden; e-mail: gunnar.juliusson@med.lu.se.

