Abstract
Macrothrombocytopenia in MYH9-related disease (MYH9-RD) results from defects in nonmuscular myosin-IIA function. Thrombopoietin receptor agonists (eltrombopag; romiplostim) seem to improve hemostasis, but little is known about their biologic effects in MYH9-RD. We administered romiplostim to Myh9−/− mice (100 μg/kg, every 3 days, during 1 month). MKs increased to similar numbers in Myh9−/− and wild-type (WT) mice (with an increase in immature MKs), but Myh9−/− platelet count response was much less (2.5-fold vs 8-fold increase). A strong increase in MK nuclei emboli in the lung, in WT and Myh9−/− mice, indicates increased transmigration of MKs from the BM. Prolonged (but not acute) treatment with romiplostim decreased expression of GPIb-IX-V complex and GPVI, but not of GPIIbIIIa, and bleeding time increased in WT mice. Microcirculation was not altered by the increased number of large platelets in any of the assessed organs, but in Myh9−/− mice a much stronger increase in BM reticulin fibers was present after 4 weeks of romiplostim treatment vs WT mice. These data further encourage short-term use of thrombopoietic agents in patients with MYH9-RDs; however, myelofibrosis has to be considered as a potential severe adverse effect during longer treatment. Reduction of GPIbIX/GPVI expression by romiplostim requires further studies.
Introduction
MYH9-related disorders (MYH9-RDs) are a group of rare diseases characterized by congenital macrothrombocytopenia that results from mutations in the MYH9 gene encoding the nonmuscle myosin IIA, the only isoform of myosin present in platelets.1 Thrombocytopenia ranges from mild to severe and remains relatively stable in a person throughout life. Patients may experience easy bruising, epistaxis, and menorrhagia, in some rare occasions requiring blood transfusion. Other manifestations may occur later in life such as cataract, hearing loss, and nephropathy; the mechanism leading to these additional symptoms is presently unknown.2,3 In these patients, thrombocytopenia results from defective platelet production, probably resulting from impairment in marrow MK maturation because of decreased or abnormal myosin IIA, leading to a strong decrease in their capacity to extend proplatelets.4,5
Second-generation thrombopoietic agents, which stimulate megakaryocytopoiesis by binding to the thrombopoietin (TPO) receptor,6 may be an option for increasing the platelet count in MYH9-RDs. Two of these TPO receptor agonists have completed phase 3 trials in primary immune thrombocytopenia (eltrombopag, a nonpeptide TPO receptor agonist, and romiplostim, a peptide TPO receptor agonist7,8 ) and have been recently approved in several countries for treatment of certain patients with immune thrombocytopenia.
Eltrombopag administration has recently been tested in patients with MYH9-RDs in a phase 2, multicenter trial, showing moderate increase in platelet counts and reduction in bleeding tendency,9 suggesting that these new thrombopoietic agents could also represent an interesting therapeutic option for patients with MYH9-RDs. However, platelets in MYH9-RDs differ from platelets in idiopathic thrombocytopenic purpura, and it is unknown whether stimulation of megakaryocytopoiesis by TPO receptor agonists may cause additional changes in these MYH9-RD platelets. Furthermore, many of the giant platelets are larger than the diameter of capillaries, and little is known about their rheology. Increasing the number of circulating giant platelets may increase the risk for microthrombotic events. This is especially relevant in MYH9-RDs, because these patients are also at risk of developing renal insufficiency. Clustering of giant platelets in the capillaries of the glomerula might increase the risk of damage of the renal tissue, potentially aggravating the risk of renal failure.
To evaluate the possibility that an increase in giant platelets alters the microcirculation, we took advantage of a mouse model of MYH9-related macrothrombocytopenia.10 Romiplostim was injected into Myh9−/− mice during a 1-month period, and the consequences in terms of platelet production and microcirculation were evaluated. We found a much less pronounced response of platelet count increase and increased myelofibrosis compared with wild-type (WT) mice, but no evidence of impairment of the microcirculation induced by the increased number of large platelets was observed. Interestingly, romiplostim induced a decrease in platelet GPIbIX and GPVI expression in both WT and Myh9−/− mice.
Methods
Animals
Myh9−/− mice have already been described10 and are on a C57BL/6 background (back-crossed for 11 generations). C57BL/6 mice were used as control. All animal studies were performed according to the regulations of the Université de Strasbourg.
Protocol design
Ten-week-old WT and Myh9−/− mice (5 males and 5 females in each group) received subcutaneous injections of either vehicle (saline) or romiplostim (100 μg/kg of body weight; Amgen) every 3 days, during 1 month. Doses and administration schedules were selected according to previous studies in mice.11 Blood samples were analyzed for platelet count and platelet volume before the onset of the experiment and at days 8, 18, and 29. At day 33, mice were killed. Blood was drawn from the abdominal aorta for platelet isolation and electron microscopy observations. Organs (brain, lungs, pancreas, kidneys, psoas muscles, gut, and BM) were removed and immersed into 4% paraformaldehyde for histologic analysis.
Bleeding time
Bleeding time was performed on other groups of mice treated for 1 month, 10 days, or 6 hours, by sectioning 3 mm of the tail tip and immersing the tail in saline at 37°C, as previously described.10
Platelet count, volume determination, P-selectin, glycoprotein level, annexin V, and mitochondrial potential measurement
Blood was taken from the tail tip of isoflurane-anesthetized mice and anticoagulated with EDTA (6mM). Platelet count was determined with an automated platelet counter (Scil Vet ABC, Scil Animal Care Company), and platelet volume modifications were evaluated by flow cytometry (Gallios; Beckman Coulter France) after GPIbβ (RAM1 Ab10 ) labeling. Platelet P-selectin exposure, GPIIbIIIa activation, and glycoprotein levels were evaluated by flow cytometry in whole blood by labeling with an anti–P-selectin Ab (Becton Dickinson) or with Jon/A-PE Ab (Emfret) or with monoclonal Abs directed against GPIbα (RAM6), GPIbβ (RAM1), GPV (Gonc2; Emfret), GPIIbIIIa (RAM2), or GPVI (JAQ1; Emfret) in blood samples taken after 28 days of romiplostim treatment. The data are presented as mean fluorescence intensity in arbitrary units. Exposition of negatively charged phospholipids was checked by flow cytometry with the use of FITC–annexin V labeling, and putative modifications of the mitochondrial potential were evaluated with the fluorescent probe TMRM followed by flow cytometric analysis.
Platelet isolation and electron microscopy
ACD anticoagulated whole blood was centrifuged, and platelet-rich plasma was washed in Tyrodes buffer as described.12 Platelets were fixed with 2.5% glutaraldehyde in 0.1M cacodylate buffer, pH 7.2, containing 2% sucrose, and processed as described previously.12 Ultrathin sections were examined under a Philips CM120 Biotwin electron microscope (FEI) at 120 kV. For ultrastructural observation of BM, femurs were flushed, fixed, and processed as described for platelets.
Western blot analysis
Platelet lysates were prepared by resuspending washed platelets (200 × 109/L) in SDS buffer (1% SDS final concentration). Proteins were separated by SDS-PAGE under reducing or nonreducing conditions, transferred to polyvinylidene difluoride membranes, and incubated with the primary Ab directed against GPIIIa (LucA5; Emfret), GPIbα (RAM6), GPIbβ (RAM1), GPVI (JAQ1; Emfret), or actin for normalization.
Histology
The mouse tissue samples were dehydrated and embedded in paraffin. Slides of 2- to 3-μm thickness were cut and stained by H&E and afterward digitized with the NanoZoomer 2.0 (Hamamatsu). The amount of MKs in the spleen was counted in an area of 2.62 mm2 with the use of ImageScope v11.0.2.716 software (http://www.aperio.com). For this purpose we counted every MK that showed a nucleus within the analyzed area.
To quantify the amount of MK emboli in the lung we used relative units to compare the surface of the lung with their varying ventilation.13 We quantified the surface area as described.14 In brief, 4 parallel lines with a distance of 7 cm were superimposed on the computer screen (789-fold magnification). First, we counted the intersections of the alveolar walls with the lines; thereafter, we separately counted the MK emboli within this section. Finally, we calculated the ratio of MK emboli per 500 intersections of alveolar walls with the lines.
Myelofibrosis was detected on BM paraffin sections with the use of the Gomori stain for reticular silver staining. Scores were attributed according to the absence or moderate or abundant presence of fibers. The observations were made on 4-5 mice per experiment.
Statistics
Statistical analyses were performed with 1-way ANOVA and Bonferroni posttest (*P < .05, **P < .01, and ***P < .0001).
Results
Romiplostim increases the platelet count in Myh9−/− mice less than in WT mice
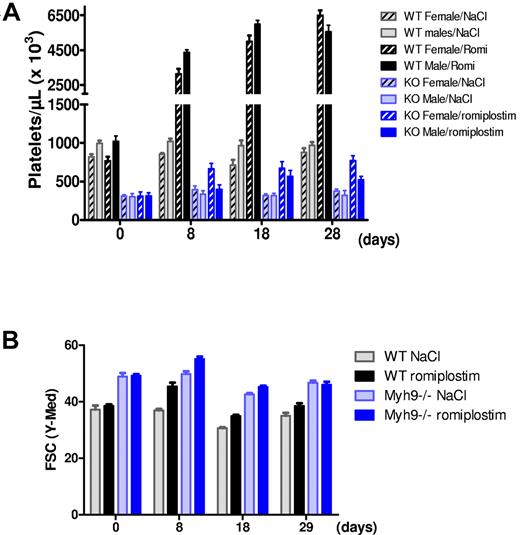
Romiplostim (100 μg/kg) injection to WT mice every 3 days led to a 4-fold increase in platelet count 8 days after the beginning of the protocol for both males and females (Figure 1A). Platelet count further increased after 1 month of treatment, reaching an 8-fold increase for females and 6-fold increase for males (Figure 1A). Romiplostim also increased platelet counts in Myh9−/− mice, although to a lesser extent, with a 2.5-fold increase for females and 1.7-fold increase for males (Figure 1A). As expected platelet volume was higher for Myh9−/− mice at baseline, and a transient increase in the mean platelet volume was observed in both genotypes after the start of romiplostim treatment (Figure 1B).
Romiplostim-induced increase in platelet number and size. (A) Platelet counts of WT and Myh9−/− mice before (day 0) and after 8, 18, and 28 days of romiplostim administration. Each bar represents the mean ± SEM of 5 animals. (B) Relative platelet size variation during romiplostim treatment as visualized by flow cytometry (forward scatter parameter) in the GPIbβ-positive population. Mean ± SEM of 10 animals. Of note, the platelet size increase after start of romiplostim was transient in the Myh9−/− mice, indicating that it is not only the effect of TPO receptor stimulation.
Romiplostim-induced increase in platelet number and size. (A) Platelet counts of WT and Myh9−/− mice before (day 0) and after 8, 18, and 28 days of romiplostim administration. Each bar represents the mean ± SEM of 5 animals. (B) Relative platelet size variation during romiplostim treatment as visualized by flow cytometry (forward scatter parameter) in the GPIbβ-positive population. Mean ± SEM of 10 animals. Of note, the platelet size increase after start of romiplostim was transient in the Myh9−/− mice, indicating that it is not only the effect of TPO receptor stimulation.
Effect of romiplostim on platelet structure
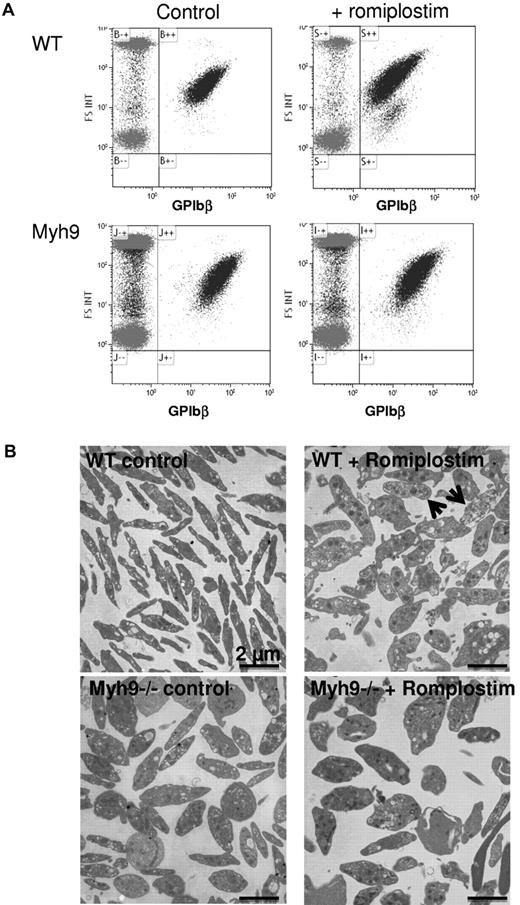
Romiplostim treatment led to the formation of circulating platelet debris as observed by flow cytometry (Figure 2A). These debris were more numerous in WT-treated mice, probably reflecting the stronger increase in platelet count. By electron microscopy after 1 month of treatment, the increased platelet size was still evident in romiplostin-treated WT mice (Figure 2B). In addition, platelet fragments were present, together with poorly contrasted platelets (Figure 2B arrows). Myh9−/− platelet structure was altered as previously shown, with larger and ovoid platelets, presenting heterogeneity in organelle content and distribution. Romiplostim treatment did not improve or modify their structure, but the presence of debris was less evident compared with WT mice.
Romiplostim-induced increase in circulating platelet debris. (A) Presence of GPIbβ-positive debris as observed by flow cytometry in the romiplostim-treated WT mice. (B) Transmission electron microscopy shows platelet ultrastructure of romiplostim-treated animals compared with controls. Arrows show poorly contrasted platelets in the romiplostim-treated WT mice.
Romiplostim-induced increase in circulating platelet debris. (A) Presence of GPIbβ-positive debris as observed by flow cytometry in the romiplostim-treated WT mice. (B) Transmission electron microscopy shows platelet ultrastructure of romiplostim-treated animals compared with controls. Arrows show poorly contrasted platelets in the romiplostim-treated WT mice.
Romiplostim increases MK numbers in the spleen
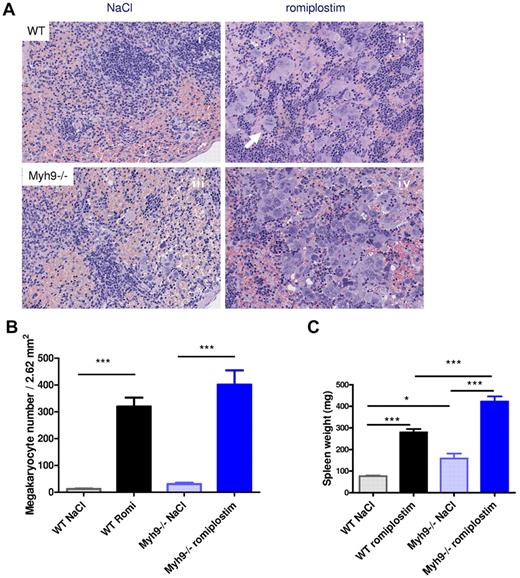
Quantification of MKs in the spleen with the use of histology sections (Figure 3A) indicates that, as previously reported for BM,15 the number of MKs was higher in control Myh9−/− mice compared with control WT mice (11.7 MKs/field vs. 30.2 MKs/field for control WT and Myh9−/− spleen, respectively; Figure 3Ai,ii,B).
Romiplostim-induced increase in splenic MKs. (A) H&E-stained paraffin sections of the spleen of romiplostim-treated and control mice. Animals treated with romiplostim (ii,iv) show a clearly visible increase of MKs in the spleen compared with the untreated animals (i,iii). Of note, the number of MKs was already slightly increased in Myh9−/− mice at baseline (iii). The arrow in panel ii shows a mitosis of a MK (original magnification, ×789). (B) Quantification of MK numbers in the spleen (mean ± SEM of 9-10 animals per column). (C) Spleen weight; mean ± SEM of 9-10 animals per column.
Romiplostim-induced increase in splenic MKs. (A) H&E-stained paraffin sections of the spleen of romiplostim-treated and control mice. Animals treated with romiplostim (ii,iv) show a clearly visible increase of MKs in the spleen compared with the untreated animals (i,iii). Of note, the number of MKs was already slightly increased in Myh9−/− mice at baseline (iii). The arrow in panel ii shows a mitosis of a MK (original magnification, ×789). (B) Quantification of MK numbers in the spleen (mean ± SEM of 9-10 animals per column). (C) Spleen weight; mean ± SEM of 9-10 animals per column.
Romiplostim treatment strongly increased the MK number in both WT and Myh9−/− mice compared with their respective controls. The absolute number of MKs was even higher in Myh9−/− mice compared with WT mice, with a mean value of 400 MKs/field for treated Myh9−/− mice and 319.3 MKs/field in the treated WT mice (Figure 3Aii,iv,B). However, the relative increase in megakarocyte numbers during administration of romiplostim was much lower in Myh9−/− mice (13-fold) than in WT mice (27-fold). This may explain in part the lower increase in Myh9−/− platelet count. As a probable consequence of increased extramedullary megakaryocytopoiesis, the spleen was enlarged after romiplostim injections in both Myh9−/− mice and WT mice (Figure 3C). Romiplostim-treated mice also showed an increased number of cluster-forming MKs in the spleen, with some MKs being in mitosis (Figure 3Aii).
Romiplostim increases the proportion of immature MKs
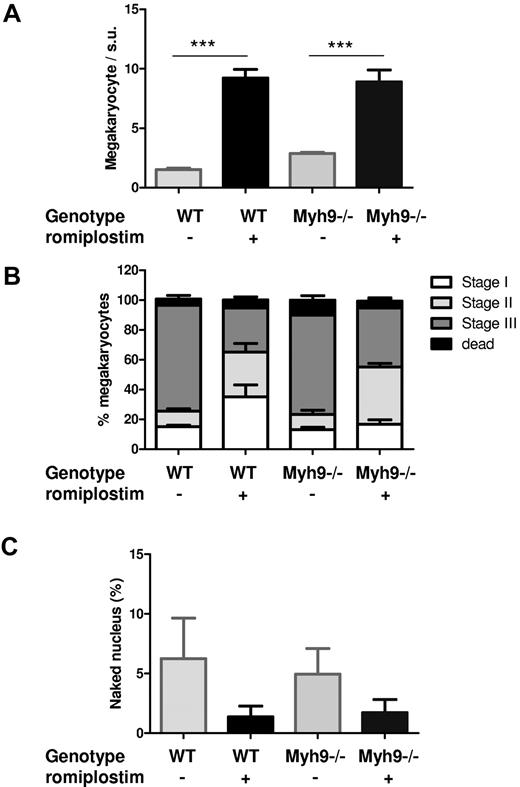
Romiplostim also increased total MK numbers of the BM to a similar level in WT and Myh9−/− mice (Figure 4A). Ultrastructural observations showed that the proportion of immature versus mature MKs was modified by the treatment, with a higher proportion of immature MKs (Figure 4B).
Romiplostim-induced an increase in immature MKs. (A) Quantification of BM MKs as observed by electron microscopy, per surface unit (s.u.; 12 945 μm2). Each bar represents the mean ± SEM of 3 BMs, for a total number of 99-205 counted MKs. (B) Classification of the MKs according to their maturation stages: stage I (presence of granules), stage II (developing DMS not yet organized), stage III (DMS organized in platelet territories). Data are represented as the percentage of total MKs. (C) Quantification of naked MK nuclei inside the BM. Each bar represents the percentage of naked nuclei relative to the total number of MKs counted.
Romiplostim-induced an increase in immature MKs. (A) Quantification of BM MKs as observed by electron microscopy, per surface unit (s.u.; 12 945 μm2). Each bar represents the mean ± SEM of 3 BMs, for a total number of 99-205 counted MKs. (B) Classification of the MKs according to their maturation stages: stage I (presence of granules), stage II (developing DMS not yet organized), stage III (DMS organized in platelet territories). Data are represented as the percentage of total MKs. (C) Quantification of naked MK nuclei inside the BM. Each bar represents the percentage of naked nuclei relative to the total number of MKs counted.
However, the number of visible naked nuclei remained very low and did not increase in the romiplostim-treated marrow. Thus, when calculating their percentage in the BM, it was decreased in romiplostim-treated marrow because the number of MKs increased (Figure 4C). This observation was surprising in the view of the large increase in MK numbers and the 8-fold increase in platelet count in WT mice treated with romiplostim and suggests that MK nuclei elimination is either increased to maintain a low level of naked nuclei by some regulation or that an increased number of intact MKs transmigrate into the sinusoid circulation.
Romiplostim-induced MK nuclei emboli in the pulmonary microvasculature
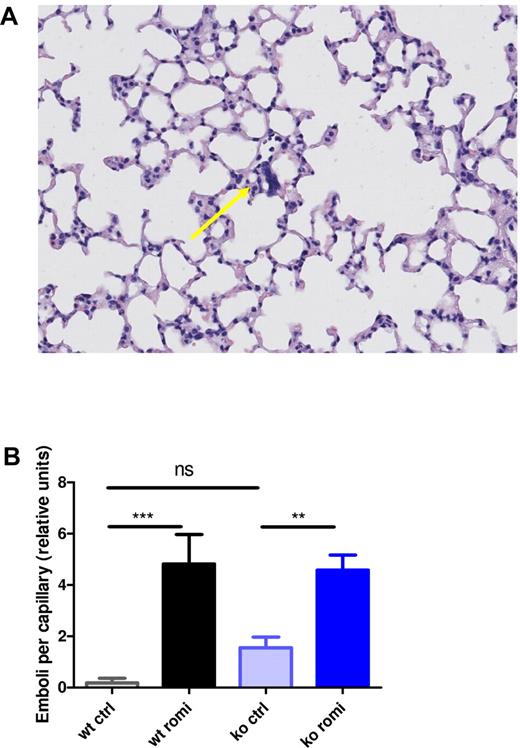
Because the presence of MKs in lung capillaries from TPO-treated mice was previously observed,16 we investigated whether MKs were also present in the lungs from romiplostim-treated mice. Histologic lung sections showed a large amount of emboli composed mostly of MK nuclei present in the capillaries of both WT and Myh9−/− mice treated with romiplostim (Figure 5A-B). This observation favors an increased transmigration of intact MKs to the sinusoid circulation in romiplostim-treated mice and explains the finding of a low number of naked MK nuclei despite a big increase in total MK numbers. Of note, nontreated control Myh9−/− mice had slightly more emboli than nontreated WT control mice, although the difference was not significant (Figure 5B), probably resulting from the increased baseline levels of MKs in Myh9−/− mice.
Romiplostim-induced increase in MK nuclei lung emboli. (A) H&E-stained lung tissue of a WT animal treated with romiplostim showing a representative lung embolus (arrow). (B) Quantification of the emboli per capillary in lung tissue. Each bar represents the mean ± SEM of 10 animals.
Romiplostim-induced increase in MK nuclei lung emboli. (A) H&E-stained lung tissue of a WT animal treated with romiplostim showing a representative lung embolus (arrow). (B) Quantification of the emboli per capillary in lung tissue. Each bar represents the mean ± SEM of 10 animals.
Romiplostim treatment did not lead to obstruction of the microvasculature in other organs
To investigate whether an increase in the number of circulating large platelets could lead to obstruction of the microcirculation, the organs, in particular brain, gut, pancreas, lungs, spleen, kidney, and psoas muscle, were removed for histologic analyses. No occlusions were observed in all examined tissues either from WT mice or from Myh9−/− mice after 1 month of romiplostim treatment.
Romiplostim induces a relative deficiency of the GPIb-IX-V complex and of GPVI but no increase in P-selectin exposure or GPIIbIIIa activation
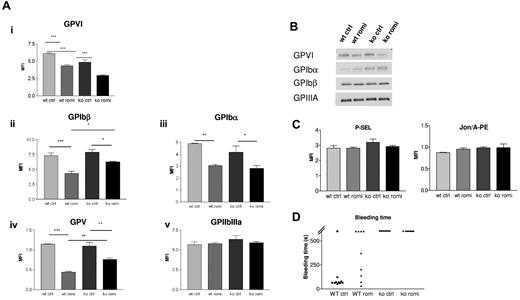
Expression of GPIb-IX-V complex and GPVI decreased during treatment with romiplostim for 28 days, as assessed by flow cytometry. In contrast, expression of GPIIbIIIa did not change significantly (Figure 6Ai-iv). No difference of GPIb complex or GPVI surface expression was observed after 6 hours of romiplostim treatment (not shown). This indicates that reduction of GPIbα and GPVI expression is not caused by direct platelet activation by romiplostim but by a more complex mechanism. Western blot experiments to visualize total platelet GPIbα, GPIbβ, GPIIIa, and GPVI protein also showed a slight decrease of GPVI after romiplostim treatment but no significant decrease in GPIbα or GPIbβ, suggesting that the decrease in surface expression of the GP is more likely caused by cleavage or internalization rather than by romiplostim-induced decrease of protein synthesis (Figure 6B). However, no increase in P-selectin exposure could be detected after romiplostim treatment or no signs of GPIIbIIIa activation as measured by Jon/A-PE labeling, indicating no major platelet activation (Figure 6C).
Romiplostim induces a reduction of GPVI and GPIb-IX-V complex expression. (A) Flow cytometric experiment showing in both WT mice and Myh9−/− mice a reduced surface expression of GPVI and GPIb-IX-V complex during romiplostim treatment (i-iv), whereas expression of GPIIbIIIa (v) remained normal. Blood samples were taken after 28 days of romiplostim treatment. Results are expressed as the mean fluorescent intensity ± SEM (n = 8 for GPVI and n = 4 for other proteins). (B) Western blot analysis showing total GPVI, GPIbβ, and GPIIIa expression (lysate from a pool of 8-10 mice, after 1 month of treatment, representative of 2 separate experiments). (C) Flow cytometric experiment showing absence of P-selectin exposure or Jon/A-PE labeling after romiplostim treatment (n = 4-5). (D) Bleeding time, measured by the tail tip sectioning, was not reduced in Myh9−/− mice treated with romiplostim for 1 month, whereas it was increased in treated WT mice.
Romiplostim induces a reduction of GPVI and GPIb-IX-V complex expression. (A) Flow cytometric experiment showing in both WT mice and Myh9−/− mice a reduced surface expression of GPVI and GPIb-IX-V complex during romiplostim treatment (i-iv), whereas expression of GPIIbIIIa (v) remained normal. Blood samples were taken after 28 days of romiplostim treatment. Results are expressed as the mean fluorescent intensity ± SEM (n = 8 for GPVI and n = 4 for other proteins). (B) Western blot analysis showing total GPVI, GPIbβ, and GPIIIa expression (lysate from a pool of 8-10 mice, after 1 month of treatment, representative of 2 separate experiments). (C) Flow cytometric experiment showing absence of P-selectin exposure or Jon/A-PE labeling after romiplostim treatment (n = 4-5). (D) Bleeding time, measured by the tail tip sectioning, was not reduced in Myh9−/− mice treated with romiplostim for 1 month, whereas it was increased in treated WT mice.
Effect of romiplostim on bleeding time
Romiplostim treatment did not reduce the bleeding time in Myh9−/− mice after 1 month of treatment. Surprisingly, the bleeding time was increased in WT mice. This prolongation of bleeding time persisted throughout romiplostim treatment and was already present after only 10 days of treatment (not shown; Figure 6D). On the contrary, romiplostim administration for only 6 hours did not modify the bleeding time in WT mice (not shown).
Romiplostim enhances reticulin fibers in the BM of Myh9−/− mice to a larger extent than in WT mice
We also observed a difference in the amount of reticulin fibers in the BM of Myh9−/− mice compared with WT mice after romiplostim treatment. None of the nontreated WT mice showed reticulin fibers in the BM, and only one of the control Myh9−/− mice showed mild fibrosis. However, in sections from 4 of 5 independent Myh9−/− BMs a much stronger increase in reticulin fibers was present after 4 weeks of romiplostim treatment compared with sections from BM of 4 WT mice (Figure 7). This finding is important for safety considerations for long-term treatment with TPO receptor agonists of patients with MYH9-RDs.
Myosin-deficiency increased myelofibrosis induced by romiplostim. Histologic sections stained for reticulin fibers (appearing black, arrows) showing the absence of fibrosis in control WT or Myh9−/− BM, compared with the presence of fibrosis after 1 month of romiplostim treatment. Quantification was performed according to the absence of fibers (−), presence of a few fibers (+), or presence of numerous fibers (+++). Fibrosis was more extensive in Myh9−/− mice. Similar data were obtained with a second series of animals treated with the same romiplostim protocol (not shown).
Myosin-deficiency increased myelofibrosis induced by romiplostim. Histologic sections stained for reticulin fibers (appearing black, arrows) showing the absence of fibrosis in control WT or Myh9−/− BM, compared with the presence of fibrosis after 1 month of romiplostim treatment. Quantification was performed according to the absence of fibers (−), presence of a few fibers (+), or presence of numerous fibers (+++). Fibrosis was more extensive in Myh9−/− mice. Similar data were obtained with a second series of animals treated with the same romiplostim protocol (not shown).
Discussion
In this study we made 3 important observations. First, we show that the increase in the number of giant platelets in Myh9−/− mice by the TPO receptor agonist romiplostim does not affect the microcirculation to an extent that causes changes in histology. Second, our study provides first in vivo evidence that the risk of increased myelofibrosis induced by romiplostim treatment might be enhanced in patients with MYH9-RDs compared with patients with immune-thrombocytopenia. Third, romiplostim induces a reduction of the GPIbIX complex and of GPVI in Myh9−/− and WT mice.
Especially the first 2 findings are important in view of a recent clinical evaluation of another TPO receptor agonist, namely eltrombopag, in patients with MYH9-RDs.9 That pivotal study suggested that second-generation thrombopoietic agents could represent new therapeutic strategies in patients with MYH9-RDs presenting with symptomatic bleeding tendency. Although the increase in giant platelet numbers reduced the bleeding tendency clinically, it remained unclear whether the increase in circulating giant platelets could have deleterious consequences for the microcirculation, especially of the renal glomerula.
We evaluated the effects of administration of romiplostim over 1 month to Myh9−/− mice. These mice differ from patients with MYH9-RDs, because they lack the nonmuscular myosin IIA protein, whereas the protein is present albeit structurally changed in patients. However, the mice reproduce the macrothrombocytopenia of patients with MYH9-RDs.10 Although romiplostim was effective in these mice in terms of an increase in platelet counts, the effect was only modest (2-fold) compared with WT mice (7-fold). This was surprising because the absolute maximum number of MKs in the spleen of Myh9−/− mice after romiplostim treatment was even higher than in WT mice. In this regard, the mouse model reflects the observation of the clinical study with eltrombopag in patients with MYH9-RDs. These patients also showed a moderate increase in platelet counts only, and some of the patients did not respond to eltrombopag at all.9 Our study provides evidence that the reason for the moderate response to TPO receptor agonists could be in part the limited response dynamic of the Myh9−/− BM because of the increased baseline number of MKs that results from a higher amount of circulating TPO.15 Therefore, the mean fold increase in MK numbers both in the spleen and in the BM was significantly lower for Myh9−/− mice than for WT mice. Another reason is probably also the increased mortality and the intrinsic decreased capacity of Myh9−/− MKs to effectively produce platelets as previously reported.4 As observed by electron microscopy, the ultrastructural defects already observed in Myh9−/− BM15 were still present after romiplostim treatment, namely the invasive/leaky aspect, absence of peripheral zone, and abnormal development/organization of the demarcation membrane system (data not shown), indicating that stimulation of megakaryocytopoiesis does not improve Myh9−/− MK maturation or their ability to release platelets.
A major concern was whether the increase in numbers of circulating giant platelets in Myh9−/− mice may cause tissue infarcts because of occlusion of microvessels. Indeed MYH9-RD does not necessarily protect against cardiovascular diseases and thromboses despite reduced platelet number as observed in a few patients.17-19 Thus, agents that increase platelet count may indeed be considered with caution. To evaluate this possibility, histology on various tissues were performed to check for the presence of microthrombi. Histology of the microcirculation in brain, gut, pancreas, lungs, spleen, kidney, heart, and psoas muscle did not show any signs of microthrombi. These data suggest that increasing platelet counts in patients with macrothrombocytopenia may not worsen microcirculation and argue in favor of the use of thrombopoietic agents in patients with MYH9-RDs when needed.
However, our study also raises the relevant issue that the romiplostim-induced increase in BM reticulin fibers seems to be much more enhanced in Myh9−/− mice than in WT mice. Given the relatively good prognosis related to morbidity because of major bleeding in patients with MYH9-RDs, this finding in animal experiments indicates that a very careful risk-benefit assessment is necessary before patients with MYH9-RDs are treated for longer periods of time with TPO receptor agonists. Furthermore, this finding from animal experiments advises to control the BM in such patients to recognize patients with an increased risk for myelofibrosis in time. The observation of increased myelofibrosis is plausible and consistent with our finding of an increased death rate of Myh9−/− MKs in the BM. These dying cells probably release substances that promote myelofibrosis. That impaired storage of platelet α granule contents causes myelofibrosis is well known from the gray platelet syndrome.20-22
Our study also provides further information on more settle effects of romiplostim treatment. The romiplostim-induced increase in BM and spleen MK numbers was accompanied by an increase in MK transmigration as shown by the higher number of MK nuclei emboli counted in pulmonary vasculature (Figure 5). The presence of MKs or MK nuclei in the lungs has long been reported16,23,24 and is particularly increased in cases of reactive thrombopoiesis or after TPO treatment16 in agreement with the present observations. In addition, infusion of mature MKs into mice mostly localized to the pulmonary vasculature where they release platelets.25 This indicates that the pulmonary vascular bed represents indeed a major trap for circulating MKs. Our observations that the number of naked nuclei was not increased in the BM after romiplostim administration may suggest that most of the MKs produced in response to romiplostim exit the BM. A similar number of MK emboli were found in WT and Myh9−/− mouse lungs, indicating that Myh9−/− MKs are able to transmigrate to a similar extent as WT ones. In nontreated animals, only Myh9−/− mice exhibited a few MK nuclei emboli that may reflect the basal higher MK number present in their BM.
Interestingly, for both genotypes we observed an increase in platelet size after the start of romiplostim treatment, which was present until day 28 in WT mice, whereas it was reversible in Myh9−/− mice (Figure 1B). This suggests that the stimulation of megakaryocytopoiesis results in a change of platelet production with formation of larger platelets and potentially also in changes in the platelet membrane. The reversible pattern of platelet size increase in the Myh9−/− mice could be because of an increase in platelet debris, which overall may result into a decrease in mean platelet volume. When assessed by electron microscopy, also the Myh9−/− platelets appeared larger at day 33 (data not shown).
This prompted us to measure the expression of platelet membrane glycoproteins that showed a reduced expression of the GPIbIX complex and of GPVI after the start of romiplostim in both WT and Myh9−/− mice. This effect has not been described for TPO receptor agonists so far. Because we also observed in parallel a small increase in platelet size, the absolute decrease of receptor expression might even be underestimated. Reduction of membrane GPs can result from shedding by metalloproteases, from internalization, or from apoptosis. Both GPIbα and GPVI are cleaved by metalloproteinases after platelet activation.26 However, we found no evidence for platelet activation as indicated by the absence of P-selectin exposure or GPIIbIIIa activation. Although GPVI was reduced in the Western blot analyses, probably because of shedding, no decrease in GPIbα and GPIbβ was observed, which rules out putative romiplostim-induced decrease in protein synthesis. Platelet apoptosis is also unlikely to explain the decreased glycoproteins surface expression because both annexin V labeling and mitochondrial potential were unaffected by romiplostim treatment (not shown).
GPIb shedding might also be the reason for the observed decrease in the GPIb/GPIIbIIIa ratio in patients with MYH9-RDs,27 who have increased TPO levels, which might already trigger a reduction of GPIb expression. Because recent studies imply a potentially important role of the GPIbIX complex for thrombin generation,28,29 the observed decrease in GPIb-V-IX complex on platelet function and thrombin generation potential should be further assessed in patients receiving TPO receptor agonists.
Romiplostim treatment did not decrease the bleeding time in the Myh9−/− mice, indicating that in our model platelet dysfunction is not overcome by doubling the platelet count. Surprisingly, the bleeding time even increased in the treated WT mice. Although we have no evidence why this phenomenon occurs, it may be because of a combination of effects. These may include of course the decrease in the GPIb complex, and in GPVI, but also an increase in VWF consumption resulting from the high amount of circulating platelets, as already reported for thrombocythemia.30 A direct effect of romiplostim on platelet function is unlikely because romiplostim administration for 6 hours did not increase the bleeding time.
A potential limitation of our study is that we used Myh9−/− mice and not mice showing a heterozygous mutation of the Myh9 gene, which would reflect the exact situation in patients with MYH9-RDs. Furthermore, in our mouse model Myh9 is knocked out in the megakaryocytic lineage only, whereas in affected humans other organs are also affected. Thus, our study is primarily informative about platelet and MK-related effects. However, because the platelet phenotype observed in MYH9-RDs is autosomal dominant, and because Myh9−/− mice present with platelet characteristics of the human disease, including enlarged platelets, our model should sufficiently rule out the main issue of impairment of the microcirculation by increasing the number of giant platelets. Having an even more severe platelet phenotype in terms of total absence of contractile functions and higher mean platelet volume, compared with a heterozygous mutation as reported recently by Zhang et al,31 allows drawing stronger conclusions about the potential risks of such a treatment. A second note of caution relates to the duration of observation. Because our study was performed over a period of 1 month, the data do not exclude more pronounced adverse effects on myelofibrosis and microcirculation during long-term treatment.
In conclusion, we showed that romiplostim is able to increase, although modestly, the number of circulating platelets in a murine MYH9-RD model. Despite the presence of increased circulating large platelets, no occlusion of the microcirculation was observed whatever the organs examined. These data, together with a previous study that used eltrombopag in patients,9 are encouraging and further suggest that a short-term use of thrombopoietic agents could have a role in reducing the bleeding tendency in patients with MYH9-RDs without the risk for major adverse effects. However, during longer treatment of patients with MYH9-RDs with thrombopoietic agents, myelofibrosis has to be considered as a potential severe adverse effect, and patients should be carefully monitored. A more generally relevant finding is the reduction of GPIbIX and GPVI expression on platelets during treatment with TPO receptor agonists. This needs to be further assessed in patients receiving TPO receptor agonists.
There is an Inside Blood commentary on this article in this issue.
The publication costs of this article were defrayed in part by page charge payment. Therefore, and solely to indicate this fact, this article is hereby marked “advertisement” in accordance with 18 USC section 1734.
Acknowledgments
The authors thank Josiane Weber for excellent technical assistance and Monique Freund for animal management.
This work was supported by the Department of Cardiovascular Medicine at the Universitätsmedizin, Greifswald, and by ARMESA (Association de Recherche et Développement en Médecine et Santé Publique). C.L. is the recipient of a “contrat d'interface” between the EFS and Inserm.
AMGEN provided romiplostim. The company had no role in planning or performing the study, evaluating the data, or writing the manuscript.
Authorship
Contribution: C.L., F.P., A.E., and P.L. performed the mouse experiments and the electron microscopy studies; K.E. and F.D. performed the histology and MK quantifications; C.L., C.G., and A.G. designed the study, supervised the experiments, interpreted the results, and wrote the manuscript; and all authors contributed to the final version of the manuscript.
Conflict-of-interest disclosure: The authors declare no competing financial interests.
Correspondence: Christian Gachet, UMR_S949 Inserm-Université de Strasbourg, EFS-Alsace, 10, rue Spielmann, BP N 36, 67065 Strasbourg Cedex, France; e-mail christian.gachet@efsalsace.fr.


This feature is available to Subscribers Only
Sign In or Create an Account Close Modal