Abstract
A determinant of human T-lymphotropic virus-1 (HTLV-1)–associated myelopathy/tropical spastic paraparesis (HAM/TSP) development is the HTLV-1–infected cell burden. Viral proteins Tax and HBZ, encoded by the sense and antisense strands of the pX region, respectively, play key roles in HTLV-1 persistence. Tax drives CD4+-T cell clonal expansion and is the immunodominant viral antigen recognized by the immune response. Valproate (2-n-propylpentanoic acid, VPA), a histone deacetylase inhibitor, was thought to trigger Tax expression, thereby exposing the latent HTLV-1 reservoir to immune destruction. We evaluated the impact of VPA on Tax, Gag, and HBZ expressions in cultured lymphocytes from HTLV-1 asymptomatic carriers and HAM/TSP patients. Approximately one-fifth of provirus-positive CD4+ T cells spontaneously became Tax-positive, but this fraction rose to two-thirds of Tax-positive–infected cells when cultured with VPA. Valproate enhanced Gag-p19 release. Tax- and Gag-mRNA levels peaked spontaneously, before declining concomitantly to HBZ-mRNA increase. VPA enhanced and prolonged Tax-mRNA expression, whereas it blocked HBZ expression. Our findings suggest that, in addition to modulating Tax expression, another mechanism involving HBZ repression might determine the outcome of VPA treatment on HTLV-1–infected–cell proliferation and survival.
Introduction
Human T-lymphotropic virus-1 (HTLV-1) is the etiologic agent of adult T cell leukemia (ATL) and HTLV-1–associated myelopathy/tropical spastic paraparesis (HAM/TSP).1,2 Although the majority of HTLV-1–infected individuals remain asymptomatic carriers (ACs), the lifetime cumulative risk of developing ATL or HAM/TSP is < 5%. HTLV-1–provirus integrates into the genome of infected cells, predominantly CD4+CD25+ T lymphocytes, which represent the main reservoir in peripheral blood.3 HAM/TSP, a central nervous system neuroinflammatory disease, is associated with perivascular and parenchymal infiltration of HTLV-1–infected T cells and activated cytotoxic T lymphocytes (CTLs).4
A major determinant of HAM/TSP development is the HTLV-1–infected cell burden. The peripheral blood HTLV-1–proviral load is higher in HAM/TSP patients than AC.5,6 Follow-up studies of HAM/TSP cohorts showed that high provirus loads were associated with rapid disease progression.7-9 Those studies also demonstrated a relative stability of the HTLV-1–proviral load throughout the disease. Set-point provirus load and subsequent HAM/TSP risk are influenced by the cellular immune-response efficiency,10 although excessive activation of HTLV-1–specific CTLs might become deleterious and contribute to central nervous system tissue damage.4 Host-pathogen interplay is characterized by very dynamic kinetics, resulting in an equilibrium between the virus-driven clonal expansion of infected T cells11 and tight control exerted by the immune response.10
Tax, a transactivator protein encoded by the pX region of the HTLV-1 genome, plays a central role in disease pathogenesis. Tax activates viral transcription and also modulates many cellular signaling pathways involved in T cell activation, cycling, apoptosis or a combination.12 Tax expression is promitotic and drives CD4+ T-cell proliferation.13 At the same time, Tax is the immunodominant target recognized by the CTL response.14 Rapid immune elimination of Tax-expressing cells may explain the poor detection of Tax-gene products (ie, mRNA or protein) in freshly isolated peripheral blood mononuclear cells (PBMCs) from infected patients.15-18 Short-term culture enables Tax detection and ex vivo conditions might allow Tax-expressing cells to escape immune selective pressure.19
The current model of HTLV-1 accumulation and persistence supposes 2 steps: first, Tax expression propels CD4+ T cells into cell cycling, which is well documented; and second, silencing of virus expression allows escape from immune surveillance, which remains to be elucidated. Epigenetic mechanisms might participate in silencing of HTLV-1 gene transcription.20 Use of histone deacetylase (HDAC) inhibitors, such as valproate (2-n-propylpentanoic acid, VPA), was postulated to transiently activate virus expression and thereby expose the latent virus reservoir to immune destruction.21,22 Another avenue of research focuses on negative posttranscriptional regulators of virus expression, eg, pX-encoded Rex and p30II proteins.23 The HTLV-1 basic leucine zipper factor (HBZ), encoded by the provirus negative strand is suspected of down-regulating virus transcription and contributing to immune escape.24 HBZ mRNA promotes CD4+ T-lymphocyte proliferation and, unlike Tax mRNA, is consistently detected in ATL cells.25 HBZ expression probably contributes to leukemogenesis.26,27
Herein, we evaluated the kinetics of Tax-, Gag-, and HBZ-gene expressions in CD4+ T lymphocytes from ACs and HAM/TSP patients during short-term cultures with or without valproate. The HBZ-mRNA increase was delayed concomitant with decreasing Tax- and Gag-gene products. Notably, VPA had opposite effects on both transcriptions: enhancing sense transcriptions (ie, Tax and Gag expression), while impairing antisense transcription (ie, HBZ mRNA). Our findings suggest that HDACs and their inhibitors have complex interactions with HTLV-1 replication and clonal expansion of infected cells.
Methods
Patients
This study, conducted at University Hospital of Fort-de-France, Martinique (French West Indies), included 11 HAM/TSP patients and 12 ACs. HAM/TSP diagnosis was based on the 4 World Health Organization criteria: slowly progressive spastic paraparesis with symmetrical pyramidal signs, disturbed bladder function, no radiologic evidence of significant spinal cord compression, and intrathecal synthesis of anti–HTLV-1 antibodies. Since 1998, magnetic resonance imaging has replaced myelography to exclude spinal cord compression.9 ACs had no neurologic symptoms. Peripheral blood samples were used in accordance with French bioethics laws concerning biologic collections. All experiments using patient samples were approved by the Ministère de la Recherche and the Comité de Protection des Personnes.
Cell culture and VPA treatment
We isolated PBMCs from EDTA-anticoagulated blood samples on Ficoll-density gradients and washed them in PBS. CD8+ cells were removed using anti-CD8 paramagnetic microbeads (Miltenyi Biotec), following the manufacturer's instructions. CD8+-cell–depleted PBMCs were then placed in culture wells (round-bottomed 24-well plate) at 106/mL in 1 mL of RPMI 1640 medium, supplemented with 10% FCS, glutamine (2mM), penicillin (100 IU/mL), and streptomycin (100 μg/mL; Eurobio). When appropriate, VPA was added to the medium at 1 or 5mM concentrations; the former concentration is pharmacologically relevant,21 whereas the latter concentration was used to search for dose-response effects. Cells and culture supernatants were harvested after different times of incubation at 37°C in 5% CO2, from day 0 (D0) up to D5, depending on the analysis performed.
Flow cytometry analysis of apoptosis
Cells were washed in PBS, resuspended in annexin V–binding buffer, and incubated for 15 minutes at room temperature with FITC-labeled annexin and propidium iodide (PI) reagents (BD Biosciences). We analyzed 10 000 events in dual-labeled samples by using a flow cytometer (FACSCalibur; BD Biosciences). Percentages of viable and apoptotic cells were determined using CellQuest software (Becton Dickinson Immunocytometry Systems) after appropriate compensations.
Flow-cytometry detection of Tax protein
Cells were washed in PBS and then incubated with peridinin-chlorophyll protein–labeled anti-CD3, allophycocyanin-labeled anti-CD4, and phycoerythrin-labeled anti-CD25 or isotype control monoclonal antibodies (mAbs; BD Biosciences) for 30 minutes at 4°C. Cells were fixed and permeabilized by using the Cytofix/Cytoperm Fixation/Permeabilization Solution kit (BD Biosciences), as recommended by the manufacturer. Cells were then incubated with 1/100-diluted anti-Tax protein Lt-4-FITC–conjugated mAb28 or immunoglobulin G3 isotype-control mAb (Southern Biotechnology Associates) for 30 minutes at 4°C. The cells were washed twice in PBS before analysis of at least 10 000 events for each 4-fold–labeled sample with FACSCalibur and CellQuest software.
Detection of p19 virus-core protein by ELISA
Cell culture supernatants were collected, and virus-core p19 protein was analyzed by ELISA (Retrotek; Zeptometrix), according to the manufacturer's protocol. Absolute concentrations of p19 were determined with a standard purified-antigen dilution curve.
Analyses of Tax-, Gag-, and HBZ-gene expressions by quantitative RT-PCR
Cells were collected and cryopreserved as dry pellets until used. Nucleic acid was extracted using the AllPrep DNA/RNA Mini kit (QIAGEN). To obtain first-strand cDNA, total RNA isolated from each sample was subjected to reverse transcription by SuperScript II reverse transcriptase (Invitrogen) in the presence of oligo(dT)12-18 primer (Invitrogen). Real-time PCR was run in triplicate by using LightCycler 480 SYBR Green I Master Mix on LightCycler 480 thermocycler (Roche Applied Science). Respective forward and reverse primers used were Tax (forward primer, 5′-CCAACACCATGGCCCACTT-3′; reverse primer, 5′-GATGGGGTCCCAGGTGATCT-3′), Gag (forward primer, 5′-AGCCCCCAGTTCATGCAGACC-3′; reverse primer, 5′-GAGGGAGGAGCAAAGGTA-3′), and HBZ (forward primer, 5′-ATGGCGGCCTCAGGGCTGT-3′, reverse primer, 5′-TGGAGGGCCCCGTCGCAG-3′). Relative mRNA quantification was performed using Cp (crossing point) determined by the second derivative peak of each amplification curve and normalized to reference genes β-actin (forward primer, 5′-CCAACCGCGAGAAGATGA-3′; reverse primer, 5′-CCA GAG GCG TAC AGG GAT AG-3′) and hypoxanthine-guanine phosphoribosyltransferase-1 (forward primer, 5′ TGACACTGGCAAAACAATGCA-3′; reverse primer, 5′-GGTCCTTTTCACCAGCAAGCT-3′).29
Measurement of HTLV-1–provirus load
HTLV-1–proviral load was quantified using the real-time TaqMan polymerase chain reaction method, as described previously.6 In brief, SK110/SK111 primers were used to amplify a 186-bp fragment of the pol gene, and the dual-labeled TaqMan probe (5′-5-carboxyfluorescein and 3′-5-carboxytetramethylrhodamine) was located at bp 4829-4858 of the HTLV-1 reference sequence (HTLVATK). Albumin DNA was quantified in parallel to determine the input cell number and was used as an endogenous reference. Standard curves were generated using 10-fold serial dilutions of a double standard plasmid (pcHTLV-ALB) containing 1 copy of the target regions of the HTLV-1 pol and cellular albumin genes. All samples were run in duplicate. The HTLV-1–provirus load was reported as ([HTLV-1 average copy number]/[albumin average copy number]) × 2 × 10⁶ and is expressed as the number of HTLV-1 copies/106 cells.
Estimation of gene expression per HTLV-1–infected cell
Assuming that almost all infected cells in non-ATL cases harbor only 1 provirus, it can be considered that provirus load reflects the percentage of infected cells. Proviral load was used to estimate the percentage of HTLV-1–provirus positive cells expressing Tax protein and, when appropriate, to normalize gene expression between different samples and incubation times.
Statistical analyses
Data on paired and unpaired observations were compared, respectively, with Wilcoxon's signed-rank test and the Mann-Whitney U test. Correlations between continuous variables were assessed with Spearman's rank-order statistic. Statistical significance was set at P < .05.
Results
VPA was proapoptotic for lymphocytes isolated from AC and HAM/TSP patients
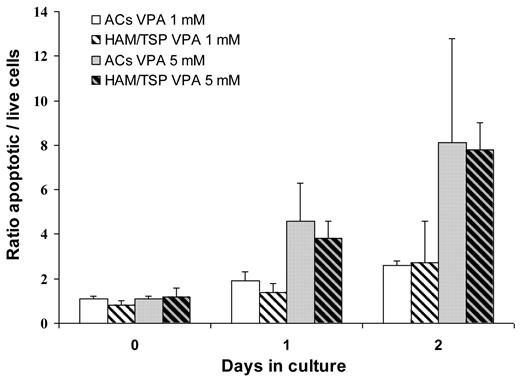
We first verified VPA impact on cell viability of short-term cultured CD8+-cell–depleted lymphocytes from HTLV-1–infected individuals. The VPA proapoptotic effect increased gradually from D0 to D2 and was dose-dependent, being higher at 5mM than at 1mM VPA (Figure 1). On D2 of culture of AC lymphocytes, the mean ± SD percentages of annexin-positive cells were 16 ± 2% in 1mM VPA-treated versus 6 ± 1% in nontreated wells and 29 ± 15% in 5mM VPA-treated versus 4 ± 1% in nontreated wells (Wilcoxon signed-rank test: P = .008 and .008, respectively). D2 rates of HAM/TSP patients' apoptotic cells were 12 ± 6% in 1mM VPA-treated versus 5 ± 2% in nontreated wells and 31 ± 2% in 5mM VPA-treated versus 4 ± 1% in nontreated wells (Wilcoxon signed-rank test: P = .03 and .008, respectively). As shown in Figure 1, VPA-induced apoptosis levels in cells from AC and HAM/TSP patients at each time, and VPA concentration were comparable (Mann-Whitney U test, P > .5).
VPA is proapoptotic for ex vivo-cultured CD4+ T cells from HTLV-1 AC and HAM/TSP patients. CD4+ cells isolated from 10 AC patients (non–cross-hatched bars) and 10 HAM/TSP patients (cross-hatched bars) were cultured for 6 (D0), 24 (D1), or 48 hours (D2) with 1mM VPA (white back bars) or 5mM (gray back bars) VPA. Apoptotic cells were identified by flow cytometry based on annexin-PI labeling, and the ratios of the apoptotic rates of VPA-treated to nontreated cells were calculated. Mean ratio ± 1 SD are plotted.
VPA is proapoptotic for ex vivo-cultured CD4+ T cells from HTLV-1 AC and HAM/TSP patients. CD4+ cells isolated from 10 AC patients (non–cross-hatched bars) and 10 HAM/TSP patients (cross-hatched bars) were cultured for 6 (D0), 24 (D1), or 48 hours (D2) with 1mM VPA (white back bars) or 5mM (gray back bars) VPA. Apoptotic cells were identified by flow cytometry based on annexin-PI labeling, and the ratios of the apoptotic rates of VPA-treated to nontreated cells were calculated. Mean ratio ± 1 SD are plotted.
VPA did not affect HTLV-1–provirus load during ex vivo culture of HTLV-1–infected CD8+-cell–depleted PBMCs
Mean ± SD and median HTLV-1–provirus loads in freshly isolated (D0) and CD8+-cell–depleted PBMCs from all samples evaluated were 50 589 ± 36 636 and 43 500 copies/106 cells. No correlation was found between initial percentages of HTLV-1–infected cells, assessed as D0 provirus load, and VPA-induced apoptosis observed on culture D2 (Spearman's rank-correlation test, P = .9). The percentages of HTLV-1–infected cells, assessed as HTLV-1–provirus load, remained stable over 5 days of culture with or without VPA (Figure 2). The difference observed on D5 was not significant (Wilcoxon signed-rank, test P = .1).
HTLV-1–proviral load remained stable throughout ex vivo culture of HTLV-1–infected CD4+ T cells with or without valproate. CD4+ T cells isolated from HTLV-1–infected individuals were cultured without (control [Ctl]) or with 5mM VPA (white and gray boxes, respectively). HTLV-1–proviral load was measured on D0, D1, D2, and D5 for the 20 subjects. Horizontal bars show the bold median and, from bottom to top, the 10th, 25th, 75th, and 90th percentiles.
HTLV-1–proviral load remained stable throughout ex vivo culture of HTLV-1–infected CD4+ T cells with or without valproate. CD4+ T cells isolated from HTLV-1–infected individuals were cultured without (control [Ctl]) or with 5mM VPA (white and gray boxes, respectively). HTLV-1–proviral load was measured on D0, D1, D2, and D5 for the 20 subjects. Horizontal bars show the bold median and, from bottom to top, the 10th, 25th, 75th, and 90th percentiles.
VPA enhanced Tax- and Gag-protein levels in short-term cultures of HTLV-1–infected CD8+-cell–depleted PBMCs
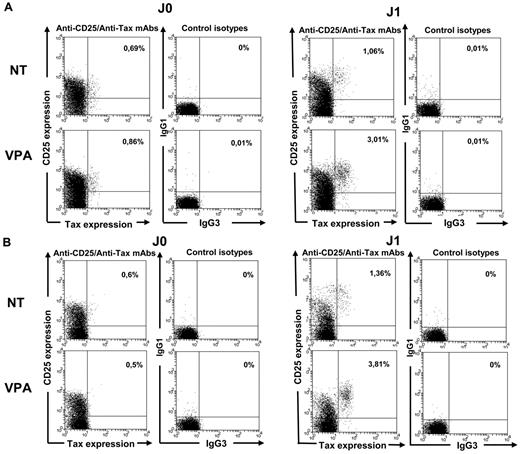
We next analyzed the expression of intracellular Tax by flow cytometry for 20 HTLV-1–infected samples. Tax-labeling efficiency using the anti–Tax Lt-4-FITC–conjugated mAb was first verified using MT2 cells (data not shown). Quadruple labeling showed that Tax was almost exclusively detected in CD25-expressing CD3+CD4+ lymphocytes (Figure 3A-B).
Tax induction in HTLV-1–infected CD4+ T cells treated with 1mM VPA. Intracellular Tax-protein expression in CD4+ T cells was analyzed by flow cytometry using quadruple CD3, CD4, CD25, and Tax (Lt-4 mAb) labeling and appropriate isotype controls. Experiments were performed on D0, D1, and D2 of culture of lymphocytes from 10 HTLV-1 ACs (A) and 10 HAM/TSP patients (B). D0 and D1 results from 1 representative experiment are shown.
Tax induction in HTLV-1–infected CD4+ T cells treated with 1mM VPA. Intracellular Tax-protein expression in CD4+ T cells was analyzed by flow cytometry using quadruple CD3, CD4, CD25, and Tax (Lt-4 mAb) labeling and appropriate isotype controls. Experiments were performed on D0, D1, and D2 of culture of lymphocytes from 10 HTLV-1 ACs (A) and 10 HAM/TSP patients (B). D0 and D1 results from 1 representative experiment are shown.
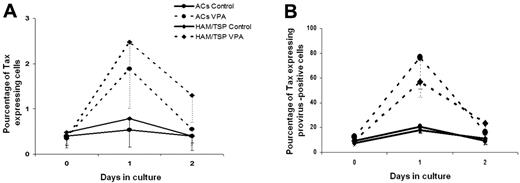
Tax was detected in < 0.5% of CD4+ T cells freshly isolated (D0) or cultured for 6 hours with or without VPA. Mean percentages of Tax protein-expressing CD4+ T cells in VPA-treated and nontreated wells rose to 3.4% and 1.1%, respectively, on D1 (Wilcoxon signed-rank test, P = .01) and 1.4% and 0.4%, respectively, on D2 (Wilcoxon signed-rank test, P = .02). Mean peak percentage (D1 or D2) of Tax expression was 3.9% of VPA-treated and 1.1% of nontreated CD4+ T cells (Wilcoxon signed-rank test, P = .001). Median values are shown in Figure 4A. Results were similar for both VPA concentrations (data not shown). When considering HTLV-1–provirus loads measured at each time, the estimated median rate of provirus-positive CD4+ T cells spontaneously expressing Tax increased from < 8% on D0 to 19% on D1 and returned to 10% on D2. When VPA was added to the culture medium, the median Tax-detection rate rose to 63% on D1 but was 18% on D2. The difference between VPA-treated and nontreated samples was significant on D1 but not D2 (Wilcoxon signed-rank test, P = .00001 and .059, respectively). Tax-expression kinetics with and without VPA was similar in samples from 10 AC and 10 HAM/TSP patients (Figure 4B).
Valproate increases Tax-protein expression in HTLV-1–infected CD4+ T cells from asymptomatic carriers and HAM/TSP patients. Rates of Tax-protein–positive cells among HTLV-1–infected CD4+ T cells were calculated by normalizing the percentages of Tax-positive CD4+ cells, determined by CD3, CD4, and Tax triple labeling (A), with the percentage of infected cells in the CD4+ population, as assessed by HTLV-1–proviral load (B). Estimated median (and first quartile) percentages of Tax-positive cells among HTLV-1–infected CD4+ cells on D0 to D2 of culture is represented for 10 ACs (●) and 10 HAM/TSP patients (♦) treated with 5mM VPA (dashed lines) or nontreated (Ctrl, solid lines), respectively.
Valproate increases Tax-protein expression in HTLV-1–infected CD4+ T cells from asymptomatic carriers and HAM/TSP patients. Rates of Tax-protein–positive cells among HTLV-1–infected CD4+ T cells were calculated by normalizing the percentages of Tax-positive CD4+ cells, determined by CD3, CD4, and Tax triple labeling (A), with the percentage of infected cells in the CD4+ population, as assessed by HTLV-1–proviral load (B). Estimated median (and first quartile) percentages of Tax-positive cells among HTLV-1–infected CD4+ cells on D0 to D2 of culture is represented for 10 ACs (●) and 10 HAM/TSP patients (♦) treated with 5mM VPA (dashed lines) or nontreated (Ctrl, solid lines), respectively.
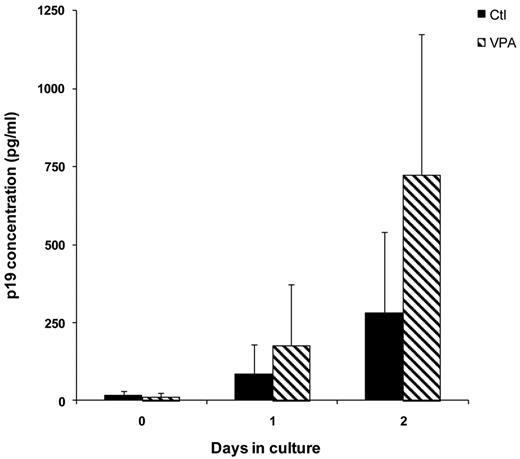
Expression of HTLV-1–core p19 protein was monitored in cell culture supernatants, and levels were corrected considering the proportion of nonapoptotic cells (Figure 5). VPA stimulated p19-protein production that differed significantly from nontreated cells on D2 (Wilcoxon signed-rank test, P = .04).
VPA activates the expression of the virus core-protein p19 in the culture supernatants of CD4+ T cells from HTLV-1–infected individuals. Culture supernatants were collected and expression of virus core-protein p19 was quantified by ELISA. Absolute p19 concentrations (in picograms per milliliter) were determined by normalization of absorbance values to a standard curve. p19-protein levels were corrected by considering the proportion of nonapoptotic cells, determined from annexin-PI flow cytometry analysis of each sample. Mean ± 1 SD concentration at different incubation times is represented for the 20 HTLV-1–infected samples cultured without (black bars) or with 5mM VPA (cross-hatched bars).
VPA activates the expression of the virus core-protein p19 in the culture supernatants of CD4+ T cells from HTLV-1–infected individuals. Culture supernatants were collected and expression of virus core-protein p19 was quantified by ELISA. Absolute p19 concentrations (in picograms per milliliter) were determined by normalization of absorbance values to a standard curve. p19-protein levels were corrected by considering the proportion of nonapoptotic cells, determined from annexin-PI flow cytometry analysis of each sample. Mean ± 1 SD concentration at different incubation times is represented for the 20 HTLV-1–infected samples cultured without (black bars) or with 5mM VPA (cross-hatched bars).
Opposite VPA effects on the kinetics of HTLV-1 sense and antisense gene expressions in CD8+-cell–depleted PBMCs from HTLV-1–infected subjects
To explore further the VPA effect on Tax and HBZ expressions at the transcriptional level, we investigated Tax-, Gag-, and HBZ-mRNA expression kinetics by quantitative RT-PCR.
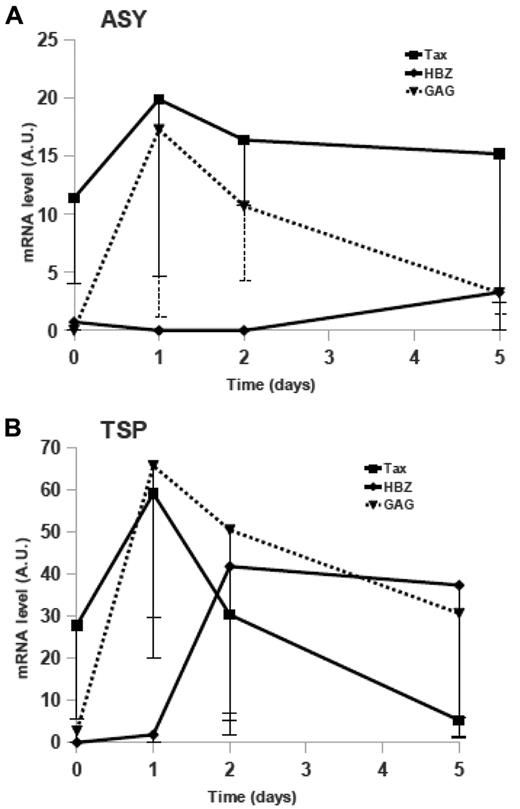
We first quantified viral mRNA expression in CD8+-cell–depleted PBMCs from AC or HAM/TSP patients cultured without VPA (Figure 6). For both groups, Gag and HBZ expressions were low at culture onset. We observed that in AC, Tax-mRNA level correlated with provirus load (Spearman's coefficient, R = 0.812; P = .008) but not for HAM/TSP patients (R = 0.195, P = .59). As expected, we also observed increased Tax expression during the first 24 hours of culture. Maximum of Tax-expression peaks were reached after 1 day of culture for both groups, independently of clinical status (Figure 6A-B). Concomitantly with the Tax increase, the Gag-mRNA level rose during D1 of culture. Tax- and Gag-mRNA kinetics were parallel, and their expressions were correlated (R = 0.546, P = .0007 for AC patients; R = 0.565, P = .0001 for TSP/HAM patients).
Kinetics of Tax-, Gag-, and HBZ-mRNA expressions in short-term cultures of CD4+ T cells from HTLV-1 asymptomatic carriers and HAM/TSP patients. Tax- (■, solid line), Gag- (▴, dotted line), and HBZ-mRNA (♦, solid line) in ex vivo cultured lymphocytes from AC (A) or HAM/TSP (B) patients were quantified (as described under “Methods”). The medians (and first quartiles) expressed in arbitrary units (AU) for 8 AC and 10 HAM/TSP patients are shown.
Kinetics of Tax-, Gag-, and HBZ-mRNA expressions in short-term cultures of CD4+ T cells from HTLV-1 asymptomatic carriers and HAM/TSP patients. Tax- (■, solid line), Gag- (▴, dotted line), and HBZ-mRNA (♦, solid line) in ex vivo cultured lymphocytes from AC (A) or HAM/TSP (B) patients were quantified (as described under “Methods”). The medians (and first quartiles) expressed in arbitrary units (AU) for 8 AC and 10 HAM/TSP patients are shown.
Median HBZ-mRNA expressions increased after 5 days of culture in CD8+-cell–depleted PBMCs from AC patients' cells (Figure 6A) and after only 2 days of culture in HAM/TSP patients' cells (Figure 6B). It is worth noting that the HBZ-mRNA level on D5 correlated with proviral load in AC patients (R = 0.800, P = .01) but not in HAM/TSP patients, and increased HBZ expression, issued from 3′-long terminal repeat (LTR)-dependent transcription, seemed to correspond to decreased gene expression derived from 5′-LTR–dependent transcription (Tax and Gag).
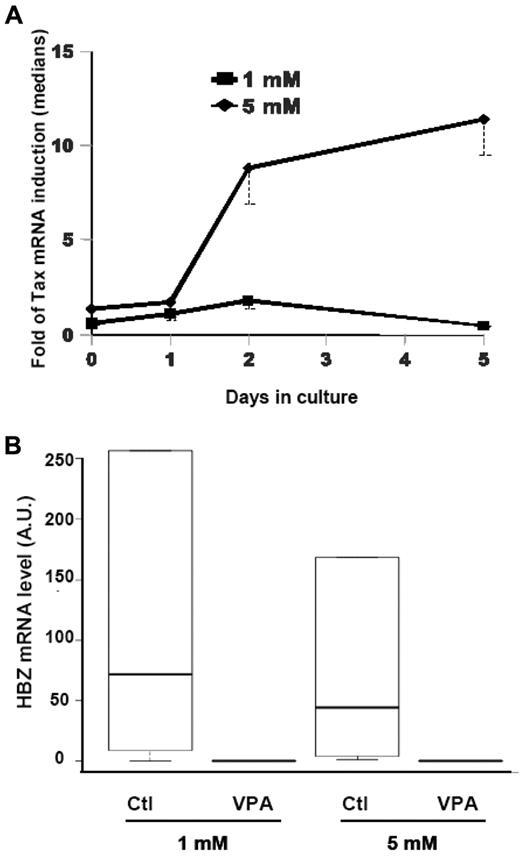
We next assessed the VPA effect on Tax-, Gag-, and HBZ-gene expressions. CD8+-cell–depleted PBMCs from HTLV-1–infected subjects were incubated with 1 or 5mM VPA. We observed an increased Tax mRNA in treated lymphocytes, as observed by flow cytometry (Figure 3). When 1mM VPA was used, no difference was observed in the Tax-induction ratio (Tax level with VPA/Tax level without VPA) between cells from AC and HAM/TSP patients (data not shown). However, with 5mM VPA, the Tax-induction ratio was significantly higher in HAM/TSP patients' cells than in AC patients' cells after 2 days of culture (Wilcoxon signed-rank test: P = .004 and .005, respectively, vs nontreated cells). When we compared VPA Tax-induction ratios in ex vivo cultures of T lymphocytes from HAM/TSP patients, both VPA concentrations had similar effects during the first 24 hours of culture (Figure 7A). For cells treated with 1mM VPA, the median Tax-induction peaked after 48 hours of culture and decreased between D2 and D5. In contrast, in 5mM VPA-treated T lymphocytes from HAM/TSP patients, Tax expression was strongly induced from D2 to D5, compared with that of nontreated cells (Wilcoxon signed-rank test: P = .003 and .0465, respectively; Figure 7A). Moreover, this induction in 5mM VPA-treated cells was significantly higher than in 1mM VPA-treated cells (Wilcoxon signed-rank test, P = .01 on D2 and .008 on D5). Furthermore, in the presence of 5mM VPA, Tax expression remained high during ex vivo culture of HAM/TSP patients' cells. No such phenomenon was observed in 5mM VPA-treated AC patients' cells.
VPA effects on Tax and HBZ expressions in CD4+ T cells from HAM/TSP patients. (A) Patients' CD4+ T cells were cultured for the indicated times with 1mM (■) or 5mM VPA (♦). The curves illustrate VPA induction of Tax expression compared with the corresponding nontreated sample (medians and first quartiles of 5 patients for each concentration). (B) Box plot of the HBZ-mRNA levels, expressed in arbitrary units (AU), in CD4+ T lymphocytes from HAM/TSP patients after 5 days of culture with or without the indicated VPA concentration (5 patients per concentration). Horizontal lines are the bold medians and, from bottom to top, 10th, 25th, 75th, and 90th percentiles.
VPA effects on Tax and HBZ expressions in CD4+ T cells from HAM/TSP patients. (A) Patients' CD4+ T cells were cultured for the indicated times with 1mM (■) or 5mM VPA (♦). The curves illustrate VPA induction of Tax expression compared with the corresponding nontreated sample (medians and first quartiles of 5 patients for each concentration). (B) Box plot of the HBZ-mRNA levels, expressed in arbitrary units (AU), in CD4+ T lymphocytes from HAM/TSP patients after 5 days of culture with or without the indicated VPA concentration (5 patients per concentration). Horizontal lines are the bold medians and, from bottom to top, 10th, 25th, 75th, and 90th percentiles.
Although VPA increased the Gag-mRNA level in both HTLV-1–infected groups (data not shown), induction was only statistically significant in HAM/TSP patients' lymphocytes after 24 hours of ex vivo culture with 1mM VPA and from D2 to D5 for the 5mM dose (Wilcoxon signed-rank test: P = .03, .009, .003, and .01 for D2, D3, D4, and D5, respectively).
We next examined VPA impact on HBZ expression (Figure 7B). Intriguingly, VPA seemed to have an opposite effect from that observed on Tax and Gag genes controlled by 5′-LTR transcription. Indeed, VPA treatment inhibited HBZ expression during late culture times. This inhibition was especially evident on D5, even with the lowest VPA concentration, for HAM/TSP patient's cells (Wilcoxon signed-rank test: P = .05 and .05; Figure 7B). No statistically significant VPA effect was seen on HBZ expression in AC patients' cells, probably because the initial HBZ level in nontreated cells was too low to observe any down-modulating effect of VPA.
Discussion
Reduction of the HTLV-1–provirus load might prevent long-term development of HAM/TSP or slow its progression. Therapeutic protocols designed to affect HTLV-1–infected cell proliferation or virus replication are still ineffective.30 A novel approach, called gene-activation therapy, has been proposed, based on preclinical trials in the bovine leukemia virus model31 and preliminary data on HAM/TSP.21 The principle is to activate viral gene expression by HDAC inhibitors and thereby expose virus-positive cells to the host immune response.22
Attention has focused on VPA, the sodium salt of 2-propylpentanoic acid, which is well tolerated and displays adequate pharmacokinetics. This compound induces histone hyperacetylation and activates HTLV-1 5′-promoter–driven transcription.21 VPA enhances Tax-protein expression during short-term culture of HTLV-1–infected cells.32 Mosley et al estimated that VPA exposure increased the percentages of Tax-expressing provirus-positive CD4+ cells from 13% to 22%. We confirmed this observation, but with Tax-expressing provirus-positive cells rising from one-fifth spontaneously to two-thirds after adding VPA to the culture. Almost all Tax-expressing CD4+ T cells were CD25-positive. The CD3+CD4+CD25+ subset is the major reservoir of HTLV-1–provirus and Tax peptide–HLA class I complexes and might stimulate and expand HTLV-1 Tax-specific CD8+ T cells.3 Together, these quantitative and qualitative data are consistent with the theoretical hypothesis of unmasking of the latently infected cell pool and CTL clearance. However, concerns have been raised about therapeutic applications. A variety of proteins are regulated by HDAC-mediated acetylation and it was suggested that, as a side-effect of VPA treatment, the CD8+ cell antiviral function might be altered.32 Moreover, memory CD8+ T cells contribute to virus reservoir in vivo and might be destroyed by autologous HTLV-1–specific CTL in a fratricidal response.33 Finally, the major risk would be to trigger virus replication, as evidence by viral p19 matrix-antigen release, stimulate Tax-driven clonal expansion, and favor, if uncontrolled, subsequent central nervous system-tissue invasion.
To address this question, more information on the mechanisms involved in controlling HTLV-1–gene expression is required. HBZ is a potent suppressor of Tax-mediated virus-gene transcription by interacting with activating transcription factor/cAMP responsive element-binding protein (CREB) and CREB-binding protien/p300 on the 5′-LTR promoter.24,34,35 The HBZ role in the tightly regulated pattern of HTLV-1–gene expression also is suggested by HBZ repression of Gag-p19 synthesis in stable virus-producing cell clones.36 Kinetic study of gene expressions in cells transiently transfected with the HTLV-1–provirus plasmid and in newly infected PBMCs showed that Gag/Pol, Tax/Rex, and Env mRNA are detected first and at their highest levels, whereas HBZ transcription was significantly lower and peaked later.37 However, the experimental systems used by Li et al37 remained far removed from the physiopathologic conditions of established HTLV-1 infections.
Herein, we described similar kinetics in freshly isolated and short-term cultured cells from HTLV-1–infected individuals. Tax- and Gag-mRNA expressions peaked at high levels on culture D1, before declining progressively concomitant with the rise of HBZ expression. Although the chronology in HAM/TSP cells is consistent with the hypothesis of a feedback loop coordinating Tax and HBZ expressions, we cannot exclude that in ACs the observed concomitant Tax-expression decrease and HBZ-expression increase are not related to cellular mechanisms or perhaps involve other HTLV-1 auxiliary proteins, for example, p30 or Rex.23 Indeed, as shown in Figure 6, expression of Tax and HBZ were regulated differently in infected cells from AC and TSP/HAM patients.
We analyzed VPA impact on the balance of Tax/HBZ-mRNA expression in freshly cultured cells. VPA significantly enhanced but also prolonged Tax-mRNA levels. It should be noted that, in the presence of 5mM VPA, Tax-gene–expression kinetics was profoundly modified, with Tax rising constantly during lymphocyte culture, suggesting dysregulation of the processes responsible for its expression in cultured lymphocytes from HAM/TSP patients but not from ACs. Gag-mRNA–level kinetics under VPA was consistent with Tax findings. Surprisingly, VPA blocked the expression of HBZ. VPA's opposite effects on Tax and HBZ expressions might be explained by its isoenzyme-selective down-modulator properties. Indeed, HDAC complexes differ between the 5′- and 3′-HTLV-1 promoters, with HDAC1 and HDAC2 binding preferentially at the 5′-LTR and HDAC3 binding at the 3′-LTR.38 VPA, in addition to the weakly inhibiting catalytic activity of class I HDAC39 induces proteasomal degradation of HDAC2, unlike other inhibitors, eg, trichostatin A.40 VPA preferentially releases HDAC2-dependent transcriptional repression and therefore might favor Tax binding at the 5′-LTR and sense-strand transcription. VPA modulation of HDAC levels is selective and does not affect HDAC3.40 Alternatively, we cannot exclude that activation of sense transcription by Tax and VPA would impair antisense transcription, either by competing for transcription factors (ie, activating transcription factor/CREB factors) or interfering with its initiation. Indeed, we showed previously that deletion of the 5′-LTR (ie, sense transcription) promoted transcription from the 3′-LTR (ie, antisense transcription).41
HBZ mRNA has a growth-promoting effect on T lymphocytes, as demonstrated by mutation analyses of HBZ gene and short-hairpin RNA knockdown experiments.25,42 The HBZ-mRNA–expression level has been shown to correlate with proviral load and was linked to survival of virus-infected cells in a rabbit model.37 In vivo HBZ expression was correlated to proviral load43,44 and HAM/TSP severity.44 We consistently observed significantly higher spontaneous HBZ-mRNA levels in samples from HAM/TSP patients than in samples from ACs. CD8+ cell depletion enabled evaluation of the intrinsic VPA impact on infected lymphocytes. Despite increased Tax production, percentages of HTLV-1–infected cells did not increase overtime in VPA-treated samples. That observation suggests that VPA-induced repression of HBZ expression counterbalances Tax stimulation of virus replication and T-cell proliferation.
Initial proof-of-concept studies provided evidence of complex relationships between VPA administration and HTLV-1–proviral loads. VPA treatment of HAM/TSP patients increased peripheral blood proviral load during the first weeks of the trial,21 an observation recently confirmed in the simian T-cell leukemia virus type-1 (STLV-1) model.45 Addition of azidothymidine (AZT) to block infectious propagation prevented the transient rise of virus production, and combined VPA and AZT treatment rather than VPA alone, strongly decreased the STLV-1–proviral load. Afonso et al45 suggested that virus-expressing cells were killed by STLV-1–specific CTLs, which are protected by AZT from fratricidal destruction. In a recent 2-year clinical trial, VPA alone did not alleviate HAM/TSP symptoms (S.O. and L.W., manuscript in preparation). Results reported herein suggest that, in addition to Tax expression and the Tax-mediated CTL response, another mechanism involving HBZ repression might affect the net outcome of VPA therapy. Moreover, a more recent paper confirmed that HBZ plays a central role in HTLV-1 persistence and the authors suggested that, despite Tax being the immunodominant antigen, the CD8+-T cells specific to HBZ are the most effective at controlling HTLV-1.46 The VPA-induced HBZ decrease also could enable the infected cells to escape this efficient immune response, thereby limiting the therapeutic impact on the virus reservoir within treated patients.
VPA induced moderate and dose-dependent apoptosis of cultured CD4+ lymphocytes. Apoptosis rates were similar in lymphocytes from HAM/TSP patients and ACs, and there was no evidence of specific elimination of HTLV-1–infected cells. However, this drug requires further studies designed to test its effect on HTLV-1–transformed cells. Indeed, VPA has been shown to induce the death of chronic lymphocytic leukemia cells,47 and several trials are currently exploring its activity against various types of cancer, including hematologic malignancies.48 Depsipeptide, another HDAC inhibitor, has demonstrated efficacy against primary ATL cells.49 Moreover, in a murine model of human ATL,50 HDAC inhibitors are able to trigger growth arrest and death of HTLV-1–infected cell lines and ATL cells via activation of the death-receptor pathway and potentialization of tumor necrosis factor-related apoptosis-inducing ligand response.51 More generally, epigenetic drugs are known to regulate expression of tumor-suppressor genes and activities of transcriptional factors involved in cancer initiation and progression. In the HTLV-1 model of leukemogenesis, HBZ is critical for immune escape and proliferation of ATL cells.27 The possibility of targeting HBZ expression with VPA at therapeutically useful concentrations opens a new avenue of research for the prevention or treatment of HTLV-1–associated diseases.
The publication costs of this article were defrayed in part by page charge payment. Therefore, and solely to indicate this fact, this article is hereby marked “advertisement” in accordance with 18 USC section 1734.
Acknowledgments
The authors thank Dr Bruno Beaumelle for critical reading of the manuscript.
This study was supported by the Agence Nationale de la Recherche, the Contrat de Plan Etat-Région Martinique, and the European Regional Development Fund. G.B. was supported by a grant from the Conseil Régional de la Martinique. J.-M.P. was supported by the Groupements des Entreprises Françaises dans la Lutte contre le Cancer Languedoc–Roussillon.
National Institutes of Health
Authorship
Contribution: G.B. performed experiments and contributed to the experimental design and data interpretation; A.G. performed experiments and contributed to data interpretation and paper writing; A.L. and M.D. contributed to the experimental design; I.K.-S. performed experiments; S.O. and D.S. performed clinical assessment and recruitment of patients; Y.T. provided essential reagents; L.W., J.-M.M., and J.-M.P. contributed to paper writing; and R.C. designed the study, interpreted data, and wrote the paper.
Conflict-of-interest disclosure: The authors declare no competing financial interests.
Correspondence: Raymond Césaire, Laboratoire de Virologie–Immunologie and EA 4537, Centre Hospitalier Universitaire de Fort-de-France, BP 632, 97261 Fort-de-France, Martinique, France; e-mail: raymond.cesaire@chu-fortdefrance.fr.

![Figure 2. HTLV-1–proviral load remained stable throughout ex vivo culture of HTLV-1–infected CD4+ T cells with or without valproate. CD4+ T cells isolated from HTLV-1–infected individuals were cultured without (control [Ctl]) or with 5mM VPA (white and gray boxes, respectively). HTLV-1–proviral load was measured on D0, D1, D2, and D5 for the 20 subjects. Horizontal bars show the bold median and, from bottom to top, the 10th, 25th, 75th, and 90th percentiles.](https://ash.silverchair-cdn.com/ash/content_public/journal/blood/118/9/10.1182_blood-2010-11-321364/4/m_zh89991172660002.jpeg?Expires=1770758857&Signature=tnMiErYmIQsjt7J~bc8PJaj5Y7v6hy8CBCiFxV2QsM6H86ykws1vKdq1kHQbH9biHx4ZlpBM0wd2-RY46KKx1pR7ORgoa4sewC~sVBoSiJjfvzoXr97i5gqqMjGm5FCF35rNPGdc336FotTcEr6lzNRMEr7v9G2xAr5yhYhHx9Ushg1d6YBzJnk9baeIjJ7cWvBp9QziDflQvmc8D9K-bTAIr3YLRPFifwH~RuKgKICtFoquUgDNgqMvKuSLj0FsPMSS806vYDitaA03O0MO9kexdOQj8yKR1yzNPGnfZhgcbULEwA7WVa~8uehpU8Cw9y-G4tK2grqwtFQ4G-ppew__&Key-Pair-Id=APKAIE5G5CRDK6RD3PGA)
This feature is available to Subscribers Only
Sign In or Create an Account Close Modal