

Abstract
Since an association between the human leukocyte antigen (HLA) region and Hodgkin lymphoma (HL) was first reported in 1967, many studies have reported associations between HL risk and both single nucleotide polymorphism (SNP) and classic HLA allele variation in the major histocompatibility complex. However, population stratification and the extent and complexity of linkage disequilibrium within the major histocompatibility complex have hindered efforts to fine-map causal signals. Using SNP data to impute alleles at classic HLA loci, we have conducted an integrated analysis of HL risk within the HLA region in 582 early-onset HL cases and 4736 controls. We confirm that the strongest signal of association comes from an SNP located in the class II region, rs6903608 (odds ratio [OR] = 1.79, P = 6.63 × 10⁻¹⁹), which is unlikely to be driven by association to HLA-DRB, DQA, or DQB alleles. In addition, we identify independent signals at rs2281389 (OR = 1.73, P = 6.31 × 10⁻¹³), a SNP that maps closely to HLA-DPB1, and the class II HLA allele DQA1*02:01 (OR = 0.56, P = 1.51 × 10⁻⁷). These data suggest that multiple independent loci within the HLA class II region contribute to the risk of developing early-onset HL.
Introduction
Hodgkin lymphoma (HL) is a common lymph node cancer of germinal center B-cell origin, which is characterized by malignant Hodgkin and Reed-Sternberg (HRS) cells mixed with a dominant background population of reactive lymphocytes and other inflammatory cells.1 Although Epstein-Barr virus (EBV) infection may be causally related to a number of cases, there is little evidence to support the involvement of other environmental risk factors.2
Evidence for inherited genetic influence on susceptibility is provided by the increased familial risk and high concordance between monozygotic twins.3 Since an association between the human leukocyte antigen (HLA) region and HL risk was first reported in 1967,4 studies have subsequently identified associations between both HLA class I and class II alleles and common HL (cHL) risk.5-10 Studies to date have evaluated only specific HLA alleles and have not taken into account the existence of complex linkage disequilibrium patterns between the multiple risk loci mapping to the major histocompatibility complex (MHC) region, associations between HLA alleles at different resolution, and the need to control rigorously for population stratification. In view of the limitations of these previously published studies, we have conducted a more comprehensive analysis.
It has recently been shown that single nucleotide polymorphism (SNP) data within the 6p21 region can be used to impute alleles at key classic class I (HLA-A, HLA-B, and HLA-C) and class II (HLA-DRB1, HLA-DQA1, and HLA-DQB1) loci with accuracy that exceeds 90% at the 4-digit level.11,12 Using existing genotype data from a previous genome-wide association study of HL, which identified many SNPs within the HLA region that are strongly associated with disease,13 we can therefore assess the relative contribution of classic HLA alleles and SNP variation to HL risk. We identify multiple independent signals across the HLA, the strongest of which is most likely not driven by any of the HLA loci whose types were statistically inferred in this study.
Methods
Samples and genotyping
We analyzed the constitutional DNA of 615 patients diagnosed with HL (International Classification of Diseases 10 codes C81.0-3) who were ascertained through the Royal Marsden Hospitals National Health Service Trust Family History study, between 2004 and 2008 (mean age at diagnosis 38 years, SD 16 years) and an ongoing national study of cHL in females (mean age at diagnosis 23 years, SD 6 years) being conducted by the Institute of Cancer Research to assess late effects of HL treatment. Both routes of patient ascertainment thus favored the acquisition of early-onset HL cases. All cases were British residents and were self-reported to be of European ancestry.
DNA was extracted from samples using conventional methodologies and quantified using PicoGreen (Invitrogen). Genotyping of cHL cases was conducted using Illumina Infinium HD Human610-Quad BeadChips according to the manufacturer's protocols (Illumina). DNA samples with GenCall scores < 0.25 at any locus were considered “no calls.” A SNP was deemed to have failed if < 95% of DNA samples generated a genotype at the locus. Cluster plots were manually inspected for all SNPs identified as potentially associated. Publicly available data from the Wellcome Trust Case-Control Consortium 2 study were used as controls. Specifically, this included 2420 persons from the 1958 Birth Cohort (58BC, also known as the National Child Development Study)14 and 2737 from the National Blood Service Collection (NBS), all of which had been genotyped on Illumina 1.2M arrays at the Wellcome Trust Sanger Institute. To ensure quality of genotyping in all assays, at least 2 negative controls and 1% to 2% duplicates (showing a concordance > 99.99%) were genotyped.
Collection of blood samples and clinicopathologic information from subjects was undertaken with informed consent and relevant ethical review board approval from the University of Oxford and the Institute of Cancer Research in accordance with the tenets of the Declaration of Helsinki.
Quality control
For any samples showing a high degree of relatedness, we removed the sample with the lower call rate from the analysis, following previously described protocols.13 This obviates the need to adjust for familial correlations and ensuring that unbiased estimates of HL risk associated with genotypes are derived. We excluded SNPs on the basis of deviation from Hardy-Weinberg equilibrium using a threshold of P < 1.0 × 10⁻⁵ in controls. We also removed SNPs with minor allele frequency < 0.05 and call rate < 0.95.13 To identify and exclude persons with non-Western European ancestry, case and control data were merged with data on persons of different ethnicities from the International HapMap Project, and dissimilarity measures were used to perform principal component analysis (supplemental Figure 1, available on the Blood Web site; see the Supplemental Materials link at the top of the online article). For the control samples, we also followed the guidelines from the Wellcome Trust Case-Control Consortium and removed some additional controls.13 After imposing these stringent quality control measures, SNP genotypes were available on 582 cases and 4736 controls (2235 58C and 2501 NBS).
Statistical and bioinformatics analysis
For single SNP analyses, we considered the MHC to be defined by a 4.5-Mb region bordered by the RFP and MLN genes (rs209130 at 28 975 779 bp and rs1547668 at 33 883 424 bp, respectively) at the telomeric and centromeric ends of 6p21, respectively. For the HLA imputation, we made use of genome-wide association study SNP data for an extended region in 6p21 bounded by rs1165196 and rs2772372 (25 921 129 and 33 535 328 bp, respectively). All positions are with respect to build 36 of the Human Genome.
Analyses were primarily undertaken using R, Version 2 software. Initially, we analyzed the association between each SNP and the risk of HL using the Cochran-Armitage trend test. Odds ratios and associated 95% confidence intervals were calculated by unconditional logistic regression. We then conducted stepwise logistic regression analyses to interrogate the region for independent secondary signals.
From a reference database of SNP haplotypes carrying known HLA alleles, we imputed HLA genotypes for the cHL cases, the NBS controls, and the subset of the 58BC samples, for which classic HLA data were not available, as previously described.11,12 The reference database combines classic HLA data from the HapMap Project and the 58BC. Details of quality control have been previously described.12 Imputation was performed for 3 class I and 3 class II loci: HLA-A (n = 2474 reference samples), HLA-B (n = 3090), HLA-C (n = 2022), HLA-DQA1 (n = 175), HLA-DQB1 (n = 2629), and HLA-DRB1 (n = 2665). Imputation accuracy was assessed through a cross-validation analysis of the training data. Training was performed on two-thirds of the reference panel and tested on the remaining third at the SNPs chosen for imputation in the current study. Thresholding calls at a posterior probability of 0.7 provided call rates of between 0.90 (HLA-DRB1) and 0.99 (HLA-C) and accuracy of > 0.95 for all loci at the 2-digit level and between 0.91 (HLA-DQA1) and 0.98 (HLA-DQB1) at the 4-digit level.
The familial relative risk of HL attributable to any locus is given by the formula15 :
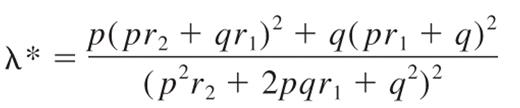
where p is the population frequency of the minor allele, q = 1 − p, and r1 and r2 are the relative risks (approximated by the odds ratios) for heterozygotes and the rarer homozygotes, relative to the more common homozygotes. From λ*, it is possible to quantify the impact the locus makes to the overall familial risk of HL seen in first-degree relatives. Assuming a multiplicative interaction between risk alleles, the proportion of the overall familial risk attributable to the locus is given by log(λ*)/log(λ0), where λ0, the overall familial risk, is assumed on the basis of epidemiologic studies to be 3.93.16
To examine whether any directly typed or imputed SNPs annotate potential regulatory sequences within the 13.8-kb region of linkage disequilibrium (LD) encompassing the SNP rs6903608 (which had the highest signal of association), we performed in silico searches using Transfac Matrix Database Version 7.2,17 PReMod Version 1.0,18 and EEL19 software.
Results
We examined samples from 615 cases and 5157 controls and subjected these to rigorous quality control as described in “Statistical and bioinformatics analysis.” Furthermore, we evaluated the datasets for ancestral differences by principal component analysis. After quality control, data were available on 582 cases and 4736 controls. Supplemental Figure 1 shows that the cases and controls were ancestrally comparable.
To assess the relationship between specific HLA alleles and HL, we imputed key class I and II HLA alleles at 2- and 4-digit resolutions, using the algorithms described earlier.11,12 Comparison between observed and imputed HLA alleles for a subset of controls, for which we had experimentally determined HLA types, showed a high degree of concordance (> 90% at the 4-digit level; see “Statistical and bioformatics analysis”). For each person and locus, the imputation methodology returns probabilities associated with the sample having each allelic type; these probabilities have been shown to be reasonably well calibrated.11 Thus, we were able to incorporate these probabilities into the general logistic regression framework, to account for any uncertainty associated with imputed types.
We initially considered 1700 SNPs mapping to the 4.5-Mb region that encompasses the classic MHC region at 6p21.3. Figure 1 shows the strength of the single SNP associations across this region. A total of 25 SNPs showed evidence for an association with HL risk at P < 10−7, most mapping to HLA class II regions. The strongest single-SNP based association was attained for rs6903608 mapping at 32 536 263 bp, about 16 kb centromeric to HLA-DRA (P = 6.63 × 10⁻¹⁹; Figure 1A; supplemental Table 1).

Associations in the MHC region and conditional logistic regression analysis. Plots of the evidence for association between the HLA and cHL, as covariates, are added to the model in a stepwise manner. (A-D) The horizontal axis indicates the location of each SNP along chromosome 6, and the vertical axis, the −log10P values of each SNP (blue) and HLA allele (red), obtained using logistic regression models with different numbers of covariates. (A) Evidence for association obtained from the 1-parameter logistic regression analysis. (B) The remaining signal when rs6903608 is included as a covariate. (C) The signal when rs2281389 is also included in the model. (D) The remaining signal when DQA1*02:01 is also added as a covariate. Multiple red dots on the same locus indicate the −log10P values for different allelic subtypes at the respective locus. The positions of common HLA loci have been marked with vertical dashed lines and annotated accordingly. Note that some loci (DRA1, DPB1) for which imputation results were not available have also been marked in the figure. For all loci, the vertical lines indicate the mean position of the longest transcript. The yellow horizontal line indicates the commonly used 5 × 10⁻⁸ threshold for genome-wide significance.
Associations in the MHC region and conditional logistic regression analysis. Plots of the evidence for association between the HLA and cHL, as covariates, are added to the model in a stepwise manner. (A-D) The horizontal axis indicates the location of each SNP along chromosome 6, and the vertical axis, the −log10P values of each SNP (blue) and HLA allele (red), obtained using logistic regression models with different numbers of covariates. (A) Evidence for association obtained from the 1-parameter logistic regression analysis. (B) The remaining signal when rs6903608 is included as a covariate. (C) The signal when rs2281389 is also included in the model. (D) The remaining signal when DQA1*02:01 is also added as a covariate. Multiple red dots on the same locus indicate the −log10P values for different allelic subtypes at the respective locus. The positions of common HLA loci have been marked with vertical dashed lines and annotated accordingly. Note that some loci (DRA1, DPB1) for which imputation results were not available have also been marked in the figure. For all loci, the vertical lines indicate the mean position of the longest transcript. The yellow horizontal line indicates the commonly used 5 × 10⁻⁸ threshold for genome-wide significance.
Five HLA class II alleles showed evidence of association with HL risk at the 1 × 10⁻⁷ threshold in the unconditional logistic regression analysis, namely, DQA1*02:01, DRB1*07:01, DQB1*03:03, DRB1*15:01, and DQB1*06:02 (supplemental Table 1). The associations at DQA1*02:01, DRB1*07:01, and DQB1*03:03 confer an increased risk of HL, whereas the associations at DRB1*15:01 and DQB1*06:02 confer a reduced risk. Some of these alleles, such as DRB1*15:01 and DQB1*06:02, are known to be in strong LD in European populations. The strongest association was provided by DQA1*02:01 (odds ratio [OR] = 0.45, P = 6.17 × 10⁻¹⁵). Of the class I HLA alleles, the strongest association observed was for B*07:02, although it did not reach genome-wide significance (supplemental Table 1; OR = 1.39, P = 4.40 × 10⁻⁵).
To evaluate the independence of associations, we conducted stepwise logistic regression, jointly on SNPs and imputed HLA alleles, initially including rs6903608 as a covariate in our model. Conditional analysis showed that most, but not all, of the class II variation defined by the SNP genotype could be explained for by rs6903608 (Figure 1B; supplemental Table 2). The strongest secondary signal appeared to be for SNPs rs9277565 (OR = 1.70, P = 4.57 × 10⁻¹³) and rs2281389 (OR = 1.73, P = 6.31 × 10⁻¹³), which map closely to HLA-DPB1 and one of which, rs9277565, has previously been shown to be in LD (r2 = 0.37) with HLA-DPB1*03:01.20 Note that classic alleles at HLA-DPB1 were not imputed here because of lack of training data. Inclusion of rs2281389 in the logistic model accounted for most of the remaining signal (Figure 1C; supplemental Table 3), except for the protective effect of HLA-DQA1*02:01 (OR = 0.56, P = 1.51 × 10⁻⁷). DQA1*02:01 is nearly perfectly correlated with DRB1*07:01, and it is unclear which of the 2 alleles drives the observed signal; here for simplicity, we only refer to DQA1*02:01. When rs6903608, rs2281389, and DQA1*02:01 were all included as covariates to the model, no additional loci showed genome-wide evidence for association (Figure 1D; supplemental Table 4).
Although genetic variation defined by rs6903608 provides the strongest association signal, collectively these data provide evidence for 2 additional independent disease loci, defined by rs2281389 and HLA-DQA1*02:01 (Figure 1; supplemental Tables 2-3). rs2281389 lies in close proximity to HLA-DPB1, variation in which has been associated with HL risk in a number of previously published studies,5,21 with DPB1*03:01 appearing to confer susceptibility (OR = 1.42) and DPB1*02:01 resistance (OR = 0.49) to HL.21
Discussion
To examine the relationship between HLA and the risk of developing HL, we have conducted a large case-control study and have systematically examined the relationship between genetic variants and HL risk for the entire 4.5-Mb 6p21.3 region that encodes the MHC.
Using genome-wide association SNP data in principal components analysis has allowed us to minimize the potential problem of population stratification as formal statistical analysis provided no significant evidence that population substructure is a confounding factor in our study. The large dataset and dense set of informative markers in our study have also made possible the detection of independent effects at class II loci. Imputation of HLA alleles from SNP data has allowed us to also analyze systematically the relationship between HLA types and HL risk, at both the 2- and 4- digit levels of significance.
Our study provides unequivocal evidence for an association between the MHC and risk of developing HL. Moreover, and specifically, it provides evidence of a relationship between HLA class II genotypes and HL risk. Although we acknowledge that we did not impute all of the HLA alleles, the analysis we have conducted on a dense set of single SNPs in the region will have been sufficient to recover strong associations at untyped loci. Moreover, our imputations cover the alleles carried by 97.4% of the European population, according to dbMHC (averaged across all loci for which imputations are made). Our analysis found no evidence that class I variation also contributes to disease development, as the signals from the class I region were of moderate significance (P > 10−5) and disappeared in the conditional analysis.
Although our study represents the most comprehensive interrogation of the relationship between genetic variation in MHC and HL risk to date, the analysis has limitations. A hallmark of HL epidemiology is a bimodal age-specific incidence, and it has been argued that the disease in young and older adults is etiologically different22 ; in particular, the prevalence of EBV in tumors is higher in older HL patients (∼ 50% age ≥ 40 years compared with ∼ 30% age < 40 years).23 HLA class I polymorphisms have been reported to be associated with development of infectious mononucleosis on primary EBV infection,24 and HLA-A*02 and HLA*01 alleles have been linked to the risk of developing EBV-positive HL.10 Such observations are in keeping with predominant class I restricted T-cell response to EBV infection. The majority of HL cases we have studied were young (93% age < 35 years at diagnosis); hence, our findings are more likely to apply to EBV-negative HL. This suggestion is reinforced by the lack of association between HLA-A*02 or HLA-A*01 alleles and HL in the current study (P > .05). Our results therefore suggest, albeit individually, substantially different genetic contributions to the risk of EBV-positive and EBV-negative HL within the MHC.
The neoplastic multinuclear HRS cells that typify cHL are derived from germinal center B cells that express HLA class II antigens.1 Several observations suggest that antigen presentation is involved in the pathobiology of HL. HRS cells stimulate T-cell proliferation in mixed lymphocyte reactions and induce cytotoxic activity.25,26 Lack of membranous expression of HLA class II by HRS cells of HL is common at primary diagnosis and is associated with extranodal disease, lack of EBV in HRS cells, and absence of HLA class I expression.27-30 Expression of HLA class II by HRS cells is retained more frequently in EBV-associated cHL, and in HLA class I–positive HRS cells.27-30 Hence, a possible explanation for the association of HLA class II expression status might be that HLA class II directly activates T-helper 1 cells, thereby inducing and maintaining cytotoxic antitumor immune responses. Lack of HLA class II expression results in diminished activation of T-helper 2 and/or Treg cells. Therefore, the class II associations we identified may reflect differential binding affinity of the HLA class II molecule with immunogenetic antigenic peptides modifying class II down-regulation. This postulate is in keeping with class II variation being primarily associated with development of EBV-negative HL, something fully supported by our findings of strong class II associations.
The strongest association identified in our study was attained with rs6903608. Inherited susceptibility to HL is likely to be mediated through the coinheritance of multiple risk alleles. Under a multiplicative model of interaction between risk loci on the basis of the risks associated with heterozygosity and homozygosity for the C-risk allele of rs6903608 (supplemental Table 1), this variant accounts for approximately 6% of the increased risk of HL seen in first-degree relatives of patients. rs6903608 maps to an LD block of 13.8 kb from 32 503 014 to 32 516 820 bp on chromosome 6. In silico analysis of this region using EEL,19 PreMod,18 and Transfac17 software provided no evidence that the SNP is directly functional in terms of impacting on a regulatory sequence. As rs6903608 localizes within 16 kb of HLA-DRA, it is possible that the SNP tags this locus. Unfortunately, because of the lack of training data, we were not able to impute alleles at this locus and thus examine this possibility. Nonetheless, our analysis of the joint SNP and imputed HLA dataset indicates that none of the classic class I HLA alleles or class II genes HLA-DRB, HLA-DQA, HLA-DQB are likely to be driving this association.
In conclusion, our analysis provides unequivocal evidence that MHC variation is a major determinant of HL risk and specifically implicates class II variation at multiple loci in disease etiology. Given that our analysis is based on a high proportion of early-onset HL cases, further studies will allow the generalizability of our findings to all forms of HL to be addressed.
The online version of this article contains a data supplement.
The publication costs of this article were defrayed in part by page charge payment. Therefore, and solely to indicate this fact, this article is hereby marked “advertisement” in accordance with 18 USC section 1734.
Acknowledgments
The authors thank the patients and their clinicians who participated in this collection.
This work was supported by the Leukemia and Lymphoma Research (United Kingdom), Cancer Research United Kingdom (C1298/A8362, supported by the Bobby Moore Fund), and the Wellcome Trust (awards 076113 and 085475). Sample and data acquisition was supported by Breakthrough Breast Cancer and the European Union. National Health Service funding was provided to the National Institute for Health Research Biomedical Research Center. This study made use of control genotyping data generated by the Wellcome Trust Case-Control Consortium. Genotype data were from the British 1958 Birth Cohort DNA collection (supported by the Medical Research Council grant G0000934 and the Wellcome Trust grant 068545/Z/02).
Authorship
Contribution: L.M., V.E.-M., Y.P.M., S.L., A.D., and A.S. performed statistical and bioinformatic analyses; P.B. oversaw sample coordination and laboratory analyses; A.J.S., A.A., and R.C. provided samples and data from a study conducted at the Institute of Cancer Research; R.S.H., G.M., V.E.-M., and L.M. drafted the manuscript; and R.S.H. designed the study and obtained funding for the parent project.
Conflict-of-interest disclosure: The authors declare no competing financial interests.
A complete list of the investigators who contributed to the generation of the data is available at www.wtccc.org.uk.
Correspondence: Richard S. Houlston, Section of Cancer Genetics, Institute of Cancer Research, Sutton, Surrey, SM2 5NG, United Kingdom; e-mail: richard.houlston@icr.ac.uk.
