Abstract
Abstract 2658
Peripheral T-cell lymphomas (PTCL) carry a poorer prognosis compared to their B-cell counterparts and the molecular pathogenesis of PTCL is still largely unknown. The aims of this study are to characterize the molecular signatures and identify signaling pathways involved in the different subsets of PTCL and NKTCL.
Materials and Methods: RNA was extracted from tumors of 60 patients with newly diagnosed PTCL and NKTCL: 21 with angioimmunoblastic T-cell lymphoma (AITL), 12 anaplastic large-cell lymphoma (ALCL), 15 peripheral T-cell lymphoma not-otherwise-specified (PTCL-NOS) and 12 with natural-killer T-cell lymphoma (NKTCL). Comparisons were made using published gene expression data files of normal T and NK T-cells. Gene expression profiling was performed using the Affymetrix HG-U133 Plus 2.0 GeneChip platform.
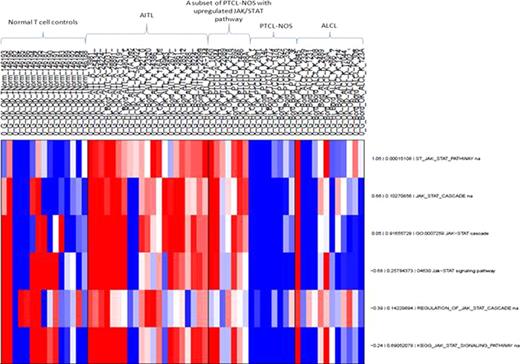
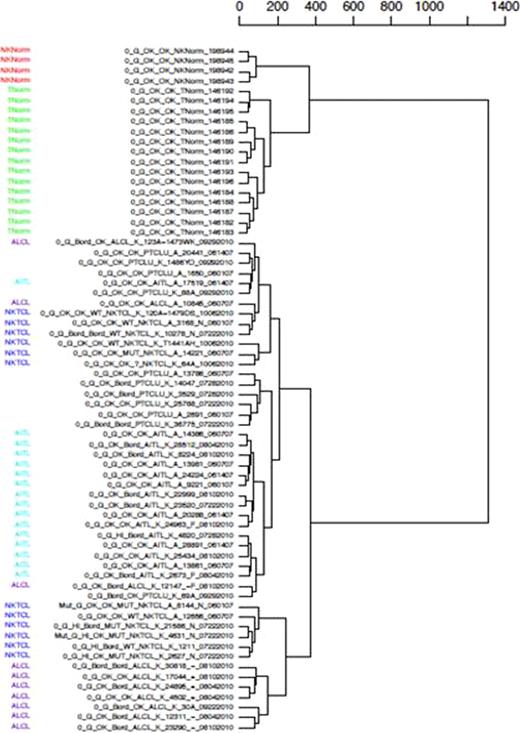
The Affymetrix expression profiling distinguishes the 48 PTCL samples from normal T-cell controls (p<0.005). Similarly, the molecular signature of 12 NKTCL significantly differs from normal NK cells. The JAK/STAT pathway is significantly upregulated in AITL and a subset of PTCL-NOS compared to normal T cells and ALCL (p<0.005). [Figure 1] Pathways related to NFκB significantly distinguish PTCL from normal T-cells and it also distinguishes NKTCL from normal NK T-cells. Unsupervised hierarchical clustering by gene expression profiles is able to separate the subsets of PTCL (AILT, ALCL, NKTCL) in concordance with their immmunohistochemical diagnosis. PTCL-NOS however, are dispersed across the clusters reflecting its molecular heterogeneity. [Figure 2]
Gene expression profiling identifies distinct molecular pathways in PTCL. In particular, the JAK-STAT pathway is upregulated in AITL and the NFκB pathway is dysregulated in PTCL and NKCL. Our results suggest that targeting the key kinases in these pathways may be effective in the treatment for this subset of lymphomas with poor prognosis.
JAK/STAT pathway is upregulated in AITL and a subset of PTCL-NOS. Each row corresponds to a different pathway with the first number indicating the fold change value and the second number indicating the p values. According to the log2 colour scale, red indicates a high level of mRNA expression compared to the median value of a given gene while blue indicates a low value. Highlighted in yellow is the specific JAK/STAT pathway upregulated with a p value <0.05.
JAK/STAT pathway is upregulated in AITL and a subset of PTCL-NOS. Each row corresponds to a different pathway with the first number indicating the fold change value and the second number indicating the p values. According to the log2 colour scale, red indicates a high level of mRNA expression compared to the median value of a given gene while blue indicates a low value. Highlighted in yellow is the specific JAK/STAT pathway upregulated with a p value <0.05.
Unsupervised hierarchical clustering is able to distinguish NKTCL, AITL and ALCL quite well. Normal T and NK T-cells used as controls are reflected in the dendrogram and PTCL-NOS (unlabelled rows) are dispersed across the clusters.
Unsupervised hierarchical clustering is able to distinguish NKTCL, AITL and ALCL quite well. Normal T and NK T-cells used as controls are reflected in the dendrogram and PTCL-NOS (unlabelled rows) are dispersed across the clusters.
Tan:Janssen: Honoraria, Research Funding; Celgene: Honoraria; Novartis: Research Funding.
Author notes
Asterisk with author names denotes non-ASH members.


This feature is available to Subscribers Only
Sign In or Create an Account Close Modal