Abstract
Abstract 1768
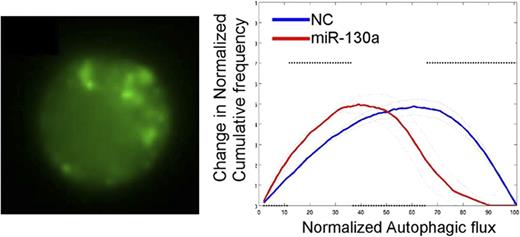
B-cell chronic lymphocytic leukemia (CLL) is characterized by deregulated expression of microRNAs (miRNAs). These post-transcriptional regulators of gene expression play a crucial role in controlling multiple cellular processes. By microarray analysis and quantitative RT-PCR we observed significantly lower levels of miR-126, miR-130a, miR-143, miR-181a and miR-326 in primary CLL cells compared to normal B cells. Transfection of synthetic miR-130a or miR-143 induced a significant reduction in cell viability of both primary CLL cells and the CLL cell line MEC-1. As autophagy is connected to cancer cell survival and resistance to apoptosis, we investigated the effect of these two miRNAs on autophagy by following the specific autophagosome marker LC3 (microtubule-associated protein 1 light chain 3). Therefore, we generated MEC-1 cells stably expressing GFP-tagged LC3 and analyzed autophagosome formation by using an imaging flow cytometer quantifying GFP-positive dots. These experiments revealed that autophagy is induced in these cells upon starvation, and that introduction of miR-130a, but not miR-143, resulted in a reduction of autophagosome formation (see Figure). These findings were verified by LC3 Western blot analysis, and extended to primary CLL cells, showing for the first time that autophagy is an active process in these cells and that miR-130a inhibits autophagy in primary CLL cells as well. To further elucidate the molecular mechanism of miR-130a-mediated CLL cell survival and autophagy, we aimed at identifying putative target genes of this miRNA and identified ATG2B, an autophagy-related gene, as well as DICER1 and AGO4, two components of the miRNA processing machinery, as direct target genes of miR-130a in CLL cells. The relevance and role of these three novel target genes in miR-130a-regulated cell death/cell survival programs is under current investigation.
Analysis of autophagy using MEC-1 cell line stably expressing GFP-tagged LC3 protein. Green dots representing autophagosomes were quantified in MEC-1/GFP-LC3 cells under starvation by imaging flow cytometry (Image Stream, Amnis). Transfection with synthetic miR-130a reduced the autophagic flux in these cells compared to scrambled negative control miRNA (NC).
Analysis of autophagy using MEC-1 cell line stably expressing GFP-tagged LC3 protein. Green dots representing autophagosomes were quantified in MEC-1/GFP-LC3 cells under starvation by imaging flow cytometry (Image Stream, Amnis). Transfection with synthetic miR-130a reduced the autophagic flux in these cells compared to scrambled negative control miRNA (NC).
No relevant conflicts of interest to declare.
Author notes
Asterisk with author names denotes non-ASH members.


This feature is available to Subscribers Only
Sign In or Create an Account Close Modal