Abstract
Abstract 1494
The prognosis of pts with acute myeloid leukemia (AML) is poor, particularly for those over the age of 60 (AML>60) as they frequently present with comorbidities, and AML secondary to an antecedent hematologic disease (typically MDS), worse performance status and unfavorable karyotypes compared with their younger counterparts. Complete remission (CR) rates amongst pts with AML>60 treated with a standard combination of cytarabine and an anthracycline (e.g. 7+3) are 35%–50% but the induction chemotherapy-related mortality is very high (30%) and the median survival is only 5–6 months. Epigenetic therapy (decitabine, azacitabine, histone deacetylase inhibitors) have emerged as attractive therapeutic options for AML>60. We investigated the impact of these agents on the survival of pts with AML>60 compared to that of standard chemotherapy.
We analyzed 779 pts with newly diagnosed AML>60 treated with chemotherapy and 130 treated with epigenetic therapy treated at our institution between 2000 and 2010. Of the 130 pts receiving epigenetic therapy, 78 received decitabine-based therapy and 52 azacitidine-based therapy. Of the 779 pts receiving chemotherapy, 74% received AI (ara-C 1.5g/m2x3d and idarubicin 12mg/m2x3d) or AI-based chemotherapy. Baseline characteristics for pts treated with chemotherapy vs epigenetic were: median age (69 vs 72 yrs; p=0.000039), performance status 0–2 (n=124; 95% vs 95%, p=0.8), WBC (5.7×10⁹/dL vs 3.2×10⁹/dL; p=0.00004), Hg (8.2g/dL vs 8.7g/dL; p=0.0004), platelets (49×109/dL vs 55×109/dL; p=0.1), BM blasts (43% vs 35%; p=0.0001), PB blasts (14 vs 6.5; p=0.0006), poor cytogenetics (25% vs 32%; p=0.13).
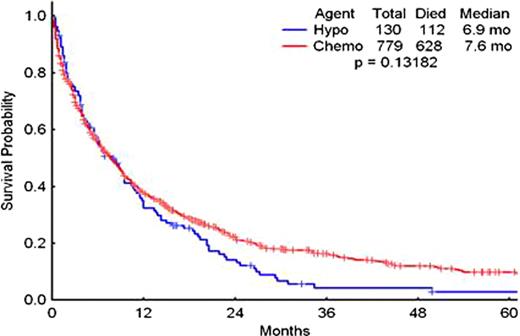
The CR rates for pts treated with chemotherapy and epigenetic therapy were 47% and 28%, respectively (p=0.0001). The overall response rate (ORR) for both groups (CR+CRp) was 53% and 29% (p=0.0001). The proportion of pts not responding to chemotherapy or epigenetic therapy was similar (i.e. no CR or CRp, 47% vs 68%, p=0.0001). The early mortality (mortality within the first 8 wks of therapy) for both groups was 16% and 8%, respectively (p=0.029). Azacitidine has been recently shown to prolong the survival of patients with myelodysplastic syndrome (MDS) when compared to standard therapy. However, the median overall survival (OS) for pts with AML>60 treated with chemotherapy or epigenetic therapy was not significantly different (7.6mo vs 6.9mo, p=0.13). When the analysis was limited to pts with unfavorable cytogenetics (−5, −7, complex), the CR for patients treated with chemotherapy or epigenetic therapy was 31% vs 36% (p=0.06) while the median overall survival for both groups was 17wks vs 22 wks (p=0.03). The corresponding figures for patients with diploid cytogenetics were 58% vs 31% (p=0.0001) and 50wks vs 37 wks (p=0.09). Similarly, the OS for pts in both groups who carried mutations in the FLT3 gene were 30wks vs 37 wks (p=0.7). We next investigated potential differences between different epigenetic therapies. The CR rate (27% vs 30%, p=0.6) and OS (38wks vs 25wks, p=0.07) for pts treated with decitabine/decitabine-based therapy or azacitidine/azacitidine-based therapy were not significantly different.
The administration of standard chemotherapy to pts with AML>60 is associated with low CR rates, high early mortality rates, and a low probability of long-term survival. Despite prolonging survival in pts with MDS, the use of epigenetic therapy in pts with AML>60 is not associated with significant improvements in long-term outcomes compared with standard chemotherapy.
Outcomes of patients with AML>60 treated with chemotherapy or epigenetic therapy
| Therapy . | Decitabine . | Azacitidine . | Overall epigenetic therapy . | Chemotherapy . | P value . | ||||
|---|---|---|---|---|---|---|---|---|---|
| . | No. . | % . | No. . | % . | No. . | % . | No. . | % . | . |
| Response Rate | |||||||||
| CR | 22 | 27 | 14 | 30 | 36 | 28 | 364 | 47 | 0.0001 |
| CRp | 1 | 1 | 0 | 0 | 1 | 1 | 43 | 6 | |
| ED | 14 | 17 | 7 | 15 | 21 | 16 | 130 | 17 | |
| NR | 44 | 53 | 24 | 51 | 66 | 54 | 242 | 31 | |
| Total | 81 | 45 | |||||||
| Median OS (Weeks) | 38 | 25 | 28 | 30 | 0.13182 | ||||
| 2-year | 17% | 9% | 14% | 22% | |||||
| 5-year | 3% | 2% | 3% | 10% | |||||
Overall survival of patients treated with standard AML chemotherapy (Chemo) and of those treated with epigenetic therapy (Hypo)
Overall survival of patients treated with standard AML chemotherapy (Chemo) and of those treated with epigenetic therapy (Hypo)
No relevant conflicts of interest to declare.
Author notes
Asterisk with author names denotes non-ASH members.


This feature is available to Subscribers Only
Sign In or Create an Account Close Modal