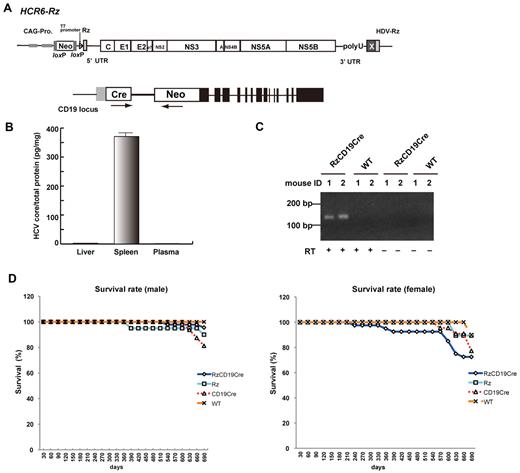
On page 4928 of the 2 December 2010 issue, the columns are misaligned in the graph in Figure 1B. The corrected Figure 1 is shown.
Establishment of RzCD19Cre mice. (A) Schematic diagram of the transgene structure comprising the complete HCV genome (HCR6-Rz). HCV genome expression was regulated by the Cre/loxP expression cassette (top diagram). The Cre transgene was located in the CD19 locus (bottom diagram). (B) Expression of HCV core protein in the liver, spleen, and plasma of RzCD19Cre mice was quantified by core ELISA. Data represent the mean ± SD (n = 3). (C) Detection of HCV RNA in PBLs by RT-PCR. Samples that included the RT reaction are indicated by +, and those that did not include the RT reaction are indicated by −. (D) Survival rates of male and female RzCD19Cre mice (males, n = 45; females, n = 40), Rz mice (males, n = 20; females, n = 19), CD19Cre mice (males, n = 16; females, n = 22), and WT mice (males, n = 5; females, n = 10).
Establishment of RzCD19Cre mice. (A) Schematic diagram of the transgene structure comprising the complete HCV genome (HCR6-Rz). HCV genome expression was regulated by the Cre/loxP expression cassette (top diagram). The Cre transgene was located in the CD19 locus (bottom diagram). (B) Expression of HCV core protein in the liver, spleen, and plasma of RzCD19Cre mice was quantified by core ELISA. Data represent the mean ± SD (n = 3). (C) Detection of HCV RNA in PBLs by RT-PCR. Samples that included the RT reaction are indicated by +, and those that did not include the RT reaction are indicated by −. (D) Survival rates of male and female RzCD19Cre mice (males, n = 45; females, n = 40), Rz mice (males, n = 20; females, n = 19), CD19Cre mice (males, n = 16; females, n = 22), and WT mice (males, n = 5; females, n = 10).


This feature is available to Subscribers Only
Sign In or Create an Account Close Modal