

Abstract
A challenge for gene therapy of genetic diseases is to maintain corrected cell populations in subjects undergoing transplantation in cases in which the corrected cells do not have intrinsic selective advantage over nontransduced cells. For inherited hematopoietic disorders, limitations include inefficient transduction of stem cell pools, the requirement for toxic myelosuppression, and a lack of optimal methods for cell selection after transduction. Here, we have designed a lentiviral vector that encodes human β-globin and a truncated erythropoietin receptor, both under erythroid-specific transcriptional control. This truncated receptor confers enhanced sensitivity to erythropoietin and a benign course in human carriers. Transplantation of marrow transduced with the vector into syngenic thalassemic mice, which have elevated plasma erythropoietin levels, resulted in long-term correction of the disease even at low ratios of transduced/untransduced cells. Amplification of the red over the white blood cell lineages was self-controlled and averaged ∼ 100-fold instead of ∼ 5-fold for β-globin expression alone. There was no detectable amplification of white blood cells or alteration of hematopoietic homeostasis. Notwithstanding legitimate safety concerns in the context of randomly integrating vectors, this approach may prove especially valuable in combination with targeted integration or in situ homologous recombination/repair and may lower the required level of pretransplantation myelosuppression.
Introduction
Recent progress in the field of hematopoietic gene therapy has raised the hope that patients afflicted with β-thalassemia and sickle cell anemia will benefit from these novel therapeutic approaches. Transplantation of hematopoietic cells (HCs) modified with lentiviral vectors carrying the β-globin gene has resulted in long-term correction of several mouse models of hemoglobin disorders1-4 and very recently led to transfusion independency in a β-thalassemic patient.5 Although the main advantages of infusing genetically modified autologous cells are to avoid the risks of GVHD and immunosuppressive pretransplant conditioning as well as to address the lack of compatible donors, a drawback is the requirement for toxic myeloablation.6 In addition, current gene transfer methods are unable to transduce more than a fraction of hematopoietic stem cells (HSCs),7 and the various in vivo selection strategies available suffer from suboptimal efficacy and safety.8-10
Therapeutic and stable mixed chimerism has been observed in a few β-thalassemic patients treated by allogeneic marrow transplantation from HLA-identical relatives. A 20%-30% degree of hematopoiesis of donor origin increased the hemoglobin (Hb) level high enough to avoid RBC transfusions,11 consistent with the preferential survival of normal erythroid cells as opposed to the high apoptotic rate of erythroid precursors and RBC hemolysis in β-thalassemia.12 In murine models, a 10%-20% proportion of normal donor cells resulted in significant improvement of anemia.13 As a consequence, reversion of the thalassemia phenotype despite relatively low levels of corrected HCs is not out of reach by ex vivo gene therapy with autologous transplantation.
Nevertheless, expansion of HCs appears unavoidable in a minimally myeloablative setting. In mice, a very high dose of bone marrow cells (> 20 × 106) had to be injected into β-thalassemic recipients given 200 rads irradiation to achieve stable engraftment and phenotypic improvement.14 Ex vivo HSC expansion is thus appealing. However, cytokine-expanded marrow cells have a defective long-term repopulating capability in irradiated15 as well as nonmyeloablated mouse recipients,16 leading to low-level engraftment of retroviral transduced cells in mice and patients in the absence of a pretransplantation conditioning regimen.6,17 An alternative approach is to confer a benign proliferative advantage to the modified cells over the nontransduced cells in vivo.
Here, we sought to increase the proportion of corrected erythroid cells in a murine model of β-thalassemia by coexpressing a truncated form of the erythropoietin receptor (tEpoR) together with a therapeutic β-globin chain by a lentiviral vector. In humans, tEpoR causes primary familial and congenital polycythemia (PFCP), a benign, autosomal-dominant erythrocytosis. PFCP is characterized by an increased erythrocyte mass, which remains stable over time, the absence of splenomegaly, normal white blood cell (WBC) and platelet counts, generally low serum erythropoietin levels, the absence of bleeding or thrombotic complications, hypersensitivity of erythroid progenitors to erythropoietin in vitro, and no progression to acute leukemias or myelodysplastic syndromes.18-21 In mice, on ubiquitous expression of wild-type EpoR, the lineage commitment of pluripotent hematopoietic progenitors is not biased,22,23 and pluripotent progenitor proliferation remains limited.24 The tEpoR cDNA has been used in mouse transplant experiments to induce the expansion of transduced mouse HSCs and SCID-repopulating cells in partially myeloablated recipients.25,26
We reasoned that the naturally elevated erythropoietin plasma levels observed in β-thalassemia will provide a favorable environment to trigger selective cell expansion resulting from tEpoR expression. We show here that erythroid-specific coexpression of human β-globin and tEpoR in thalassemic mice from lentivirally transduced HSCs results in a major, yet self-controlled and homeostatic, cell expansion restricted to the erythroid lineage. Accordingly, disease correction was achieved in all thalassemic mice that underwent transplantation even as a result of purposely minimal transduction efficiency.
Methods
Cell culture, transduction, and BM cell transplantation
Vectors and production methods are described in supplemental Methods (available on the Blood Web site; see the Supplemental Materials link at the top of the online article). HSCs, hereafter called 5-fluorouracil (5-FU) cells, were obtained from BM cells of male donors injected 4 days previously with 150 mg/kg 5-FU (Sigma-Aldrich) and submitted to Lympholyte-M density gradient purification (Cedarlane). Alternatively, stem cells were purified from male BM by sorting CD105+ Sca1+ cells with the use of magnetic beads (Miltenyi Biotec). Medullar lymphomyeloid and erythroid cells were purified on the basis of the presence or absence of the CD45 antigen with magnetic beads (Miltenyi Biotec). Purity was checked by cytometry with antibodies against CD45 and Ter119 antigens. All mouse experiments were approved by the local committee of the Hematology Institute of the Saint-Louis Hospital.
Before transduction, all cells were washed and suspended at a final concentration of 1-2 × 10⁶/mL in alpha-MEM medium (Invitrogen) containing 15% FCS, 100 ng/mL recombinant mouse stem cell factor, 6.25 ng/mL interleukin-3, and 10 ng/mL interleukin-6 and grown at 37°C. All cytokines were from Peprotech. rhEpo (3 U/mL; Roche Pharma) was added in erythroid cell culture.
Transduction of 5-FU cells with gammaretroviral vectors (γRV) started 40 hours later. Cells were exposed twice, 24 hours apart, to undiluted retroviral supernatants on Retronectin (Takara)-coated Petri dishes in alpha-MEM medium containing 8 μg/mL protamine sulfate (Sigma-Aldrich), decomplemented serum, and cytokines as described previously. Two days after transduction, percentages of enhanced green fluorescent protein-(eGFP)–positive cells (24%-32% as determined by flow cytometry and unchanged 4 days later) were set to 10% with mock transduced cells. Four million cells (including 4 × 10⁵ eGFP-expressing cells) were injected intravenously in lethally irradiated β-thalassemic female mice Hbbth-1/th-1.27 In this experiment, MOI was 1 (twice). β-thalassemic recipients received 1100 rads (split dose of 550 rads over 3 hours) of total body irradiation.
Concerning lentiviral vectors, transduction started 16 hours after cell isolation. 5-FU cells were exposed to vectors on Retronectin-coated Petri dishes in StemPro-34 serum-free medium (Invitrogen) supplemented with protamine sulfate and cytokines. Six hours later, cells were harvested by the use of trypsin-EDTA solution (Cambrex BioScience) and a cell scraper. A total of 500 000-750 000 transduced 5-FU cells were injected intravenously into each β-thalassemic female recipient given total body irradiation. In experiment 1, MOI was 20, and β-thalassemic recipient received 600 rads (single dose). In experiment 2, 3 groups of mice received cells transduced at MOI of 0.3, 2, or 10, respectively and 1100 rads (split dose of 550 rads over 3 hours). β-Thalassemic mice that undergo transplantation with cells transduced with the LG and the LG/HA-Y1 mice are called LG- and LG/HA-Y1 mice, respectively. In a third experiment, after a single irradiation dose of 200 rads, 4 β-thalassemic mice were injected with 25 000 CD105+Sca1+ cells each. Cells were transduced with LG/HA-Y1 at a MOI of 20. For in vitro studies, bone marrow erythroid (CD45−) and lympho/myeloid (CD45+) cells were transduced with LG/HA-Y1 at a MOI of 50. RNA was extracted 2 days later.
Blood parameters
Blood samples were analyzed for hemoglobin and blood cell counts with the use of an automated cell counter (Cell Dyn 3700; Abbot Diagnostic). Hematocrit values were obtained by the manual centrifugation method. The proportion of soluble hemoglobin versus total hemoglobin was determined by the measurement of hemoglobin with the Drabkin reagent (Sigma-Aldrich) in total hemolysate and in the supernatant of centrifuged (5 minutes at 20 000g) hemolysate. Erythropoietin concentration was determined by use of the Epo monoclonal enzyme immuno-assay kit (Medac Diagnostika) with human Epo standards. Mouse and human hemoglobins were separated by cation-exchange HPLC. Hemolysates were injected onto a PolyCAT A column (PolyLC Inc). Elution was achieved with a linear gradient of 2 Tris buffers (buffer A: Tris 40mM, KCN 3mM adjusted to pH 6.5 with acetic acid; buffer B: Tris 40mM, KCN 3mM, NaCl 200mM adjusted to pH 6.5 with acetic acid) from 7% to 70% buffer B in 15 minutes. Hemoglobins were detected at 418 nm wavelength.
Flow cytometry
eGFP-positive WBCs were detected after RBC lysis and labeling with a biotinylated antibody against CD45.2 (BD Biosciences) and streptavidin–Alexa Fluor 647 (Invitrogen). For the detection of intracellular human β-globin, RBCs were washed, fixed for 30 minutes in 2% formaldehyde, permeabilized for 30 seconds in 50% methanol and 50% acetone, and stained with an FITC-labeled antibody that specifically recognizes human HbA (PerkinElmer Wallac). Myeloid and lymphoid BM cells were detected with the biotinylated anti-CD45.2 and either a PE anti–mouse GR1/Mac1, anti–mouse CD3, or anti–mouse B220 (all from eBiosciences) followed by streptavidin–Alexa Fluor 647 labeling. Erythroid precursors were identified by the use of anti–mouse Ter119 and CD71 antigens.
Quantitative PCR and RT-quantitative PCR analysis
Genomic DNA was extracted with the Nucleospin Blood kit (Macherey Nagel). The fraction of donor male cells among leukocytes (D) and the vector copy number (V) were determined by quantitative PCR, and results were compared with those for serial dilutions of genomic DNA from male and female cells and of genomic DNA from a mouse cell line containing one copy of an integrated vector per haploid genome. Real-time PCRs were performed for 40 cycles with denaturation at 94°C for 15 seconds and annealing and extension at 60°C for 1 minute after an activation step of 10 minutes at 95°C with use of the 7300 ABI Prism Detection system (Applied Biosystems) and a 2X quantitative PCR (qPCR) MasterMix containing ROX (Eurogentec). Primers and probes are described in Table 1.
Primers and probes used for real-time PCR
| Name | Sequence or TaqMan gene expression assay number* | Modification | Concentration |
|---|---|---|---|
| LV vector | |||
| GAGF | 5′-GGAGCTAGAACGATTCGCAGTTA-3′ | 720nM | |
| GAGR | 5′-GGTTGTAGCTGTCCCAGTATTTGTC-3′ | 720nM | |
| GAGP1 | 5′-ACAGCCTTCTGATGTCTCTAAAAGGCCAGG-3′ | 5′FAM 3′TAMRA | 140nM |
| β-actin | |||
| mβactF1 | 5′-ACGGCCAGGTCATCACTATTG-3′ | 900nM | |
| mβactR1 | 5′-CAAGAAGGAAGGCTGGAAAAGA-3′ | 900nM | |
| mβactP1 | 5′-CAACGAGCGGTTCCGATGCCCT-3′ | 5′FAM 3′TAMRA | 250nM |
| SRY | Mm00441712_s1* | 5′FAM 3′NFQ-MGB | 1X |
| EpoR | Mm00833882_m1* | 5′FAM 3′NFQ-MGB | 1X |
| GAPDH | Mm99999915_g1* | 5′FAM 3′NFQ-MGB | 1X |
| 18s | Hs99999901_s1* | 5′FAM 3′NFQ-MGB | 1X |
EpoR indicates erythropoietin receptor; FAM, 6-carboxyfluorescein ester; LV, lentiviral vector; NFQ, nonfluorescent quencher; MGB, minor groove binder; SRY, sex-determining region Y and TAMRA, tetramethyl-6-carboxyrhodamine.
Applied Biosystems.
Total RNA was extracted with the Purelink micro to midi total RNA purification system (Invitrogen) and cDNA was synthesized with the Superscript III first-strand synthesis super mix (Invitrogen). The mouse (m) EpoR, mGAPDH, and 18s cDNAs were quantified with the use of TaqMan gene expression assays (Table 1). The comparative Ct method (ΔΔCT) was used to compare mEpoR production levels between cell types. Control samples from which the reverse transcriptase or the sample had been omitted were included.
Amplification factor of modified erythroid cells
The effect of tEpoR and β-globin on erythroid cell expansion was calculated on the basis of the comparison between modified WBC and RBC percentages in peripheral blood. The percentage of modified RBCs (%RBC+) was determined by flow cytometry with an anti–human HbA antibody. The percentage of modified WBCs (%WBC+) was deduced from the vector copy numbers per leukocyte (V) and the fraction of donor male cells (D). It was calculated as follows:
the vector copy number per donor leukocyte Vd = V / D;
the percentage of modified WBCs among donor cells %WBC+d was deduced from Vd according to the Poisson law: %WBC+d =[1 − exp( − Vd)] × 100; and
the percentage of modified WBCs among all leukocytes %WBC+ = %WBC+d × D.
Assuming that modified WBCs have no advantage or disadvantage over unmodified WBCs in vivo, the amplification factor of modified erythroid cells (FE) resulting from the survival benefit provided to modified erythrocytes and the production advantage conferred to modified erythroid cells in the bone marrow was calculated as follows:

As a consequence, (%RBC+/%RBC−) = FE × (%WBC+/%WBC−) (eq 2), and the hyperbolic relationship between %RBC+ and %WBC+ is described by the following:
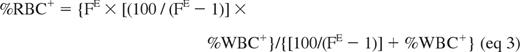
This mathematical model, derived from Roberts et al,28 assumes a steady-state balance between destruction and production of WBCs and RBCs.
To assess that modified leukocyte are not affected by tEpoR, the fractions of in vivo–modified WBC and ex vivo–modified HCs were calculated, divided, and compared between mice undergoing transplantation with LG- and LG/HA-Y1–transduced cells.
Integration site analysis
Integration site analysis was performed essentially as described.29-31 In brief, genomic DNA from vector-infected cells was purified and linkers added for PCR by treatment with phage MuA transposase and synthetic oligonucleotides containing MuA recognition sites (for details, see Brady et al,32 and Ronen et al33 ). Genomic DNA adjacent to integrated vectors was then amplified by the use of PCR primers complementary to the vector DNA end and the linker. Sequences of PCR products were determined by 454/Roche pyrosequencing, and data were curated and analyzed as described.29 The Mu transposition method provides an estimate of abundance, in which the number of independent Mu integration events in vitro that result in isolation of a single Mu site reports the relative abundance. In a few cases integration sites were found in more than one mouse. These cases could either be because of the growth of transduced cells before transplantation or because of crossover during PCR. In these cases, integration sites were assigned to a single mouse on the basis of relative abundance. Proximity of integration sites to proto-oncogenes was determined by comparison with the allOnco database.34
Statistical analysis
For 2 group comparisons, Student t test or Mann-Whitney rank-sum test were used. For comparison of more than 2 groups, one-way analysis of variance and the Holm-Sidak or the Kruskal-Wallis on ranks methods were used. Linear regression was applied to data with determination of the correlation coefficient (R2) and the P value. All tests were performed with the SigmaPlot Version 10.0 software. P < .05 was considered significant.
Results
tEpoR-expressing HCs possess a proliferative advantage in β-thalassemic mice
We first set out to evaluate whether ubiquitous expression of tEpoR from transduced marrow cells transplanted into syngenic recipients would result in the expansion of genetically modified cells in a thalassemia mouse model that has constitutively elevated levels of plasma Epo (20- to 50-fold normal mouse values).35 Gammaretroviral vectors (γRVs) expressing the cDNAs and eGFP ubiquitously were constructed. These γRVs encode the full-length murine EpoR (EpoRY1-8), either of the 2 truncated receptors (EpoRY1-2 or EpoRY1) or eGFP only (supplemental Figure 1). All constructs were shown to express efficient Epo receptors in Ba/F3 cells (data not shown). EpoRY1-8 was also shown to be functional in UT7-GM cells.35
BM cells from β-thalassemic donors were transduced with the 4 γRVs. Four million cells, including 10% genetically modified cells, were injected into lethally irradiated β-thalassemic recipients. Twenty weeks after transplantation, 5.5% and 3.1% eGFP-positive RBCs and WBCs, respectively, were detected in the blood of mice transplanted with cells modified by the control γRV (Figure 1A). Mice receiving RV/Y1-8–transduced cells showed no amplification of their eGFP-positive RBC (2.7%) and WBC (4.1%) populations over those of control mice. Separate analysis of lymphoid and myeloid compartments also did not show specific amplification (supplemental Figure 2 and supplemental Table 1). In contrast, mice receiving RV/Y1-transduced cells had 39.2% and 30.8% eGFP-positive RBCs and WBCs, respectively. This result reflected a 7-fold (P = .021) and 10-fold (P = .001) increase of modified RBC and WBC proportions compared with the control group, respectively. In mice receiving RV/Y1-2, the mean amplification levels of modified RBC and WBC proportions were 8- and 6-fold, respectively. The mean percentages of eGFP-positive cells in RV/Y1 and RV/Y1-2 mice were thus significantly different from the mean value observed in the RV/RY1-8–transduced group.

Greater proportion of modified peripheral blood cells 20 weeks after transplantation is induced by tEpoR. (A) Mean percentages, standard errors, and individual values of eGFP-positive RBCs and WBCs. HCs were transduced by RV (1), RV/Y1 (2), RV/Y1-2 (3), or RV/Y1-8 (4) retroviral vectors. (B) Mean plasma Epo levels and standard errors measured in the same mice. *P < .05 compared with groups 1 and 4.
Greater proportion of modified peripheral blood cells 20 weeks after transplantation is induced by tEpoR. (A) Mean percentages, standard errors, and individual values of eGFP-positive RBCs and WBCs. HCs were transduced by RV (1), RV/Y1 (2), RV/Y1-2 (3), or RV/Y1-8 (4) retroviral vectors. (B) Mean plasma Epo levels and standard errors measured in the same mice. *P < .05 compared with groups 1 and 4.
Because the proportion of eGFP-positive cells was greater in RBCs than in WBCs (significant in the RV/Y1-2 group), we specifically examined myeloid cells to determine whether this apparent difference was because of persistence of recipient radioresistant memory lymphoid cells. Indeed, the median values of the percentages of eGFP-positive cells showed a trend toward greater values in granulo/monocytes than in lymphocytes in RV/Y1-2 mice (P = .009) and in RV/Y1 animals, although the trend did not achieve significance (P = .185) because of high heterogeneity (supplemental Figure 2; supplemental Table 1). The percentages of eGFP-positive cells were not statistically different between the erythroid and the myeloid compartment (supplemental Table 2), indicating that tEpoR did not exert a preferential effect in erythroid over myeloid cells.
We knew from preliminary studies performed in Ba/F3 and UT7/GM cells that the absence of selection with the exogenous wild-type EpoR (RV/Y1-8) was not because of a defect in EpoR functioning. To know whether EpoR was expressed at a lower level than truncated receptors, we compared the eGFP mean fluorescence intensities (MFI) in transduced HCs grown in vitro and after transplantation. The MFI of the transduced cells before transplantation were equivalent with all vectors (supplemental Figure 3). tEpoRY1 and EpoRY1-8 mRNAs, quantified by qRT-PCR in CD45+ cells sorted for eGFP expression 10 days after transduction, were similar. However in mice, there were significant differences of MFI between RV/Y1 and RV (P = .031) and RV/Y1 and RV/Y1-8 (P = .017) in the myeloid compartment. The 4 mice with the greatest MFI in granulocytes had the greatest percentage of modified myeloid cells. No difference was observed between RV and RV/Y18 mice in any cell types. All together, these results suggested that the absence of selection with the wild-type EpoR was not because of a lower level of expression of EpoR but that myeloid cells expressing the greatest level of EpoR-Y1 were favored over cells expressing lower levels of truncated EpoR.
The blood counts (supplemental Table 3) were not significantly different between groups. However, plasma Epo levels were 2.5-fold lower (P = .005) in the RV/Y1 and RV/Y1-2 transplanted mice than in the 2 other groups (Figure 1B).
The chimeric HS40/Ankyrin promoter is highly erythroid-specific within the globin/LCR lentiviral vector
We then aimed at expressing tEpoR in a strict erythroid-specific manner to restrict cell expansion to the RBC compartment. As a further requirement, we needed to assess possible effects of transcriptional interference within the compact lentiviral provirus containing both the human β-globin gene and the tEpoR cDNA cassettes driven by their own erythroid-specific promoter/enhancer. To express tEpoR, we chose the enhancer HS40 of the human α-globin cluster cis-linked to the Ankyrin-1 promoter,36 referred to as HA.
To assess the level of erythroid specificity, eGFP was first introduced in the globin/LCR lentiviral vector LG (supplemental Figure 1B), yielding the LG/HA-eGFP vector. The lentiviral vector HPV570 was used as a control vector that expresses eGFP ubiquitously. BM cells from normal C57BL/6J-CD45.2 mice were transduced with these vectors and injected in congenic C57BL/6J-CD45.1 mice. Analysis of cells grown in vitro revealed 0.14 and 1.50 provirus copies per cell for LG/HA-eGFP and HPV570, respectively. Donor chimerism in circulating WBCs, 5 months after transplantation, were similar (approximately 90% CD45.2-positive WBCs). At the same time point, the percentages of eGFP-positive peripheral subsets of WBCs (myeloid, T-lymphoid, and B-lymphoid) and eGFP-positive RBCs were determined by flow cytometry. At 6 months after transplantation, cells from BM and thymus were analyzed by flow cytometry with the same antibodies as well as with antibodies for the erythroid lineage. The percentages of eGFP-positive myeloid, lymphoid, and erythroid cells were equivalent in mice that underwent transplantation with HPV570-modified cells, whereas the percentages of eGFP-positive erythroblasts and RBCs were much greater than the percentages of myeloid and lymphoid eGFP cells in mice that underwent transplantation with LG/HA-eGFP–modified cells (Figure 2). This finding indicates a high degree of erythroid specificity of the HA promoter in the context of the LG vector without interference because of the β-globin/LCR cassette.
![Figure 2. Strict erythroid specificity conferred by the HA promoter within the LG vector. Mean percentages and individual values of eGFP-positive cells in BM (B lymphoid [B], myeloid [M], and erythroid [E]), thymus (T lymphoid [T]), and peripheral blood (B, M, T, and RBCs) of normal mice transplanted with (top) LG/HA-eGFP or (bottom) HPV570 (Ef1α-eGFP) transduced cells. For leukocytes, donor cells were identified by mean of the CD45.2 antigen. For erythroid cells, this could not be performed. As a consequence, the proportion of eGFP-positive erythroid cells may be slightly greater than what is presented.](/view-large/figure/7148271/zh89991171250002.jpeg)
Strict erythroid specificity conferred by the HA promoter within the LG vector. Mean percentages and individual values of eGFP-positive cells in BM (B lymphoid [B], myeloid [M], and erythroid [E]), thymus (T lymphoid [T]), and peripheral blood (B, M, T, and RBCs) of normal mice transplanted with (top) LG/HA-eGFP or (bottom) HPV570 (Ef1α-eGFP) transduced cells. For leukocytes, donor cells were identified by mean of the CD45.2 antigen. For erythroid cells, this could not be performed. As a consequence, the proportion of eGFP-positive erythroid cells may be slightly greater than what is presented.
Strict erythroid specificity conferred by the HA promoter within the LG vector. Mean percentages and individual values of eGFP-positive cells in BM (B lymphoid [B], myeloid [M], and erythroid [E]), thymus (T lymphoid [T]), and peripheral blood (B, M, T, and RBCs) of normal mice transplanted with (top) LG/HA-eGFP or (bottom) HPV570 (Ef1α-eGFP) transduced cells. For leukocytes, donor cells were identified by mean of the CD45.2 antigen. For erythroid cells, this could not be performed. As a consequence, the proportion of eGFP-positive erythroid cells may be slightly greater than what is presented.
To check that specificity is maintained when eGFP is replaced by tEpoR, we compared tEpoR expression in modified erythroid and nonerythroid cells. BM cells from a non–β-thalassemic mouse were purified on the basis of the presence or absence of the pan-leukocyte CD45 antigen and then transduced with the LG/HA-Y1 vector. At 2 days later, RNA was extracted and analyzed by RT-qPCR. Expression of tEpoRY1 in transduced erythroid CD45− (> 99% Ter119+) cells was more than 100-fold greater than in transduced CD45+ (< 1% Ter119+) cells (147- and 109-fold when normalized to GAPDH and ribosomal 18s RNAs, respectively). Endogenous EpoR mRNA was undetectable in nontransduced CD45+ or CD45− cells, indicating that the 100-fold increase of EpoR mRNA observed in erythroid versus nonerythroid cells was from transgenic EpoR only and resulted from the specificity of the Ankyrin promoter.
Erythroid-specific tEpoR and β-globin coexpression results in major and selective expansion of erythroid cells in transplanted β-thalassemic mice
In view of the equivalency of the RV/Y1 and RV/Y1-2 vectors (Figure 1), we decided to focus on EpoRY1 for subsequent mouse transplant experiments. We compared the percentages of RBCs+ and WBCs+ in β-thalassemic mice transplanted with syngenic β-thalassemic marrow cells transduced with either the LG or the LG/HA-Y1 vector. The presented data combine the results of 2 experiments. Blood cell counts, percentage of RBC-expressing human Hb, level of human β-globin expression, degree of donor chimerism, and vector copy numbers were determined 40 and 35 weeks after transplantation for experiments 1 and 2, respectively. The relationship between the percentages of RBCs+ versus WBCs+ is shown (Figure 3A-B). Values are compared with 4 theoretical curves (derived from equations 2 and 3 described in the section “Amplification factor of modified erythroid cells”), where the advantage provided to modified RBCs (FE) would be 1-, 10-, 50-, or 200-fold greater than the advantage provided to modified WBCs. For most of the LG/HA-Y1 mice, the advantage provided to RBCs+ over WBCs+ was between 50 and 200, whereas the advantage provided to RBCs+ of LG mice was between 1 and 10. The median erythroid amplification factor FE for LG/HA-Y1 and LG mice were 97.2 (range, 8.2-729.7) and 5.0 (range, 0.5-14.4), respectively (Figure 3C).

tEpoR mediates erythroid cell amplification. (A-B) Relationship between the percentage of modified RBCs and the percentage of transduced WBCs in the peripheral blood of LG (■) and LG/HA-Y1 (□) mice. Assuming a minimal effect of tEpoR on modified leukocytes, 4 theoretical curves corresponding to 1-, 10-, 50-, and 200-fold preferential expansion of modified erythroid cells (FE factor) are derived from equations 3 (A) and 2 (B). Greater curvature (A) and left shift of the straight lines (B) corresponds to greater advantage for modified erythroid cells over unmodified cells. (C-D) The bottom and top boundary of the boxes indicate the 25th and 75th percentiles. Whiskers (error bars) above and below the box indicate the 90th and 10th percentiles. The line within the box marks the median. (C) Median and individual erythroid amplification factor FE in LG (■) and LG/HA-Y1 (□) mice. (D) Median and individual ratio between the genetically modified leukocyte (WBC) fraction and the ex vivo–modified HC fraction before transplantation in LG (■) and LG/HA-Y1 (□) mice.
tEpoR mediates erythroid cell amplification. (A-B) Relationship between the percentage of modified RBCs and the percentage of transduced WBCs in the peripheral blood of LG (■) and LG/HA-Y1 (□) mice. Assuming a minimal effect of tEpoR on modified leukocytes, 4 theoretical curves corresponding to 1-, 10-, 50-, and 200-fold preferential expansion of modified erythroid cells (FE factor) are derived from equations 3 (A) and 2 (B). Greater curvature (A) and left shift of the straight lines (B) corresponds to greater advantage for modified erythroid cells over unmodified cells. (C-D) The bottom and top boundary of the boxes indicate the 25th and 75th percentiles. Whiskers (error bars) above and below the box indicate the 90th and 10th percentiles. The line within the box marks the median. (C) Median and individual erythroid amplification factor FE in LG (■) and LG/HA-Y1 (□) mice. (D) Median and individual ratio between the genetically modified leukocyte (WBC) fraction and the ex vivo–modified HC fraction before transplantation in LG (■) and LG/HA-Y1 (□) mice.
To verify (1) that the apparent advantage for tEpoR modified erythroid cells was because of a benefit directly provided to them but not a disadvantage conferred to WBCs+ and (2) that tEpoR-modified WBCs had no advantage over unmodified cells, we determined the fraction of WBCs+ among donor WBCs and compared it with the fraction of transduced bulk HCs before transplantation (10 days after transduction, without addition of recombinant human Epo; Figure 3D). The median ratio of the fractions were equivalent (P = .21) and close to 1, indicating that there was neither disadvantage nor benefit to modified WBCs over unmodified donor cells in vivo. Copy numbers were also measured in HCs grown with Epo and were similar to those determined in cells grown without Epo, indicating that Epo did not confer a proliferation advantage to transduced cells in vitro.
Correction of the β-thalassemic phenotype remains correlated to the proportion of circulating RBCs that express the therapeutic human β-globin
We then wanted to assess whether the LG/HA-Y1 vector is capable of correcting the β-thalassemia disease phenotype as well as the LG vector for a given proportion of circulating RBCs+. We recorded hematologic parameters, Hb concentrations, as well as RBC and reticulocyte counts of LG and LG/HA-Y1 mice as a function of RBC+. We previously showed that correction of the β-thalassemia phenotype was evident with the LG vector provided that the percentage of RBC+ was > 40% (data not shown). To formalize this analysis, linear regressions were applied to the data obtained from LG mice with a threshold in excess of 40% RBCs+ (ie, all mice except 3 mice). Strongly significant correlations (Figure 4) between the level of RBC+ and normalization of (1) concentration of total Hb, (2) concentration of human βAT87Q-containing Hb, (3) RBC counts, (4) reticulocyte counts, and (5) spleen weight were found within the group of mice receiving LG transduced marrow cells (Figure 4A). Most of the hematologic values measured in LG/HA-Y1 mice undergoing transplantation fell within the 95% confidence band for the fitted regression lines corresponding to all the measured parameters. The percentages of erythroid cells were then measured within the spleens of 5 LG, 5 LG/HA-Y1, and 3 mock-transplanted mice (from experiment 1). The decrease in spleen size was associated with a decrease in the percentage of spleen erythroid cells in both groups of mice, consistent with decreased dyserythropoiesis and improved efficiency of terminal erythroid cell differentiation (Figure 4B).

Correction of anemia and dyserythropoiesis depends on the level of modified RBC, independently of the presence of tEpoR in the vectors. (□) Mice transplanted with LG/HA-Y1 transduced marrow cells. (■) Mice transplanted with LG-transduced marrow cells. (A) Correlation of total and human hemoglobin concentrations (Hb), erythrocyte counts (RBC), reticulocyte percentages (Retic), and spleen weight with modified RBC of transplanted β-thalassemic mice. Regression lines and 95% confidence intervals (dashed lines) were obtained from LG mice having a proportion of RBC+ greater than 40%. The bottom and top boundaries of the horizontally and vertically hatched boxes indicate mean ± SD of values from β-thalassemic and normal C57BL/6J mice. For hemoglobin, the bottom and top regression lines corresponds to therapeutic (human) and total hemoglobin, respectively. (B) Correlation of spleen weight with percentage of erythroid cells in the spleen. The regression line and 95% confidence interval were plotted with data from all mice. Three mice receiving mock-transduced cells were included (●).
Correction of anemia and dyserythropoiesis depends on the level of modified RBC, independently of the presence of tEpoR in the vectors. (□) Mice transplanted with LG/HA-Y1 transduced marrow cells. (■) Mice transplanted with LG-transduced marrow cells. (A) Correlation of total and human hemoglobin concentrations (Hb), erythrocyte counts (RBC), reticulocyte percentages (Retic), and spleen weight with modified RBC of transplanted β-thalassemic mice. Regression lines and 95% confidence intervals (dashed lines) were obtained from LG mice having a proportion of RBC+ greater than 40%. The bottom and top boundaries of the horizontally and vertically hatched boxes indicate mean ± SD of values from β-thalassemic and normal C57BL/6J mice. For hemoglobin, the bottom and top regression lines corresponds to therapeutic (human) and total hemoglobin, respectively. (B) Correlation of spleen weight with percentage of erythroid cells in the spleen. The regression line and 95% confidence interval were plotted with data from all mice. Three mice receiving mock-transduced cells were included (●).
Altogether, these data indicate that the correction of the β-thalassemic phenotype is strictly correlated to the proportion of circulating RBCs that express the therapeutic human β-globin in similar proportion for both LG and LG/HA-Y1 groups of mice, with an accessory benefit provided by tEpoR expression.
RBC expansion is lineage-restricted and therapeutic even after minimal lentiviral transfer and secondary transplantation
As a consequence of the coexpression of the therapeutic βAT87Q-globin chain and tEpoR, which induces RBC expansion in the context of elevated Epo plasma concentrations in β-thalassemia, we observed a greater degree of phenotypic correction with a lower proportion of WBCs+ in LG/HA-Y1 versus LG mice. At < 20% WBCs+, virtually all LG/HA-Y1 mice had a corrected phenotype (Figure 5A). With 8.3% LG/HA-Y1 WBCs+, 81.6% of the RBCs originated from modified erythroid progenitors, whereas 10.4% LG WBCs+ produced no more than 27% RBCs+ (Figure 5B). Consequently, with a mean WBC+ proportion of 8.3%, mean hematocrit value (40.1%) and hemoglobin concentration (12.7 g/dL) of LG/HA-Y1 mice were much greater than in LG mice having an equivalent percentage (10.4%) of WBC+ (Figure 5B). Similar correction was obtained in LG mice (mean hematocrit value, 40.2%; hemoglobin concentration, 12.5 g/dL) but with a greater proportion of WBCs+ (42.6%). The 4 mice of the LG/HA-Y1 group with the lowest proportion of WBC+ (3.3% ± 1.4%) had a mean human βAT87Q-globin level of 33.1% ± 5.6% distributed in 78.4% ± 20.1% RBCs, whereas among the 4 LG mice with the lowest proportion of modified cells (0.9%, 6.8%, 11.2%, and 13.3%), only the 2 greatest expressed detectable human βAT87Q-globin (23.8% and 12.2%), and the percentages of modified RBCs were 1.0%, 6.0%, 42.3%, and 21.3%, respectively (not shown).

Correction of anemia at lower level of modified WBCs when tEpoR is coexpressed with the therapeutic globin gene. (□) Mice transplanted with LG/HA-Y1 transduced marrow cells. (■) Mice transplanted with LG transduced marrow cells. (A) Correlation of modified RBC (RBC+), hematocrit values (Hc), total hemoglobin concentrations (Hb), and reticulocyte percentages (Retic) with modified WBC (WBC+) of transplanted β-thalassemic mice. The hatched line separates data with WBC+ below and above 20%. (B) Mean ± SD and individual modified RBC percentages, hematocrit values, total hemoglobin concentrations, and reticulocyte percentages of mice with WBC+ below and above 20%. Numbers below the graphs precisely indicate the mean percentage of modified WBCs.
Correction of anemia at lower level of modified WBCs when tEpoR is coexpressed with the therapeutic globin gene. (□) Mice transplanted with LG/HA-Y1 transduced marrow cells. (■) Mice transplanted with LG transduced marrow cells. (A) Correlation of modified RBC (RBC+), hematocrit values (Hc), total hemoglobin concentrations (Hb), and reticulocyte percentages (Retic) with modified WBC (WBC+) of transplanted β-thalassemic mice. The hatched line separates data with WBC+ below and above 20%. (B) Mean ± SD and individual modified RBC percentages, hematocrit values, total hemoglobin concentrations, and reticulocyte percentages of mice with WBC+ below and above 20%. Numbers below the graphs precisely indicate the mean percentage of modified WBCs.
To assess whether repopulating HSC were not depleted and to further decrease the proportion of modified HCs in a long-term study, secondary BM transplants were performed with HCs of primary transplanted mice (experiment 1) 40 weeks after primary transplantation. Eleven lethally irradiated female mice received 5 million bone marrow cells from 3 primary mice undergoing mock transplantation, 4 LG primary recipients, and 4 LG/HA-Y1 primary female mice. HCs of LG and LG/HA-Y1 mice were diluted with cells from one of the mice transplanted with mock transduced cells to decrease the proportion of WBC+ in the secondary animals that underwent transplantation (Table 2). At 2.5 months after transplantation, the amplification factor FE ranged from 0 to 12 and 48 to 2374 for LG and LG/HA-Y1 mice, respectively. The vector copy numbers in WBCs were not statistically different between LG and LG/HA-Y1 mice (Table 3). However, the mean percentage of RBCs expressing human βAT87Q-globin and the blood concentration of βAT87Q-globin were greater in the presence of the LG/HA-Y1 vector (26.1% human βAT87Q-globin distributed in 75.9% of erythrocytes) than with the LG vector (5.9% human βAT87Q-globin distributed in 17.8% erythrocytes). Calculations indicated that the difference was because of the expansion of the RBC+ population in the case of the LG/HA-Y1 vector, because the intracorpuscular RBC content in hybrid hemoglobin (made of human βAT87Q-globin and mouse α-globin) was similar for both LG/HA-Y1 and the LG mouse groups (4.8 and 4.6 pg, respectively). Excellent correction of the anemia and other parameters was observed in β-thalassemic mice transplanted with LG/HA-Y1 but not LG vectors (Table 3). Furthermore, results from secondary transplant experiments indicate that cell expansion remains restricted to the erythroid lineage, even after extensive HC division, because it occurs after 2 rounds of transplantation. In LG and LG/HA-Y1 groups indeed, the mean theoretical percentage of WBC+ was similar to the mean measured percentages of WBC+ (Table 2).
Greater amplification of the modified erythroid cells with the LG/HA-Y1 than with the LG vector after extensive hematopoietic cell division in secondary transplants
| Group | Primary | Dilution | WBC+ (theo) | WBC+ | RBC+ | FE |
|---|---|---|---|---|---|---|
| 2 | 30.8 | 5 | 6.2 | 2.1 | 9.5 | 5 |
| 2 | 24.7 | 7 | 3.5 | 1.0 | 7.7 | 8 |
| 2 | 31.6 | 10 | 3.2 | 8.8 | 54.0 | 12 |
| 2 | 9.4 | 4 | 2.4 | 3.5 | 0.0 | 0 |
| Mean | 3.8 | 3.9 | ||||
| SD | 1.7 | 3.5 | ||||
| 3 | 1.8 | 1 | 1.7 | 0.1 | 70.4 | 2374 |
| 3 | 3.1 | 1 | 3.1 | 1.2 | 55.2 | 102 |
| 3 | 25.2 | 4 | 5.7 | 9.8 | 88.2 | 69 |
| 3 | 24.8 | 2 | 11.7 | 16.0 | 90.1 | 48 |
| Mean | 5.6 | 6.8 | ||||
| SD | 4.4 | 7.5 |
Data are given for each secondary transplanted mouse with LG (group 2) and LG/HA-Y1 (group 3)-modified cells 10 weeks after secondary transplantation.
Dilution indicates dilution factor with cells from a mouse transplanted with mock-transduced cells; FE, amplification factor of modified erythroid cells vs modified leucocytes; primary, the percentage of modified nucleated cells in BM of primary donors; RBC+, percentage of RBCs containing human hemoglobin; WBC+ (theo), theoretical percentage of modified WBCs assuming 100% reconstitution with donor cells; WBC+, percentage of modified WBCs in secondary transplants assuming 100% reconstitution with donor cells and deduced from copy numbers.
Greater improvement of the β-thalassemic phenotype with the LG/HA-Y1 vector than with the LG vector at low copy number in secondary transplants
| Group | Copy per WBC | RBC+ | hu β-glo | Hb | Hc | RTC | RBC | MCV | MCH | MChuH | Sol Hb | WBC | ||||||||||||
|---|---|---|---|---|---|---|---|---|---|---|---|---|---|---|---|---|---|---|---|---|---|---|---|---|
| Mean | SD | Mean | SD | Mean | SD | Mean | SD | Mean | SD | Mean | SD | Mean | SD | Mean | SD | Mean | SD | Mean | SD | Mean | SD | Mean | SD | |
| 1 | 0.00 | 0.00 | 0.00 | 0.0 | 0.0 | 0.0 | 11.1 | 0.2 | 34.4 | 1.1 | 22.0 | 2.8 | 9.3 | 0.2 | 37.0 | 1.6 | 11.9 | 0.4 | 0.0 | 0.0 | 9.2 | 0.4 | 7.4 | 1.1 |
| 2 | 0.04 | 0.04 | 17.8 | 24.5 | 5.9 | 7.2 | 11.4 | 0.9 | 35.4 | 2.2 | 17.8 | 4.6 | 9.4 | 0.2 | 37.6 | 1.8 | 12.1 | 0.8 | 4.6 | 0.9 | 9.9 | 1.1 | 8.6 | 2.7 |
| 3 | 0.07 | 0.08 | 75.9 | 16.4 | 26.1 | 5.6 | 14.1 | 1.5 | 44.0 | 5.2 | 6.9 | 5.1 | 10.1 | 1.0 | 43.4 | 1.5 | 13.9 | 0.4 | 4.8 | 0.5 | 13.2 | 1.9 | 8.4 | 1.0 |
| P | .279 | .001 | < .001 | .011 | .011 | .004 | .207 | .001 | .003 | .009 | .008 | .694 | ||||||||||||
| S1-2 | N | N | N | N | N | N | N | Y | Y | |||||||||||||||
| S1-3 | Y | Y | Y | Y | Y | Y | Y | Y | Y | |||||||||||||||
| S2-3 | Y | Y | Y | Y | Y | Y | Y | N | N | |||||||||||||||
Mean hematological parameters and SDs in groups of secondary transplanted recipients with mock (1)-, LG (2)-, and LG/HA-Y1 (3)-modified cells 10 weeks after secondary transplantation.
Copy indicates peripheral blood copy number per cell; RBC+, RBC containing human hemoglobin (%); hu β-glo, human β-globin (%); Hb, hemoglobin (g/dL); Hc, hematocrit value (%); RTC, reticulocytes (%); RBC, red blood cells ( × 1012/L); MCV, mean corpuscular volume (fL); MCH, mean corpuscular hemoglobin (pg); MChuH, mean corpuscular human hemoglobin in modified RBC (pg); sol Hb, soluble hemoglobin (g/dL); WBC, white blood cells ( × 109/L).
Multiple and pairwise comparisons are made by the use of one-way analysis of variance and the Holm-Sidak method, respectively. When an overall significance level < .05 (P value) is obtained, statistical significance is given as yes (Y) or no (N) between groups 1 and 2 (S1-2), 1 and 3 (S1-3), and 2 and 3 (S2-3).
Erythroid cell expansion is self-controlled and respects hematopoietic homeostasis
The various hematopoietic lineages were analyzed by flow cytometry with lineage-specific antibodies in the peripheral blood and BM of β-thalassemic mice that underwent transplantation with LG and LG/HA-Y1 vectors. The mean percentages of T-lymphoid, B-lymphoid, and myeloid cells among CD45.2-positive cells were not statistically different between LG and LG/HA-Y1 mice that underwent transplantation (Figure 6A).

BM homeostasis is maintained 10 months after transplantation. (A) Proportion of myeloid (M), B-lymphoid (B), and T-lymphoid (T) cells among CD45.2-positive leukocytes in peripheral blood (PB) and bone marrow (BM) of LG (filled bars) and LG/HA-Y1 (open bars) mice. (B) Logarithm of plasma Epo with human corrected RBC (RBC+). The regression line and 95% confidence intervals (dashed lines) were obtained from LG mice having a proportion of RBC+ greater than 40%. The bottom and top boundaries of the horizontally and vertically hatched boxes indicate mean ± SD of values from β-thalassemic and normal C57BL/6J mice, respectively. (C) Mean ± SD and individual leukocyte and platelet numbers in peripheral blood of LG (■) and LG/HA-Y1 (□) mice.
BM homeostasis is maintained 10 months after transplantation. (A) Proportion of myeloid (M), B-lymphoid (B), and T-lymphoid (T) cells among CD45.2-positive leukocytes in peripheral blood (PB) and bone marrow (BM) of LG (filled bars) and LG/HA-Y1 (open bars) mice. (B) Logarithm of plasma Epo with human corrected RBC (RBC+). The regression line and 95% confidence intervals (dashed lines) were obtained from LG mice having a proportion of RBC+ greater than 40%. The bottom and top boundaries of the horizontally and vertically hatched boxes indicate mean ± SD of values from β-thalassemic and normal C57BL/6J mice, respectively. (C) Mean ± SD and individual leukocyte and platelet numbers in peripheral blood of LG (■) and LG/HA-Y1 (□) mice.
The plasma Epo concentration and the number of RBC+ were inversely correlated, independently of the presence or absence of tEpoR (Figure 6B), indicating that the presence of tEpoR did not impair the control of modified erythroid cell production by plasma Epo.
There was no correlation between the percentage of RBC+ and WBC or platelets (not shown) counts, nor was there a significant difference in WBC (P = .125) and platelet (P = .254) counts between the 2 groups of mice (Figure 6C). Histologic sections of spleen, liver, lung, kidney, heart, BM, and thymus of mice from experiment 1 were analyzed 10 months after transplantation. No neoplastic cell infiltration was observed.
To investigate possible effects of vector integration on cell proliferation, insertion site analysis was performed on cells from 4 β-thalassemic mice that underwent transplantation 5 months earlier with cells transduced by the LG/HA-Y1 vector. Mice underwent transplantation with a relatively low number of HSCs after conditioning with low-dose irradiation (200 rads) to maximize the pressure for cell proliferation and thereby maximize the chances of detecting effects of insertional activation of genes promoting cell proliferation or survival. At 5 months after transplantation, the lymphomyeloid (CD45+) and erythroid (CD45−) cells of each mouse were sorted, genomic DNA was extracted, and integration site sequences were determined. Integration sites were analyzed with the use of Mu-mediated transposition in vitro33 (detailed descriptions of the method are available in Brady et al32 ). Because the purified Mu transposase protein has minimal target sequence specificity, recovery of integration sites is much less biased than with standard methods involving genomic DNA cleavage with restriction enzymes. An added advantage is that the number of independent Mu transposition events associated with each integration site provides an estimate of the proportion of that cell clone in the original sample.
A total of 2510 sequence reads were generated with 454/Roche pyrosequencing. Sites were recovered from a total of 1070 independent Mu transposition events. However, this yielded only 47 unique integration sites, paralleling the low number of cells inoculated initially. Comparison of the integration site distributions in the lymphoid-myeloid and erythroid cell samples showed various degrees of commonality between lineages among the mice (supplemental Figure 4), possibly as a result of stochastic effects of sampling low numbers.
A key question for the safety of the LG/HA-Y1 vector is whether there might be an interaction between signaling through EpoR and insertional activation of proto-oncogenes, resulting in clonal expansion. There were no examples of clustered independent integration sites near a single gene, which might have been suggestive of insertional activation. We asked whether integration sites showed evidence of enrichment near gene associated with cell growth. Integration sites from all 4 mice were pooled in this analysis. We analyzed the distribution of the most abundant cell clones (marked by integration sites) relative to a list of cancer-related genes (the allOnco database34 ) and found no association between clonal abundance and proximity to cancer-related genes (Figure 7A-B). We next compared the proportion of integration sites within 50 kb of an oncogene in LG/HA-Y1 cells to the proportion of insertion site (IS) identified in murine HCs modified by the LG vector, before and 9 months after transplantation in β-thalassemic mice, and described in a previous study.33 No statistically significant differences between sets were found by the Fisher exact test for proximity to cancer-related genes (Figure 7C). We also asked whether biases in integration relative to other types of genomic features could be detected when sites from the LG/HA-Y1–treated cells were compared with sites from the LG transduced cells (supplemental Report).33 No form of genomic annotation showed strong differences between the 2 vectors. Thus, these data do not support the idea that integration near genes involved in cell growth or proliferation promoted outgrowth of particular cell clones.

Lack of association of LG/HA-Y1 vector integration sites with proto-oncogenes after erythroid cell expansion. Integration sites from all 4 mice were pooled in this analysis. Integration sites isolated from Ter119+ (A) and CD45+ (B) BM cells are labeled according to the nearest RefSeq gene. The relative clone size was quantified by the number of times it was isolated with independent integration events catalyzed by MuA transposase in vitro. Proto-oncogenes, as annotated in the allOnco database.34 are indicated by asterisks. The frequency of IS in which the nearest gene is an oncogene is not statistically different between erythroid and nonerythroid cells (P = .5523). (C) Integration site proximity to proto-oncogenes. The proportions of integration sites > 50 kb and < 50 kb from a proto-oncogene are shown. No significant differences in the number of integration sites found < 50 kb from a proto-oncogene were found between integration sites identified in this study and IS characterized in HCs transduced with the LG vector before and after transplantation (P > .05 with the 2-tailed Fisher exact test).
Lack of association of LG/HA-Y1 vector integration sites with proto-oncogenes after erythroid cell expansion. Integration sites from all 4 mice were pooled in this analysis. Integration sites isolated from Ter119+ (A) and CD45+ (B) BM cells are labeled according to the nearest RefSeq gene. The relative clone size was quantified by the number of times it was isolated with independent integration events catalyzed by MuA transposase in vitro. Proto-oncogenes, as annotated in the allOnco database.34 are indicated by asterisks. The frequency of IS in which the nearest gene is an oncogene is not statistically different between erythroid and nonerythroid cells (P = .5523). (C) Integration site proximity to proto-oncogenes. The proportions of integration sites > 50 kb and < 50 kb from a proto-oncogene are shown. No significant differences in the number of integration sites found < 50 kb from a proto-oncogene were found between integration sites identified in this study and IS characterized in HCs transduced with the LG vector before and after transplantation (P > .05 with the 2-tailed Fisher exact test).
Discussion
In the initial experiment described in this study, which was performed with ubiquitous expression of tEpoR by retroviral vectors, the similar increase in the proportion of eGFP-positive RBCs and myeloid cells can be explained by an early advantage on tEpoR expressing HSCs on endogenous Epo stimulation, in agreement with the conclusions of 2 studies performed in other mouse models. In the competitive transplant experiment performed by Kirby et al,25 lethally irradiated normal mice received a 50/50 mixture of tEpoR expressing transgenic BM cells and unmodified BM cells. In rhEpo-treated recipients, the transgenic hematopoietic progenitors outcompeted the wild-type cells, reaching 84%-100%. In the report of Urbinati et al,26 irradiated mice received mouse stem cells that were modified with a retroviral vector expressing tEpoR ubiquitously. Preferential engraftment of the transduced cells was observed in the absence of injected rhEpo, suggesting that myeloablation elicited a transient increase of plasma Epo and that the hyperresponsive tEpoR favored engraftment of transduced HSCs by increasing their survival and/or homing capacity.
The regulation of the number of Epo receptors at the erythroid cell surface is controlled posttranslationally,37 so expression of full-length EpoR is not expected to increase the number of Epo receptors at the cell surface of erythroid cells. Accordingly, expression of full-length EpoR did not confer a proliferative advantage to erythroid cells. The lack of preferential proliferation provided by full-length EpoR on modified β-thalassemic stem cells is consistent with the transitory effect of EpoR observed in lethally irradiated normal mice transplanted with full-length EpoR transduced cells.22 On the basis of the analysis of the MFI of eGFP in vitro, the vector used to produce wild-type EpoR seemed to be as efficient as the vectors expressing truncated EpoRs to express the receptor. The tEpoR protein has been shown to be more efficiently transported than the full-length EpoR on the cell surface of cell lines,38 and this could partially explain why mouse HSCs were responsive to tEpoR but not to the full-length receptor. Lower transport efficacy to the cell surface of full-length EpoR compared with tEpoR together with the rapid down-regulation of the receptor associated with dephosphorylation,39 may result in a limited impact on the intracellular signals that are triggered through mitogen activation and that are common to other cytokine receptors.40 This may explain why normal EpoR has no additive effect on cell proliferation or survival and selection.
The HS40 enhancer combined with the human Ankyrin-1 promoter was known to provide high erythroid specificity in lentiviral vectors.36 As shown by FACS analysis of HCs from transplanted mice and by RT-qPCR in vitro, the specificity is maintained in the LG vector setting. Mean vector copy numbers in modified WBCs of LG/HA-Y1 and LG mice were similar to vector copy numbers measured in transplanted cells grown in vitro (with or without rhEpo), indicating that tEpoR-modified HSCs and derived WBCs had no selective advantage over unmodified cells in vivo. In contrast, a substantial therapeutic RBC expansion occurred in vivo with the LG/HA-Y1 vector, but this expansion was self-controlled without abnormal RBC counts and restricted to the erythroid-lineage, even after 2 rounds of transplantation.
Considering that transduced erythroid cells did not contain more than 1 copy of LG or LG/HA-Y1 vectors, it is worth noting that human β-globin production in these cells was almost as efficient as the expression of mouse β-globin per allele (approximately 80%), indicating that human β-globin was very efficiently expressed from the integrated LG vector, further confirming previous in vitro data obtained with a similar vector.41 Furthermore, this observation indicates that the tEpoR gene did not impair expression for the therapeutic β-globin gene. In all cases, there was a good correlation between the proportion of human β-globin and of erythrocytes containing human β-globin, indicating a constant mean value of human β-globin content per cell.
The present study shows an additional beneficial effect of tEpoR (expressed alone and ubiquitously), which induced a decrease in plasma Epo levels. tEpoR may act like rhEpo by stimulating the synthesis of the mouse β minor-globin chain in β-thalassemic mice.42,43 An increased production of the mouse β minor-globin chain would have reduced the amount of insoluble α-globin chains and would account for an increased proportion of soluble and functional Hb in RBCs of the tEpoR transduced β-thalassemic mice. The decreased plasma Epo level is consistent with an improved tissue oxygenation. Alternatively, the serum Epo level may be lower than expected in tEpoR-transduced mice because of high Epo rate of use. Indeed, the authors of studies44 conducted in anemic patients have pointed to an inverse relationship between erythroid precursor mass and Epo, suggesting that Epo levels are regulated not only by the rate of production but also by the rate of consumption. In mice that underwent transplantation, the ubiquitously expressed tEpoR gives a proliferative advantage to several cells harboring this protein and may effectively increase intracellular trafficking and degradation of Epo45 by increasing the number of binding sites.
In contrast to the Jak2 mutation (V617F) detected in myeloproliferative disorders such as polycythemia vera,46 the expansion induced by tEpoR in PFCP is restricted to the erythroid lineage and is specific to the Epo transduction signal. The mouse tEpoR receptors used in the present study are homologous to human tEpoR, known to induce a benign erythrocytosis without increased oncogenic risk.20 Self-inactivating lentiviral vectors have lower genotoxic potential than mouse gammaretroviral vectors,47 and the reduction in the cell copy number of the vector combined with the erythroid-specific expression of the tEpoR gene may still reduce the potential residual insertional oncogenicity of the integrated lentiviral vectors. Toxicology studies performed 10 months after transplantation showed no abnormality or tumor cell infiltration in mice transplanted with cells modified by the LG vector as well as the LG/HA-Y1 vector. No difference in myeloid and lymphoid lineages was observed.
However, because extensive expansion pressure given to modified cells is thought to increase the risk of insertion-related mutagenesis/leukomogenesis,29 we investigated whether selective pressure provided to erythroid cells may have favored the expansion of specific cell clones. Reassuringly, we showed that tEpoR expression and erythroid cell expansion did not induce skewing of cell clones such that the vector was inserted preferentially near oncogenes. Further toxicologic studies in preleukemic mouse models or in non human primates will have to confirm the oncogenic safety of the vector used in this study. Because one cannot exclude the possibility that random vector integration may activate a proto-oncogene,48,49 the use of tEpoR may become especially valuable in combination with targeted integration or in situ homologous recombination/repair and may lower the required level of pretransplant myelosuppression.
The online version of this article contains a data supplement.
The publication costs of this article were defrayed in part by page charge payment. Therefore, and solely to indicate this fact, this article is hereby marked “advertisement” in accordance with 18 USC section 1734.
Acknowledgments
We are grateful to Anne Janin and Stephanie Belhadj (Saint-Louis Hospital, Paris, France) for expertise in histology and careful analysis of tissues. We thank Dr Patrick Mayeux (Cochin Hospital, Paris, France) for providing EpoR cDNAs, and Dr François Moreau-Gaudry (Bordeaux II University, Bordeaux, France) for the erythroid-specific pHAnk control element.
This work was supported by Inserm, by the Association Française contre les Myopathies (AFM), by National Institutes of Health grants AI52845 and AI082020 to F.B., the Penn Genome Frontiers Institute with a grant with the Pennsylvania Department of Health and by National Institutes of Health grant HL090921 to P.L. The Department of Health specifically disclaims responsibility for any analyses, interpretations, or conclusions. O.N. and F.F. were supported by the French Ministry of Research, AFM, and the Ligue Nationale contre le Cancer. S.R. was supported by T32AI007632.
National Institutes of Health
Authorship
Contribution: E.P., F.F., O.N., Y.B., and P.L. designed research; A.H., B.G.-L., C.C., E.P., F.F., O.N., and S.R. performed research; E.P., F.F., C.C., O.N., S.R., and F.B. collected and analyzed data; and E.P. interpreted data and wrote the manuscript.
Conflict-of-interest disclosure: B.G.-L., O.N., and Y.B. are employed by Bluebird bio; E.P. and P.L. have a financial interest in Bluebird bio, although they are not employees thereof. The remaining authors declare no competing financial interests.
Correspondence: Emmanuel Payen, CEA de Fontenay aux Roses, iMETI-Bât60, 18 route du Panorama BP6, 92265 Fontenay aux Roses, France; e-mail: emmanuel.payen@cea.fr.
