On page 658 in the 15 January 2006, issue, there is an error in Figure 3; panel 3A and 3C are reversed. The corrected figure is shown.
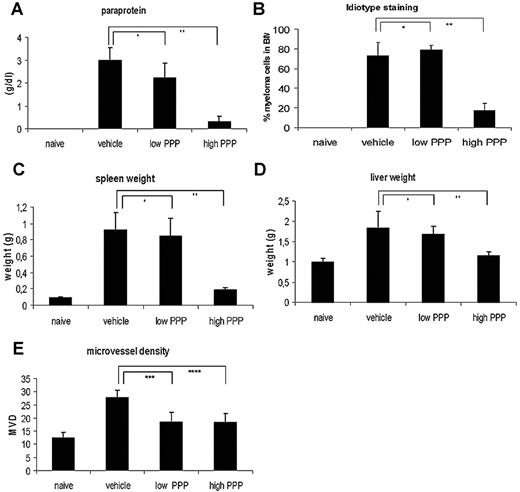
Effect of PPP in vivo. (A) Serum paraprotein concentrations as determined by serum electrophoresis. (B) Tumor load as determined by flow cytometric analysis. Data are expressed as percentage 5T33MM cells of total cell number. (C-D) Weight of spleen and liver in grams of naive and treated or untreated 5T33MM-bearing mice. (E) Microvessel density. The number of microvessels in the tibiae and femora of the mice, counted by CD31 staining. Mean values ± SD for groups of 10 mice are shown.*P > .05; **P < .001; ***P < .05; ****P < .02.
Effect of PPP in vivo. (A) Serum paraprotein concentrations as determined by serum electrophoresis. (B) Tumor load as determined by flow cytometric analysis. Data are expressed as percentage 5T33MM cells of total cell number. (C-D) Weight of spleen and liver in grams of naive and treated or untreated 5T33MM-bearing mice. (E) Microvessel density. The number of microvessels in the tibiae and femora of the mice, counted by CD31 staining. Mean values ± SD for groups of 10 mice are shown.*P > .05; **P < .001; ***P < .05; ****P < .02.


This feature is available to Subscribers Only
Sign In or Create an Account Close Modal