Abstract
Abstract 4800
Despite availability of novel agents, many MM patients still relapse and require salvage interventions. In the Arkansas program, we have attempted to procure initially sufficient hematopoietic precursor cells, for use in high-dose therapy salvage regimens once phase I-II trials have been exhausted. We are reporting on the efficacy in terms of response rate, EFS and OS of ARMM patients receiving S-BEAM.
S-BEAM comprised standard BEAM (carmustine 300 mg/m2 on day 1, etoposide 200 mg/m2 days 1–4, cytarabine 400 mg/m2 days 1–4, melphalan 140 mg/m2 on day 5) with the addition of cisplatin (10-12.5mg/m2/d CI × 5d), bortezomib (1.3-1.5mg/m2 on days 1 + 4), thalidomide (100-200mg/d for 5 days) or lenalidomide (25-100mg/d for 5 days), DEX (40-100mg/d for 5 days) plus rapamycin (3mg d1, 1mg d2-5). Statistical methods included Cox regression modeling using significance level 0.05 and Kaplan-Meier methodology for all figures. Comparisons within figures were made using the log-rank test.
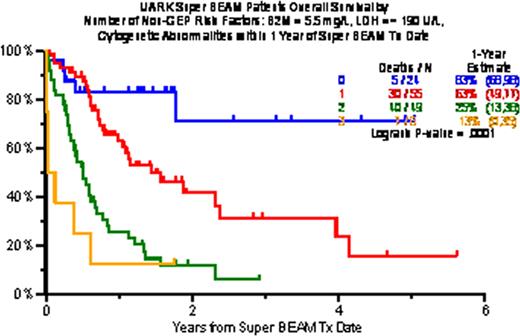
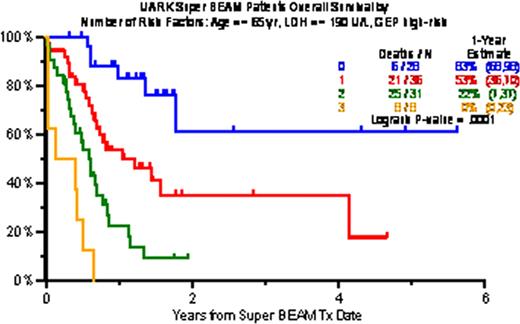
The characteristics of 147 patients treated included prior transplant (Tx) in 67% (2Tx, 29%; =>3Tx, 11%), and prior exposure and resistance in virtually all patients (92%) to bortezomib, thalidomide, lenalidomide applied in VTD, VRD or with chemotherapy VTD-PACE. Pre-S-BEAM high-risk features included low albumin (<3.5g/dL; 66%) high B2M (>=3.5mg/L; 32%), high LDH (>=ULN; 44%), and presence of cytogenetic abnormalities (CA) in 70%. Clinical outcomes included at least PR in 62% including 48% with n-CR and 29% with CR. Two-year estimates of EFS and OS were 29% and 33%; TRM within 60 days was 3%. At 4 years, 23% remain alive and 15% event-free. Independently significant variables affecting both OS and EFS adversely included, in a model without GEP, high B2M (>5.5mg/L), high LDH (>=ULN), low hemoglobin (<10g/dL) and CA, whereas achieving PR improved survival. Based on R2-driven independent adverse variables, B2M, LDH and CA were linked to poor outcomes, with 1-year estimates of OS/EFS of 83%/69% with 0, 63%/52% with 1, 25%/9% with 2, and 13%/0% with more than 2 high-risk parameters. Gene expression profiling (GEP)-defined high-risk was present in 55% (70 genes, R70) and in 47% (80 genes, R80); delTP53 was noted in 21% and Proliferation Index (PI) score >=10 in 42%. When GEP data were included in a subset of 103 patients, high-risk designation, high LDH and age >=65 were identified on the basis of highest R2 values (49% for OS, 41% for EFS). Among 28 patients lacking any of these 3 features, 1-year OS/EFS was 83%/67%, with 1 variable (n=36) 53%/38%, with 2 (n=31) 22%/6% and with 3 (n=8) 0%/0% (both P<0.001). Applying a cut-off of 2 adverse variables, the 60 patients with 2 or fewer enjoyed 2-year OS of 49% and EFS of 48%, as opposed to 7% and 4%, respectively, among the remaining 36 patients with more than 2 risk features.
S-BEAM provides effective salvage therapy in ARMM with 60-day TRM of 3% and prognostic factor-dependent survival expectation. We are currently evaluating S-BEAM earlier in the disease course, with PAC-MED as induction prior to and as consolidation after S-BEAM in high-risk myeloma.
| Multivariate analyses . | OS from Super-BEAM . | EFS from Super-BEAM . | ||||
|---|---|---|---|---|---|---|
| MV . | Variable . | % . | HR . | P-value . | HR . | P-value . |
| 1. SPF + GEP (n=96) | Age ≥ 65 yr | 15 | 2.39 | 0.002 | 2.16 | 0.004 |
| B2M > 5.5 mg/L | 21 | 3.42 | <.001 | 3.49 | <.001 | |
| Hb < 10 g/dL | 18 | 2.22 | 0.027 | 1.81 | 0.076 | |
| LDH ≥ 190 U/L | 57 | 1.61 | 0.112 | 2.11 | 0.012 | |
| GEP 70-gene high-risk | 54 | 3.36 | <.001 | 3.23 | <.001 | |
| GEP MF subgroup | 11 | 2.34 | 0.043 | 1.41 | 0.406 | |
| Achieved PR or better response* | 0.49 | 0.024 | 0.49 | 0.023 | ||
| 2. SPF only (n=136) | Age ≥ 65 yr | 15 | 2.04 | 0.021 | 2.16 | 0.004 |
| B2M > 5.5 mg/L | 15 | 2.96 | <.001 | 2.10 | 0.011 | |
| Hb < 10 g/dL | 16 | 1.61 | 0.041 | 2.52 | <.001 | |
| LDH ≥ 190 U/L | 54 | 2.38 | <.001 | 2.02 | 0.002 | |
| Cytogenetic abnormalities within 1 yr of Super-BEAM | 46 | 2.17 | 0.010 | 2.26 | <.001 | |
| Achieved PR or better response* | 0.51 | 0.011 | 0.53 | 0.010 | ||
| 3. GEP only (n=103) | GEP 70-gene high-risk | 55 | 4.61 | <.001 | 3.63 | <.001 |
| 4. “Best 3” (R2), including GEP (n=103) | Age ≥ 65 yr | 21 | 3.33 | <.001 | 2.68 | <.001 |
| LDH ≥ 190 U/L | 42 | 1.71 | 0.047 | 1.58 | 0.071 | |
| GEP high-risk | 55 | 4.51 | <.001 | 3.58 | <.001 | |
| 5. “Best 3” (R2), no GEP (n=136) | B2M > 5.5 mg/L | 16 | 3.23 | <.001 | 2.94 | <.001 |
| LDH ≥ 190 U/L | 46 | 2.08 | 0.001 | 1.98 | 0.001 | |
| Cytogenetic abnormalities within 1 yr of Super-BEAM | 68 | 2.70 | <.001 | 2.66 | <.001 | |
Overall survival by number of non-GEP risk factors (B2M, LDH, CA), selected based on maximum R2 value (38% for OS, 33% for EFS)
Overall survival by number of risk factors (age, LDH, GEP high-risk), selected based on maximum R2 values (49% for OS, 41% for EFS)
No relevant conflicts of interest to declare.
Author notes
Asterisk with author names denotes non-ASH members.


This feature is available to Subscribers Only
Sign In or Create an Account Close Modal