Abstract
Abstract 145
NPMc+ mutations occur in up to 60% of adult and 20% of childhood acute myeloid leukemia (AML) with normal karyotype. Flt3 ITD mutations occur in 25% of adult and 15% of childhood AML. Flt3 ITD mutations occur twice as frequently in patients with NPMc+ mutations compared to those who lack a NPMc+ mutation. The presence of Flt3 ITD portends a poor prognosis. NPMc+ is associated with improved outcome, but only in the absence of a concomitant Flt3 ITD mutations. Given the high frequency with which these mutations occur together it is plausible that they cooperate to cause leukemia. However, this has yet to be demonstrated experimentally.
To examine this, we crossed mice expressing a knock-in of an 18-bp ITD mutation in the juxtamembrane domain of the murine Flt3 gene (Flt3 wt/ITD) with transgenic mice expressing Flag-tagged type A NPMc+ mutation driven by the myeloid-specific human MRP8 promoter. Flt3wt/ITD mice develop a fatal myeloproliferative disorder (Li L, et al. Blood. 2008;111:3849-58) and NPMc+ transgenic mice develop a non-fatal myeloproliferation (Cheng K, et al. Blood. 2010;115-18), but neither develop leukemia, suggesting that cooperating events are required. Progeny were characterized by: 1) H&E staining of peripheral blood smears, bone marrow (BM) cytospins, and spleen sections; 2) FACS analysis of BM cells, splenocytes and thymocytes to determine the disease phenotype; 3) RT PCR to examine the expression of Flt3 ITD and NPMc+; and 4) immunofluorescence (IF) using an anti-Flag antibody to determine localization of the NPMc+ protein.
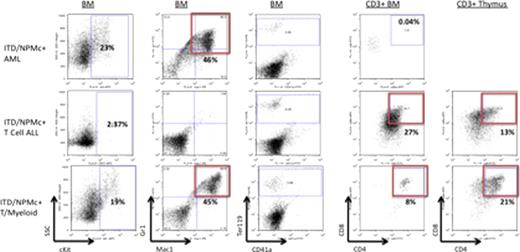
Mice harboring both mutations develop acute leukemia with a median onset of 285 days (Figure 1). All the leukemic mice exhibit a moribund appearance, leukocytosis (mean WBC 69.3±32.7 vs 11.7±8.3K/μ L in wt/wt mice), splenomegaly (mean weight 0.63±0.3 vs 0.12±0.02g in wt/wt mice), anemia and thrombocytopenia. Four disease phenotypes based on FACS and histologic analysis have been observed (Figure 2). Thirty-three percent develop AML with infiltration of the BM and spleen with Mac1+/Gr1+ myeloblasts. Thiry-three percent develop T cell ALL with infiltration of BM, spleen, thymuses and other organs with abnormal CD3+/CD4+/CD8+ lymphoblasts. An additional 33% develop a mixed phenotype acute T/myeloid leukemia with both Mac1+/Gr1+ myeloblasts and CD3+/CD4+/CD8+ lymphoblasts. One mouse developed an undifferentiated acute leukemia with primitive blasts expressing no markers specific for either lymphoid or myeloid lineage. RT-PCR of bulk leukemia cells demonstrates expression of NPMc+ and Flt3 ITD. IF of BM cells from leukemic mice demonstrates cytoplasmic localization of the NPMc+ protein.
In summary, we have utilized a mouse model to demonstrate that NPMc+ and Flt3 ITD mutations cooperate to cause leukemia. Many of the mice with both mutations develop myeloid leukemia with features similar to the human disease. There is also a striking incidence of T cell leukemia, which is particularly interesting as the NPMc+ mutation is driven by the myeloid-specific hMRP8 promotor. It is possible that there is aberrant expression of NPMc+ in lymphoid cells due to position effects of the transgene or the activation of an endogenous leukemogenic retrovirus. Other disease models using this promoter have documented similar phenomenon (Jaiswal, et al. PNAS. 2003;100:10002-7). There is a long latency of disease onset which may be due to a relatively low level of expression of NPMc+ or because additional genetic or epigenetic events are required. Perhaps the Flt3 ITD mutation causes proliferation and NPMc+ impairs DNA repair resulting in the accumulation of additional mutations that contribute to leukemogenesis.
This mouse model provides the first in vivo model of NPMc+/Flt3 ITD+ leukemia. The model will allow for the further study of this disease entity, including the examination of involved pathways and the exploration for potential therapeutic targets.
Kaplan-Meier Survival Curve. Mice with both NPMc+ and Flt3 ITD mutations have a median survival of 413 days.
FACS analysis of leukemic mice BM cells and thymocytes. Mice with AML have cKit+/Mac1+/Gr1+ myelobasts. Mice with T cell ALL have infiltration of the BM, spleen (not shown) and thymus with CD3+/CD4+/CD8+ lymphoblasts. Mice with T/myeloid leukemia have both Mac1+/Gr1+ myeloblasts and CD3+/CD4+/CD8+ lymphoblasts. Leukemic mice have depletion of maturing Ter119+ erythroid cells.
Kaplan-Meier Survival Curve. Mice with both NPMc+ and Flt3 ITD mutations have a median survival of 413 days.
Kaplan-Meier Survival Curve. Mice with both NPMc+ and Flt3 ITD mutations have a median survival of 413 days.
FACS analysis of leukemic mice BM cells and thymocytes. Mice with AML have cKit+/Mac1+/Gr1+ myelobasts. Mice with T cell ALL have infiltration of the BM, spleen (not shown) and thymus with CD3+/CD4+/CD8+ lymphoblasts. Mice with T/myeloid leukemia have both Mac1+/Gr1+ myeloblasts and CD3+/CD4+/CD8+ lymphoblasts. Leukemic mice have depletion of maturing Ter119+ erythroid cells.
FACS analysis of leukemic mice BM cells and thymocytes. Mice with AML have cKit+/Mac1+/Gr1+ myelobasts. Mice with T cell ALL have infiltration of the BM, spleen (not shown) and thymus with CD3+/CD4+/CD8+ lymphoblasts. Mice with T/myeloid leukemia have both Mac1+/Gr1+ myeloblasts and CD3+/CD4+/CD8+ lymphoblasts. Leukemic mice have depletion of maturing Ter119+ erythroid cells.
No relevant conflicts of interest to declare.
Author notes
Asterisk with author names denotes non-ASH members.


This feature is available to Subscribers Only
Sign In or Create an Account Close Modal