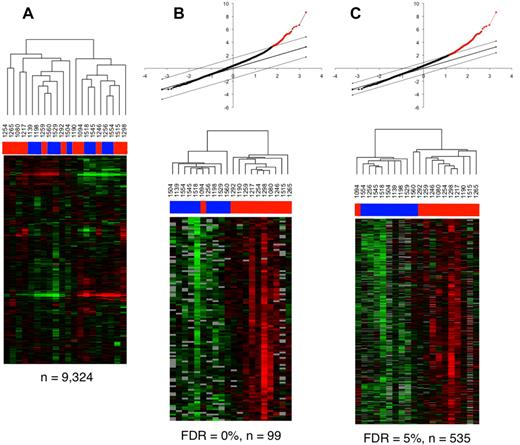
On page e26 of the April 15, 2010, issue, the heat map images were inadvertently switched in Figure 4B and Figure 4C. The clustering tree is correct and the conclusions from the figure are not altered in any way. The corrected Figure 4 is shown.
Transcriptional profiling analysis of rectosigmoid biopsies and the relationship with cellular parameters. (A) Gene expression patterns in the rectosigmoid biopsy samples from controllers and noncontrollers. Hierarchic clustering analysis was used to organize genes and samples. Each row represents an individual gene and each column, an individual patient. Black indicates the median level of expression; red, greater than median expression, green, less than median expression; and gray, missing data. Horizontal bars (in blue for controllers and red for noncontrollers) at the top of the figure indicate the dispersal of controller and noncontroller samples. (B-C) Clustering of the controller and noncontroller samples on the basis of gene expression patterns associated with cellular parameters identified through regression analysis with PC1 eigenvalues. (B) Quantitative analysis by Significance Analysis of Microarrays (SAM) was used to identify data from elements of the 99 genes that were positively associated with PC1 eigenvalues at a false discovery rate (FDR) of 0%. The graph at the top displays the positively associated genes in red, with the x-axis value denoting the expected expression and the y-axis denoting the observed expression values. The threshold lines indicate the FDR cutoff rate of 0%. The heat map shows the 20 patient samples after being reorganized using the expression values of these 99 genes. Horizontal bars (in blue for controllers and red for noncontrollers) at the top of the figure indicate the clustering of controller and noncontroller samples. (C) As described in panel B, 535 genes were identified by SAM analysis at an FDR of < 5%, and the 20 patient samples were reorganized using the expression values of these 535 genes. Horizontal bars at the top of the figure indicate the clustering of controller (blue) and noncontroller (red) samples.
Transcriptional profiling analysis of rectosigmoid biopsies and the relationship with cellular parameters. (A) Gene expression patterns in the rectosigmoid biopsy samples from controllers and noncontrollers. Hierarchic clustering analysis was used to organize genes and samples. Each row represents an individual gene and each column, an individual patient. Black indicates the median level of expression; red, greater than median expression, green, less than median expression; and gray, missing data. Horizontal bars (in blue for controllers and red for noncontrollers) at the top of the figure indicate the dispersal of controller and noncontroller samples. (B-C) Clustering of the controller and noncontroller samples on the basis of gene expression patterns associated with cellular parameters identified through regression analysis with PC1 eigenvalues. (B) Quantitative analysis by Significance Analysis of Microarrays (SAM) was used to identify data from elements of the 99 genes that were positively associated with PC1 eigenvalues at a false discovery rate (FDR) of 0%. The graph at the top displays the positively associated genes in red, with the x-axis value denoting the expected expression and the y-axis denoting the observed expression values. The threshold lines indicate the FDR cutoff rate of 0%. The heat map shows the 20 patient samples after being reorganized using the expression values of these 99 genes. Horizontal bars (in blue for controllers and red for noncontrollers) at the top of the figure indicate the clustering of controller and noncontroller samples. (C) As described in panel B, 535 genes were identified by SAM analysis at an FDR of < 5%, and the 20 patient samples were reorganized using the expression values of these 535 genes. Horizontal bars at the top of the figure indicate the clustering of controller (blue) and noncontroller (red) samples.


This feature is available to Subscribers Only
Sign In or Create an Account Close Modal