Abstract
Abstract 2276
Poster Board II-253
Mycophenolate Mofetil (MMF) controls the rate of synthesis of guanine monophosphate in the de novo pathway of purine synthesis thus suppressing the proliferation of B and T lymphocytes and preventing allograft rejection.
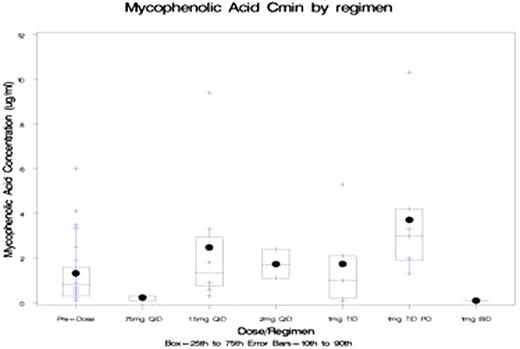
27 patients (pts) with age ( 21-66 yrs), diagnosed with acute myeloid leukemia (AML,n = 16), acute lymphoblastic leukemia (ALL,n=3), chronic myeloid leukemia (CML,n=2), aplastic anemia (AA,n=1), Hodgkins lymphoma (n=2), Non- Hodgkins Lymphoma (n=2), Myeloproliferative disorder (MPD, n=1) received GvHD prophylaxis with tacrolimus, methotrexate and MMF. Post BMT and before engrafment patients received MMF doses as shown in figure 1 to determine which MMF dosing strategy best targets the therapeutic Area Under the Curve (AUC) which is between 30 and 60 h*mcg/ml. Patients had normal bilirubin levels at the time of drug testing. Other factors including age, gender, disease, conditioning regimen intensity (Myeloablative (MAC) vs Reduced Intensity Conditioning (RIC), disease, organ function and concomitant medications were analyzed. We found the intravenous (iv) dose of 1.5 gm Q 6 to be optimal based on observed pharmacokinetics.We used a cohort of six patients (AML=4, CML=1, MPD=1). MPA and MPAG levels for a dose of 1.5 gm iv q 6 hrly and oral MMF at 1 gm q 8 hrly, were collected at pre-defined time points before engraftment, analyzed using liquid chromatography mass spectrometry. AUC0-8 (for q 8 hr oral dosing) and AUC0-6 (for q 6 hr intravenous dosing frequency) were calculated using a non-compartmental pharmacokinetic (PK) model with PK software (WinNonlin Professional 5.2). Oral dosing beyond 1 gm q 8 hours was not attempted due to GI intolerance.
The Cmax of MPA at an iv dose of 1.5 gm q 6hr ranged from 2-16.70 mcg/ml with a median Cmax of 9.40 mcg/ml and a median AUC 0-6* hr of 26.14 mcg/ml. The Cmax MPA for oral dosing of 1 gm q 8 hr ranged from 3.70- 9.40 mcg/ml with a median Cmax of 4.45 ug/ml at 3 hrs and a median AUC 0-8* hr of 18.40 ug/ml. The box and whisker plot of MPA concentration (mcg/ml) vs Dose/regimen reveals the median concentration achieved by dosing intravenously q 6 hr and through oral at q 8 hr are similar, the box representing 25th -75th quartile and the error bars representing 10th -90th quartile. In data not shown, MPAG levels increased linearly while MPA levels increased less than proportionally with dose, suggesting that the nonlinear PK relationship of MPA levels is not due to the influence of glucuronidation but may be an indicator of a saturable distribution process to tissues or erythrocytes”.
The conditioning intensity, GVHD prophylaxis did not affect MPA levels in this cohort of six pts with normal hepatic function. The maximum IV dose at 1.5 gm q 6 hrs generated similar levels to those with 1 gm orally q 8 hrs. Further dose escalation does not result in higher MPA levels.
No relevant conflicts of interest to declare.
Author notes
Asterisk with author names denotes non-ASH members.


This feature is available to Subscribers Only
Sign In or Create an Account Close Modal