Abstract
Abstract 1650
Poster Board I-676
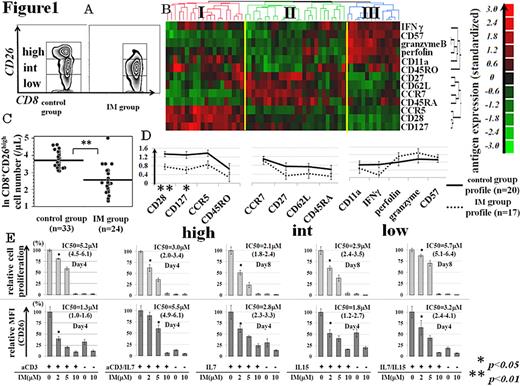
CD26 is a kind of T cell costimulatory molecule with dipeptidyl peptidase IV activity in its extracellular domain. Based on the expression level of CD26, CD4+ and CD8+ T cells can be divided into 3 (high/int/low) subsets (Figure 1A). The significance of CD26 has been studied mainly on CD4+ T cells, and CD26highCD4+ T cells are considered to represent memory T cells with typical Th1 responses. Furthermore, we reported a significant decrease in number of this subset in CML patients under imatinib (IM) therapy compared with those under IFNa therapy as well as normal volunteers (control). The role of each subset of CD8+ T cells remains to be elucidated. By analogy to a CD4+CD26high subset, we hypothesized that CD8+CD26high cells might represent a memory subset which could be affected by IM treatment. To test this notion, we first tried to define each CD8+ subset based on its expression of 13 well-known surface antigens by multi-parameter flow cytometry (FACS) analysis. FACS data for each CD8+CD26 subset from control group (n=20) were subjected to the unsupervised hierarchical clustering analysis. As a result, the hierarchical clustering revealed three major clusters (cluster I, II and III; Figure1B), which consisted of 20, 26 and 14 data respectively. Cluster I is characterized by high expression of CD127, CD28, CCR5 and CD45RO (a memory profile), to which all 20 data from high subset were categorized. Cluster II is characterized by high expression of CD27, CD62L, CCR7 and CD45RA (a naive profile), to which all 20 data from int subset and 6 of 20 data from low subset were categorized. Cluster III is characterized by high expression of IFNg, perfolin, granzymeB, CD57 and CD11a (a differentiated effector profile), to which 14 of 20 data from low subset was categorized. Thus, we could categorize CD8+ T cells according to the level of CD26 expression.
We next investigated the effects of IM on these 3 distinct subsets in CD8+ T cell differentiation program. Then, we compared immunophenotype signature of each CD8+ CD26 subset between IM group and control group (population frequency among CD8+ T cells, absolute cell count and surface antigen profile). We observed a significant decrease of CD8+CD26high subset in IM group (Figure1C), compared with control group. Altered phenotypic profile (decreased CD127/CD28 expression) was also noted in this subset from IM group (Figure1D). Finally, we investigated the impact of IM on primed CD8+ T cells in vitro. Peripheral blood CD8+ T cells were purified from normal subjects, primed with various stimuli and subjected to the grading doses of IM, followed by FACS analysis. CFSE labeling was used for monitoring cell proliferation. Stimuli included anti-CD3/CD28 MAb (aCD3), common g-chain cytokines (IL-7, IL-15), and their combination. Half inhibitory concentrations (IC50) of IM with 95% confidence interval were also calculated (Figure 1E). We found that CD8+ T cells in the presence of therapeutic concentrations of IM showed a reduced activation status (as determined by up-regulation of CD26 expression) and impaired proliferation (as determined by CFSE intensity) in response to TCR engagement as well as cytokine stimulation. Our present results not only propose a potential utility of CD26 as a convenient marker for functional (naïve/memory/effector) compartments of CD8+ T cells, but also offer another evidence for immunomodulatory effects of IM or the significant role of Abl (-related) kinase in memory CD8+ T cell development, possibly in common g-chain cytokine(s)-dependent manner.
No relevant conflicts of interest to declare.
Asterisk with author names denotes non-ASH members.


This feature is available to Subscribers Only
Sign In or Create an Account Close Modal