Abstract
Abstract 1406
Poster Board I-428
Patients receiving chemotherapy for malignancies are at increased risk for fever-neutropenia (F-N), which may lead to sepsis. A strategy to identify and differentiate “high-risk” patients at presentation would be of critical significance so that these patients may receive timely aggressive intervention. Conversely, early identification of “low-risk” patients allows for development of appropriate risk-stratified management. We hypothesize that certain acute phase reactants at the time of F-N presentation could be used to predict clinical outcome.
Children (age 1-21 years) receiving chemotherapy for various malignancies were enrolled in this prospective study. Blood samples from F-N episodes were collected at presentation and thereafter on three consecutive days. These samples were tested for high-sensitivity C-reactive protein (hs-CRP), Soluble IL-2 receptor (s-IL2R), interleukins (IL)-1,3,6,8,10 and Tumor Necrosis Factor-alpha (TNF-a). Samples were analyzed by Luminex technology (Miliplex Cytokine Kit). Clinical outcome data were collected and correlated with the respective bio-markers at presentation. “High-risk” patients were defined as those with any one of the following criteria: prolonged hospitalization (>7 days), admission to pediatric intensive care unit, or a positive bacterial blood culture. “Low- risk” patients had none of the above criteria. Data were analyzed using SAS 9.2 software. Cluster analysis was performed on all variables using the Pearson correlation coefficient. Multivariate logistic regression analysis was performed to develop a risk based predictive model, which was validated using a Receiver Operating Characteristic (ROC) curve.
An interim analysis was performed on the acute phase reactant dataset that included 29 children (males 56%, females 44%) representing 51 F-N event. Univariate analysis showed that 56% of events met “high-risk” criteria while 44% of events were “low-risk”. At presentation, significant differences were observed for median values for hs-CRP, s-IL2R, IL-6, and IL-8 between the “high-risk” and the “low-risk” groups (Table 1).
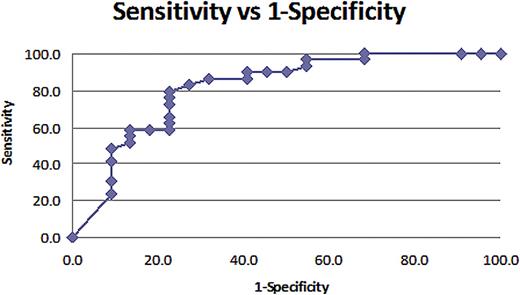
Cluster analysis showed a strong correlation between IL-6, IL-8, IL-10 and TNF-a. Within this cluster, IL-6 was selected as critical biomarker, since it explained most of the variability within the cluster. IL-6 was subsequently analyzed with other significant variables (hs-CRP and s-IL2R) in multivariate logistic regression. Logistic regression analysis showed that at F-N presentation, hs-CRP (p=0.02) and s-IL2R (p=0.06) were the most significant bio-markers that correlated with “high-risk” clinical course (Figure-1). Calculated “half-sample” Odds Ratio (OR) for hs-CRP was 6.87 (CI 1.35-34.96, p=0.02) and for s-IL2R was 4.94 (CI 0.94-26.01, p=0.06). After controlling for other variables in study, the analysis found that at F-N presentation, an increase in hs-CRP levels from 42 mg/L to 196 mg/L was associated with 7-fold increased likelihood of subsequent “high-risk” clinical course. Similarly, a rise in s-IL-2R from 262 pg/ml to 692 pg/ml increased the likelihood of “high-risk” by almost 5-fold. However, a rise in IL-6 from 39 pg/ml to 878 pg/ml at presentation was not statistically significant and did not predict an increased risk for complicated F-N course (OR 1.16, CI 0.72-1.88, p=0.54). This risk stratified predictive model was validated using Receiver Operating Characteristic (ROC) curve analysis (Area-Under-Curve AUC=0.84) Figure-2.
High-sensitivity CRP and sIL-2R at presentation may represent biomarkers of “high-risk” for clinical sepsis and complicated course among children with fever neutropenia. These biomarkers should be further tested as screening tools for risk-stratification and as response variables to assess the effectiveness of interventions in children with fever neutropenia.
Bio-marker distribution at F-N presentation.
| Bio-Marker . | High Risk Median . | Low Risk Median . |
|---|---|---|
| CRP mg/L | 175 | 42 |
| IL-1 alpha pg/ml | 5 | 5 |
| sIL-2R pg/ml | 614 | 262 |
| IL-3 pg/ml | 3 | 9 |
| IL-6 pg/ml | 278 | 37 |
| IL-8 pg/ml | 216 | 31 |
| IL-10 pg/ml | 39 | 16 |
| TNF-alpha pg/ml | 8 | 5 |
| Bio-Marker . | High Risk Median . | Low Risk Median . |
|---|---|---|
| CRP mg/L | 175 | 42 |
| IL-1 alpha pg/ml | 5 | 5 |
| sIL-2R pg/ml | 614 | 262 |
| IL-3 pg/ml | 3 | 9 |
| IL-6 pg/ml | 278 | 37 |
| IL-8 pg/ml | 216 | 31 |
| IL-10 pg/ml | 39 | 16 |
| TNF-alpha pg/ml | 8 | 5 |
Relationship between hs-CRP, sIL-2R, IL-6 at presentation and probability of high-risk F-N.
Relationship between hs-CRP, sIL-2R, IL-6 at presentation and probability of high-risk F-N.
ROC curve. AUC=0.84. At cut-off probability of 0.3, sensitivity of this model is 89.7% and specificity is 59.1%.
ROC curve. AUC=0.84. At cut-off probability of 0.3, sensitivity of this model is 89.7% and specificity is 59.1%.
Mian: Arkansas Children's Hospital Research Institute (ACHRI), Little Rock, Arkansas. : Research Funding.
Author notes
Asterisk with author names denotes non-ASH members.


This feature is available to Subscribers Only
Sign In or Create an Account Close Modal