

Abstract
Although activation of the B-cell receptor (BCR) signaling pathway is implicated in the pathogenesis of chronic lymphocytic leukemia (CLL), its clinical impact and the molecular correlates of such response are not clearly defined. T-cell leukemia 1 (TCL1), the AKT modulator and proto-oncogene, is differentially expressed in CLL and linked to its pathogenesis based on CD5+ B-cell expansions arising in TCL1-transgenic mice. We studied here the association of TCL1 levels and its intracellular dynamics with the in vitro responses to BCR stimulation in 70 CLL cases. The growth kinetics after BCR engagement correlated strongly with the degree and timing of induced AKT phospho-activation. This signaling intensity was best predicted by TCL1 levels and the kinetics of TCL1-AKT corecruitment to BCR membrane activation complexes, which further included the kinases LYN, SYK, ZAP70, and PKC. High TCL1 levels were also strongly associated with aggressive disease features, such as advanced clinical stage, higher white blood cell counts, and shorter lymphocyte doubling time. Higher TCL1 levels independently predicted an inferior clinical outcome (ie, shorter progression-free survival, P < .001), regardless of therapy regimen, especially for ZAP70+ tumors. We propose TCL1 as a marker of the BCR-responsive CLL subset identifying poor prognostic cases where targeting BCR-associated kinases may be therapeutically useful.
Introduction
Chronic lymphocytic leukemia (CLL) is a mature B-cell malignancy that has been stratified into indolent and more aggressive subtypes based on pathogenetic features that also correlate with stages of B-cell maturation. Cases of CLL derived from pre-germinal center (GC) B cells frequently express the tyrosine kinase ZAP70, may express higher levels of CD38, and may acquire genomic deletions of the ATM and/or TP53 tumor suppressors on progression. CLL tumors of post-GC origin, as evidenced by somatically mutated immunoglobulin genes, usually lack ZAP70 and CD38 expression1-4 and do not show deletions of ATM or TP53.5,6 In most series, these different pathogenetic features are associated with a shorter time to treatment (TTT) and a shorter progression-free survival (PFS) for the pre-GC CLL subset.7-10
Signaling through the B-cell receptor (BCR) has been suggested to mediate both precursor outgrowth and leukemia progression in CLL and may thus provide a targetable pathway in the most BCR-dependent cases. Marked differences in responsiveness to BCR engagement occur among individual cases of CLL, but the mediators of this differential response have not been clearly defined. CLL with a “pre-GC” phenotype mostly show intact but functionally abnormal BCR signaling11,12 that is correlated with differential activity or expression of tyrosine kinases (ie, ZAP70, LYN) and/or the serine/threonine kinase AKT, a central regulator of prosurvival signals through the BCR.13-19
The T-cell leukemia 1 (TCL1) proto-oncogene, which is highly expressed in a substantial proportion of CLL, has been demonstrated to be a regulator of AKT activation in T-cell leukemias and in nonlymphocyte experimental models.20-23 The B-cell transforming potential of TCL1 has been established in immunoglobulin heavy chain variable-region (IGHV) promoter/Eμ-enhancer TCL1-transgenic mice that show emergence of clonal CD5+/IgM+ expansions resembling the course and phenotype of IGH-unmutated human CLL.24,25 We have previously described that TCL1 shows a differential and regulated expression pattern in CLL,20 and an association of high protein levels of TCL1 with features of aggressive disease in CLL has been subsequently indicated by us and others.20,26,27
We show here that the growth stimulatory effects of BCR engagement in CLL cultures are strongly correlated with the levels of TCL1 and the kinetics of TCL1-AKT recruitment to BCR membrane complexes. Increased TCL1 levels are also strongly associated with inferior clinical outcome, independent of treatment. These findings link the function of TCL1 to hyperresponsive BCR signaling and identify an easily assayed predictor of the aggressive variants of CLL.
Methods
Patient samples
A previously unpublished set of freshly isolated peripheral blood (PB) CLL tumor specimens from untreated patients (n = 70; 31 IGHV unmutated, 23 mutated, 16 status not determined) acquired between 2004 and 2007 at the University of Texas M. D. Anderson Cancer Center, Houston, TX were studied in accordance with an institutional review board–approved protocol. Inclusion criteria for samples were based on obtaining sufficient material for culture and immunoblot (> 20 × 109/L white blood cells [WBCs]) with adequate purity (ie, lymphocytes composed of ≥ 90% of all WBCs). IGHV mutation status was determined by polymerase chain reaction–based DNA sequencing from RNA extracted from PB or bone marrow samples, with a cutoff of more than 2% germline divergence defined as “mutated.”20 Standard karyotyping and fluorescence in situ hybridization analysis were performed as described.20
Demographic data on the included patients are provided in supplemental Table 1 (available on the Blood website; see the Supplemental Materials link at the top of the online article). At the time of last follow-up, 59 (84%) of these patients were treated at some point during their course, including initially with 1- or 2-drug regimens containing fludarabine (n = 34), 3- and 4-drug regimens, predominantly fludarabine, cyclophosphamide, and rituximab (n = 22), and single first-line lenalidomide (n = 3). Overall survival (OS) was measured from the time of diagnosis until disease-related death. TTT reflected the time from diagnosis until treatment initiation. PFS was measured from therapy initiation to either confirmed disease progression (ie, relapse or progressive disease as per the updated National Cancer Institute Working Group guidelines)28 or to disease-associated death.
Culture studies
CLL cells were isolated by Ficoll Paque Plus (GE Healthcare) centrifugation after negative selection (RosetteSep human B-cell enrichment cocktail; StemCell Technologies) and compared with PB and tonsillar B cells obtained by an antibody bead-based negative-selection method (MACS columns; Miltenyi Biotec). Trypan blue staining was used to assess viability. The cells were immediately cultured in 15% fetal calf serum in RPMI culture media with 1% penicillin-streptomycin (Invitrogen). For BCR stimulation, surface (s)IgM crosslinking was done with 0.25 μg/mL (“low”), 2.5 μg/mL (“mid”), and 25 μg/mL (“high”) concentrations of mouse F(ab)′2 α-human IgM (Southern Biotechnology), immobilized to culture plates before the addition of lymphocytes. Unstimulated cultures and those exposed to interleukin-4 (IL-4; 20 ng/mL) plus soluble CD40-ligand (L; 100 ng/mL, both PeproTech) served as negative and positive growth controls, respectively. Stimulations were also performed using phorbol-12-myristate-13-acetate and lipopolysaccharide (LPS; both Sigma-Aldrich, used at 100 ng/mL and 40-80 μg/mL, respectively), BLyS/BAFF (1 μg/mL; PeproTech), and APRIL (250 ng/mL; R&D Systems). Culture conditions for the DoHH2 mature B-cell line and its TCL1 transfectants (below) were identical to those applied to primary CLL samples and B-cell cultures.
Immunophenotyping and scoring
A standard diagnostic lymphocyte flow cytometric panel (CD3, CD5, CD11c, CD19, CD20, CD23, CD38, FMC7, and κ/λ Ig) was performed on all cases, with assessment of the percentage and intensity of sIgM (0 indicates negative; 1, dim; and 2, strong) on the gated CLL cells. TCL1 (1-21, 1:500),20 ZAP70 (2F3.2, Upstate Biotechnology, 1:100), and sIgM (polyclonal goat, Vector Laboratories, 1:3000) were assessed by immunohistochemistry (IHC) on deparaffinized sections of bone marrow or lymph node specimens after antigen retrieval as previously reported.29 The results were compared with the primary Western blot data (TCL1) and flow cytometry (sIgM) to confirm intensity levels. IHC was the primary method for ZAP70 analysis with 3-tiered scoring: 0 indicates absent; 1, weak; and 2, uniform/strong.
Immunoblotting was performed on nuclear/cytoplasmic or whole-cell lysates as previously indicated,21,30 with enhanced chemiluminescence-based detection (GE Healthcare). In selected cases, cytosol/membrane fractionation was done using modified partitioning protocols based on the manufacturer's instructions (Qproteome subfractionation kit; QIAGEN) and on specific detergent properties (NP40 or CHAPS containing buffers). Spin column size-exclusion chromatography (GE Healthcare) with a molecular weight cutoff of more than 30 kDa for eluted proteins and their complexes was used on the subcellular fractions to indirectly enrich for complexed TCL1 (in addition to the immunoprecipitations in “AKT kinase activity assays”) to be subsequently detected by immunoblot. Primary antibodies used included TCL1 (1-21, 1:5000), phospho(p)serine(S)473-AKT, pan-pAKT-substrate RXRXXS/T-motif, pERK1/2 (T202/Y204), Cyclin D2, cleaved and full-length caspase 3 (all Cell Signaling Technology; all 1:1000), AKT1/2, MCL1 (both 1:1000; Santa Cruz Biotechnology), β-actin (AC-15, Sigma-Aldrich; 1:10 000), poly(ADP-ribose) polymerization (PARP; BD Biosciences PharMingen, 1:1000), ZAP70 (2F3.2, Upstate Biotechnology, 1:1000), and CCR4 (Novus Biologicals; 1:1000).
Immunoblot signal density was quantitated after scan using the ImageJ software (National Institutes of Health). Blot intensities were normalized to reference β-actin control levels before comparison between conditions. pAKT levels after stimulation were graded as “strong” (2.5-fold or higher increase of pS473-AKT), “moderate” (1.5- to ≤ 2.5-fold), or “no response” (≤ 1.5-fold). TCL1 intensity was graded by immunoblot, with the B-cell line DoHH2 used as the negative control and a stably TCL1-transfected DoHH2-TCL1 subclone (method as described in Herling et al21 ) and CD19-selected normal tonsillar B cells used as the high- and low-positive controls, respectively. TCL1 levels were graded after densitometry followed by normalization to β-actin levels as 0, absent (equivalent to DoHH2); 1, weak (normal B cells); 2, moderate (> normal B-cell control, < DoHH2-TCL1); and 3, strong (≥ DoHH2-TCL1) based on a 50-μg protein load per sample. TCL1 immunoblot levels were confirmed and positivity correlated with results from IHC and flow cytometry in 25 and 15 cases, respectively. By flow cytometry, the difference of TCL1-FITC mean fluorescence intensity in DoHH2-TCL1 cells versus DoHH2 cells was approximately 1.5-fold log 10 with a distribution of CLL cases within this range.
AKT kinase activity assays
In 10 cases, in addition to pAKT and pan-pAKT-substrate RXRXXS/T-motif immunoblots (“Immunophenotyping and scoring”), AKT kinase activity by in vitro kinase assays measuring the catalytic activity of immunoprecipitated cellular AKT on its exogenous substrate GSK3α/β was evaluated as published.21
Laser confocal microscopy
The staining of cytospin preparations (here 19 CLL and tonsil B cells from 2 donors) has been previously reported.21 Primary antibodies were directed against TCL1 (1-21, 1:50 and a polyclonal antiserum,31 1:600), AKT1/2 (1:200), ZAP70 (1:20) (both Santa Cruz Biotechnology), pS473-AKT (1:200), LYN (1:50), SYK (1:50), pan-p-protein kinase C (PKC; 1:50; all Cell Signaling Technology), and CD79a (1:50; Dako North America).
MTT proliferation assays
The colorimetric 3-[4,5-dimethylthiazol-2-yl-2,5-diphenyl] tetrazolium bromide (MTT) assay (CellTiter96 assay, Promega) assessed cell proliferation by measuring metabolic activity and viability in duplicates per sample as described.20 Averaged absorbances were charted as ratios of the experimental to the control condition.
Statistics
Using STATISTICA software (StatSoft), correlations were made between discrete (ie, protein levels) or continuous (ie, lymphocyte doubling time [LDT], percentage positive cells) variables and with outcome. Secondarily categorized values were only used if generally accepted (ie, IGHV mutational status). The χ2 test was used for dichotomized categorical variables, whereas Fisher exact P value was used for 3 to 5 dependent categories. Mann-Whitney and Kruskal-Wallis tests were used to compare continuous variables across 2 and more than 2 groups, respectively, with only 2-sided P values reported. Difference estimations in Kaplan-Meier univariate analyses were done by log-rank statistics; Cox proportional hazard regression was used for multivariate analyses.
Results
High TCL1 expression in CLL is associated with markers of the pre-GC subset and with higher surface IgM levels
In 70 primary samples of CLL, TCL1 levels were quantified by immunoblot and correlated with IGHV mutational status, cytogenetics data, and expression levels of CD20, CD25, CD38, ZAP70, and sIgM. Higher TCL1 levels were associated with unmutated IGHV status, ZAP70 immunohistochemical expression, higher percentage of CD38+ cells, presence of chromosome 11q22-23 deletion (Figure 1A), as well as with higher sIgM levels as determined by flow cytometry (P = .03, Figure 1B).

Levels of TCL1 in CLL correlate with other features of aggressive disease. (A) Increased expression of TCL1 (graded on immunoblots after normalization to β-actin levels) significantly correlated with tumor-cell ZAP70 immunohistochemical expression, unmutated IGHV gene mutational status, surface CD38 levels, and deletions of the chromosome 11q22-23 region. (B) TCL1 levels, using a 4-tier score described in “Methods,” showed a strong positive correlation with the percentage of sIgM+ CLL cells analyzed at the time of TCL1 measurement.
Levels of TCL1 in CLL correlate with other features of aggressive disease. (A) Increased expression of TCL1 (graded on immunoblots after normalization to β-actin levels) significantly correlated with tumor-cell ZAP70 immunohistochemical expression, unmutated IGHV gene mutational status, surface CD38 levels, and deletions of the chromosome 11q22-23 region. (B) TCL1 levels, using a 4-tier score described in “Methods,” showed a strong positive correlation with the percentage of sIgM+ CLL cells analyzed at the time of TCL1 measurement.
BCR-induced AKT phospho-activation in CLL cultures is correlated with TCL1 levels
To determine the functional status of the BCR, short-term CLL cultures were stimulated with 3 different concentrations of plate-bound α-IgM antibody and results compared with growth seen with CD40L/IL-4 or LPS treatment and unstimulated conditions. In 10 of 22 (46%) cases, BCR engagement led to rapid phosphorylation of MAPK (p44/42) with various, and often more delayed, phospho-activation of AKT at serine 473 (Figure 2A). In contrast, CD40L/IL-4 treatment resulted in uniform pERK1/2 and pAKT induction. In this 22-case subset, the levels of BCR-induced AKT phospho-activation were assessed at multiple time points from 15 minutes to 4 days of BCR stimulation, with differences between individual cases being maximal at 2 hours of stimulation. At this time point, cultures with weak AKT activation showed some pAKT induction at high α-IgM dosages, whereas the strongest responders showed pAKT induction after only 15 minutes of stimulation even with low doses of α-IgM. Elevated levels of pAKT typically persisted for up to 48 hours and declined thereafter.

Higher TCL1 levels predict the degree of BCR-induced AKT phospho-activation in CLL short-term cultures. (A) After BCR crosslinking, responsive CLL cases showed rapid ERK1/2 phospho-activation followed by variable and usually prolonged pS473-AKT induction. pAKT activation could be detected in some cases by 15 minutes of BCR stimulation and was most variable between cases at 2 hours, peaked between 24 to 48 hours, and declined thereafter. Such responsive cases frequently showed parallel changes in TCL1 levels (see also Table 1). (B) Using 3 different α-IgM plate concentrations for each of the 70 CLL cultures, the degree of AKT phospho-activation after 2 hours of BCR engagement (graded as none, moderate, or strong) was highly correlated with TCL1 levels (P = .005, graded as in Figure 1). Among the strong pAKT responder group (red text), moderate to high TCL1 levels were seen in 24 of 25 cases, whereas 75% of the TCL1-dim/negative cases were in the nonresponsive group (black). A third group of cases showed moderate levels of pAKT induction, even at high α-IgM concentrations (blue, middle panel). (C) Full-length TCL1, introduced into the TCL1-negative DoHH2 B-cell line, showed both cytoplasmic and nuclear localization with most pAKT phospho-activation in the cytoplasmic fraction (left panel). TCL1 introduction led to mildly increased (1.26-fold) basal pAKT levels, compared with the TCL1− baseline (“*” in right panel) but more prominent phospho-activation after BCR (**1.72-fold after TCL1+ baseline was set as 1.0) or LPS stimulation, but not after other B-cell cytokine stimuli. Numbers indicate normalized densitometric quantitation of blot, with 1.0 corresponding to the level seen in the unstimulated control condition (blue indicates TCL1-expressing transfectants).
Higher TCL1 levels predict the degree of BCR-induced AKT phospho-activation in CLL short-term cultures. (A) After BCR crosslinking, responsive CLL cases showed rapid ERK1/2 phospho-activation followed by variable and usually prolonged pS473-AKT induction. pAKT activation could be detected in some cases by 15 minutes of BCR stimulation and was most variable between cases at 2 hours, peaked between 24 to 48 hours, and declined thereafter. Such responsive cases frequently showed parallel changes in TCL1 levels (see also Table 1). (B) Using 3 different α-IgM plate concentrations for each of the 70 CLL cultures, the degree of AKT phospho-activation after 2 hours of BCR engagement (graded as none, moderate, or strong) was highly correlated with TCL1 levels (P = .005, graded as in Figure 1). Among the strong pAKT responder group (red text), moderate to high TCL1 levels were seen in 24 of 25 cases, whereas 75% of the TCL1-dim/negative cases were in the nonresponsive group (black). A third group of cases showed moderate levels of pAKT induction, even at high α-IgM concentrations (blue, middle panel). (C) Full-length TCL1, introduced into the TCL1-negative DoHH2 B-cell line, showed both cytoplasmic and nuclear localization with most pAKT phospho-activation in the cytoplasmic fraction (left panel). TCL1 introduction led to mildly increased (1.26-fold) basal pAKT levels, compared with the TCL1− baseline (“*” in right panel) but more prominent phospho-activation after BCR (**1.72-fold after TCL1+ baseline was set as 1.0) or LPS stimulation, but not after other B-cell cytokine stimuli. Numbers indicate normalized densitometric quantitation of blot, with 1.0 corresponding to the level seen in the unstimulated control condition (blue indicates TCL1-expressing transfectants).
In these cultures and 48 additional cases studied at only 2 time points (for a total of 70 different patients), the degree of BCR-induced AKT phospho-activation observed at 2 hours of stimulation was strongly correlated with TCL1 levels (P < .001). Moderate to high TCL1 levels characterized 96% of cases with a strong pAKT induction after 2 hours of sIgM engagement, whereas cases with no AKT phospho-activation above control were dim/negative for TCL1 in 75% of cases (Figure 2B; Table 1). In 13 (19%) cases, there were increases in TCL1 protein levels noted over the course of stimulation, a finding that was completely restricted to those cultures that showed BCR-induced AKT phospho-activation (P = .003). Neither IGHV-mutation status (or its surrogates ZAP70 or CD38 expression) nor the degree of pERK1/2 induction showed significant correlation with the outcome of BCR stimulation, indicating that the observed association of BCR/AKT response with higher TCL1 levels was not simply related to pre- versus post-GC status or expression of the BCR-associated kinases or to tumor activation state (Table 1).
Categories of in vitro BCR response of 70 CLL short-term cultures and their associations with clinical parameters and tumor features
| Pattern of response to BCR stimulation | Correlation with |
|---|---|
| pERK1/2 activation at 2 h | High baseline pAKT (P = .06), short TTT (P = .05) |
| Code (n): 0 (12), 1 (2), 2 (5), 3 (3) | Lower in CLL with isolated -13q14 (P = .04) |
| pS473AKT activation at 2 h | TCL1 (P <.001), pan-pAKT target induction (P = .04), baseline pAKT (P = .05) |
| Strong: 36% (25 of 70) | sIgM and Rai stage (both P = .04), WBC and CD20 expression (both P = .02) |
| Mild: 41% (29 of 70) | Risk of not achieving a CR after F- and FCR-based frontline therapy (both P = .04) |
| None: 23% (16 of 70) | Inversely with maximum BCR-induced growth (P = .02) |
| TCL1 protein increase at 2 h | 2-hour pAKT response (P = .003), high baseline pAKT (P = .01) |
| Yes (n = 13), no (n = 53) | More likely in +12 (P = .02) and less likely in -11q22-23 karyotypes (P = .03) |
| Low peak WBC (P = .03), low no. of treatments (P = .02), long TTT (P < .001) | |
| Growth induction at 48 h | Major determinant: 2-hour pAKT response (P < .001) and maximum BCR-induced growth amplitude (P < .001) |
| Hyperresponsive: 28% (8 of 29) Dose-dependent: 34% (10 of 29) | Hyperresponsive group: higher in vitro baseline growth (P = .002), lower IL-4/CD40L-induced growth (P = .03), higher sIgM (P = .07), and baseline pAKT and CD25 expression (both P = .08) |
| No response: 38% (11 of 29) | Dose-dependent growth: high CD38 (P = .03) and WBC, short LDT and TTT (all P = .06), high Rai stage (P = .07) |
This association between TCL1 and the strength of BCR-induced AKT activation was also noted after TCL1 transfection into the cell line DoHH2, a B-cell lymphoma line with sIgM expression, and intact BCR signaling but lacking TCL1 expression. Stable expression of TCL1 in DoHH2 led to minimal increases in baseline pS473-AKT levels but more pronounced pAKT induction after BCR or LPS stimulation but not with cytokine treatment (Figure 2C).
BCR-induced growth response of CLL cultures is strongly associated with kinetics of AKT phospho-activation and TCL1 levels
Three different patterns of CLL growth in culture were seen after 48 hours of continuous BCR engagement, as measured by MTT assay and induction of cyclin D2 expression. This time point was chosen based on the described 5-minute to 4-day time-course experiments, because it represented the time of maximal growth stimulation for most cultures. Among 29 such CLL cultures stimulated at 3 α-IgM doses, 8 cases (28%) showed higher proliferation at low α-IgM or unstimulated conditions and an apoptotic response at higher α-IgM, as evidenced by cell fragmentation, caspase 3 and PARP cleavage, and loss of MCL1 expression (Figure 3A left panels). This BCR hyperresponsive pattern was similar to the pattern seen in tonsillar B cells (Figure 3A bottom left, lines with square boxes). Ten cases (34%) showed a dose-dependent growth response to BCR engagement (Figure 3A middle panels). Finally, 11 cases (38%), despite expressing sIgM, showed no detectable growth response to BCR engagement but did respond to CD40L/IL-4 with proliferation and cyclin D2 and MCL1 induction (Figure 3A right panels). In 4 of 5 patients studied at 2 different time points over the course of disease, the same in vitro growth responses were seen for both samples (2 dose-dependent BCR responders, 2 BCR nonresponders), whereas one changed from a BCR hyperresponder to a nonresponder on disease progression.

The growth response in CLL cultures after BCR engagement is most strongly predicted by pAKT activation and by TCL1 levels. (A) The growth and apoptotic parameters of 29 CLL cultures from Figure 2B were measured after 48 hours of continuous BCR crosslinking at 3 different α-IgM concentrations, compared with CD40/IL-4 stimulation and unstimulated controls. Cases were defined as having a hyperresponsive BCR pattern (left panels, with growth at low α-IgM and apoptosis at higher doses), dose-dependent BCR response (center panels), or absent growth response (right panels) based on MTT assay (top panels) and immunoblots (middle panels). Increased cyclin D2 levels correlated with MTT-measured growth induction as did expression of the AKT target MCL1, whereas cleaved PARP and caspase 3 levels correlated with the degree of apoptosis observed. The 2-hour AKT phospho-activation pattern after BCR engagement (colored as in Figure 2B as follows: red, strong; blue, moderate; and black, absent) were correlated with the 48-hour growth pattern (bottom panel). Cases with a hyperresponsive growth pattern showed strong pAKT induction (red lines) that paralleled the BCR response pattern seen in tonsillar B cells (lines with square boxes), whereas cases with only moderate BCR induced pAKT activation showed dose-dependent growth patterns (blue lines). (B) The pattern of BCR-inducible growth at 48 hours correlated with TCL1 levels. A hyperresponsive/apoptotic outcome was seen in CLLs with the highest TCL1 expression, whereas a lower level but progressive increase of growth on α-IgM escalation (dose-dependent response) was associated with low to moderate TCL1 levels in most cases. CLL cultures not responding to BCR stimulation included those that were negative/low for TCL1 but also some that highly expressed TCL1 where the growth stimulation may have been missed because of timing of the MTT assay.
The growth response in CLL cultures after BCR engagement is most strongly predicted by pAKT activation and by TCL1 levels. (A) The growth and apoptotic parameters of 29 CLL cultures from Figure 2B were measured after 48 hours of continuous BCR crosslinking at 3 different α-IgM concentrations, compared with CD40/IL-4 stimulation and unstimulated controls. Cases were defined as having a hyperresponsive BCR pattern (left panels, with growth at low α-IgM and apoptosis at higher doses), dose-dependent BCR response (center panels), or absent growth response (right panels) based on MTT assay (top panels) and immunoblots (middle panels). Increased cyclin D2 levels correlated with MTT-measured growth induction as did expression of the AKT target MCL1, whereas cleaved PARP and caspase 3 levels correlated with the degree of apoptosis observed. The 2-hour AKT phospho-activation pattern after BCR engagement (colored as in Figure 2B as follows: red, strong; blue, moderate; and black, absent) were correlated with the 48-hour growth pattern (bottom panel). Cases with a hyperresponsive growth pattern showed strong pAKT induction (red lines) that paralleled the BCR response pattern seen in tonsillar B cells (lines with square boxes), whereas cases with only moderate BCR induced pAKT activation showed dose-dependent growth patterns (blue lines). (B) The pattern of BCR-inducible growth at 48 hours correlated with TCL1 levels. A hyperresponsive/apoptotic outcome was seen in CLLs with the highest TCL1 expression, whereas a lower level but progressive increase of growth on α-IgM escalation (dose-dependent response) was associated with low to moderate TCL1 levels in most cases. CLL cultures not responding to BCR stimulation included those that were negative/low for TCL1 but also some that highly expressed TCL1 where the growth stimulation may have been missed because of timing of the MTT assay.
As indicated in Table 1, the growth characteristics for each CLL after 48 hours of BCR engagement were predicted most strongly by the degree and pattern of AKT activation observed after 2 hours of BCR stimulation (P < .001) and less strongly by baseline TCL1 levels (P = .046; Figure 3B). Strong AKT phospho-activation, even at low α-IgM concentrations, correlated with the hyperresponsive/apoptotic pattern in 7 of 8 cases (Figure 3A red lines, color-coded as in Figure 2B), whereas gradual increases in pAKT with increasing α-IgM were associated with dose-dependent growth responses in 9 of 10 cases (Figure 3A blue lines). Cases with no detectable pAKT stimulation at 2 hours (Figure 3A black lines) also showed no BCR-induced growth response, except for 1 case.
Discordances between growth response and pAKT induction and TCL1 levels were mostly seen among those cases with no growth noted in the 48-hour cultures. Among these, 6 of 11 cases showed a strong pAKT induction at 2 hours (Figure 3A bottom-right, red lines) but no growth at 48 hours. Given that we were able to only assess growth and apoptotic parameters at this one time point for these cultures, we think that these discordances may simply reflect the timing of growth measurements. In that regard, 5 of these 6 discordant CLL cases showed high TCL1 levels at baseline (Figure 3B) and had decreases in pAKT levels noted in the high-dose α-IgM conditions. Based on other cases, this pattern probably reflects a BCR hyperresponsiveness phenotype that produced early apoptosis that was missed in the 48-hour measurements.
Growth response of CLL cultures correlates with kinetics of TCL1-AKT recruitment to the BCR complex
Given the correlation of growth response with AKT phospho-activation and high TCL1 levels, we examined the kinetics and subcellular localization of TCL1 and AKT after BCR stimulation. In tonsillar B cells (n = 3), TCL1 and AKT were rapidly recruited to the membrane after BCR crosslinking (Figure 4A). CLL cases that had rapid and strong AKT phospho-activation (and an apoptotic response) after BCR engagement showed similar early and persistent localization of TCL1 and AKT to membrane complexes (n = 7), correlating with the pAKT induction analyzed by immunoblot. In this hyperresponsive group, TCL1-AKT and -pAKT colocalization was maximal by 30 minutes but persisted for up to 4 days with eventual increases in nuclear TCL1-AKT complexes (Figure 4B). These early TCL1-AKT complexes also contained BCR-associated proximal kinases, including LYN, SYK, and ZAP70 (Figure 4C), but only minute amounts of pPKC (not shown).


Growth responses of CLL cultures to BCR engagement correlate with kinetics of TCL1 and AKT colocalization to BCR membrane activation complexes. Confocal microscopy on primary cultures was done using a TCL1 monoclonal antibody (fluorescein isothiocyanate, green) in combination with AKT1/2, LYN, ZAP70, or SYK polyclonal antibodies (Cy3, red). Depicted are images from the 2-hour time point (C-E), which best distinguishes pAKT responders and correlated most strongly with the differential growth response seen at 48 hours, as in Figure 3A. (A) In tonsillar B cells, TCL1 and AKT showed a predominantly cytoplasmic distribution without apparent colocalization at baseline (or with CD40L stimulation), but recruitment of TCL1 and AKT to membrane complexes after continuous BCR engagement. AKT/TCL1 colocalization had a punctate pattern at 2 hours, with uniform membrane staining at 24 hours. (B) A representative CLL case with a hyperresponsive growth pattern showed a similar rapid localization of TCL1 and AKT to the membrane as early as 15 minutes after BCR stimulation, with persistence of TCL1-AKT complexes for up to 4 days, including nuclear complexes at these later time points. Apoptotic cells were apparent by 24 hours in those cultures from hyperresponsive cases. (C) BCR-induced TCL1 membrane complexes (left column, single cells) colocalize with the BCR-associated kinases LYN, SYK, and ZAP70 within 2 hours of BCR stimulation (control condition shown in inset with +, #, and *, respectively, marking cells shown in enlarged images). (D) A representative CLL case with dose-dependent growth response to BCR engagement showed delayed but strong recruitment of TCL1 (Cy3, red in top panel) and AKT (Cy3, red) to discrete BCR-containing (CD79a in fluorescein isothiocyanate, green in top panel) membrane activation foci along with TCL1/AKT colocalization (middle row), as well as LYN, ZAP70, and pPKC corecruitment (bottom rows). (E) An absence of TCL1-AKT membrane complexes is noted in CLL with no growth response to BCR engagement. (F) Immunoblots of subcellular fractions (left panel) and subsequent spin column eluates (right panel, molecular weight cutoff > 30 kDa) from the same BCR responder as depicted in Figure 4B confirm the enrichment of phospho-activated AKT and to a lesser degree ZAP70 along with complexed TCL1 (14 kDa for monomeric TCL1) in the membrane compartment at 2 hours of successful BCR stimulation. The altered migration properties of CCR4's membrane associated form served as separation control. (G) Western blot analysis of activation complexes detected by AKT immunoprecipitation was performed after 48 hours of BCR stimulation in a BCR-responsive CLL (left) and a nonresponsive case (right). AKT kinase activity was tested on the immunoprecipitated complexes by assaying phosphorylation of an exogenous GSK3α/β substrate. An α-IgM dose-dependent increase in levels of coimmunoprecipitated pAKT, AKT kinase activity, and complexed ZAP70 was detected in the BCR-responsive case, but not in the nonresponder. Coimmunoprecipitated TCL1 was only detected in the BCR responder. Total TCL1 levels in the lysates from both cultures were similar (bottom panel).
Growth responses of CLL cultures to BCR engagement correlate with kinetics of TCL1 and AKT colocalization to BCR membrane activation complexes. Confocal microscopy on primary cultures was done using a TCL1 monoclonal antibody (fluorescein isothiocyanate, green) in combination with AKT1/2, LYN, ZAP70, or SYK polyclonal antibodies (Cy3, red). Depicted are images from the 2-hour time point (C-E), which best distinguishes pAKT responders and correlated most strongly with the differential growth response seen at 48 hours, as in Figure 3A. (A) In tonsillar B cells, TCL1 and AKT showed a predominantly cytoplasmic distribution without apparent colocalization at baseline (or with CD40L stimulation), but recruitment of TCL1 and AKT to membrane complexes after continuous BCR engagement. AKT/TCL1 colocalization had a punctate pattern at 2 hours, with uniform membrane staining at 24 hours. (B) A representative CLL case with a hyperresponsive growth pattern showed a similar rapid localization of TCL1 and AKT to the membrane as early as 15 minutes after BCR stimulation, with persistence of TCL1-AKT complexes for up to 4 days, including nuclear complexes at these later time points. Apoptotic cells were apparent by 24 hours in those cultures from hyperresponsive cases. (C) BCR-induced TCL1 membrane complexes (left column, single cells) colocalize with the BCR-associated kinases LYN, SYK, and ZAP70 within 2 hours of BCR stimulation (control condition shown in inset with +, #, and *, respectively, marking cells shown in enlarged images). (D) A representative CLL case with dose-dependent growth response to BCR engagement showed delayed but strong recruitment of TCL1 (Cy3, red in top panel) and AKT (Cy3, red) to discrete BCR-containing (CD79a in fluorescein isothiocyanate, green in top panel) membrane activation foci along with TCL1/AKT colocalization (middle row), as well as LYN, ZAP70, and pPKC corecruitment (bottom rows). (E) An absence of TCL1-AKT membrane complexes is noted in CLL with no growth response to BCR engagement. (F) Immunoblots of subcellular fractions (left panel) and subsequent spin column eluates (right panel, molecular weight cutoff > 30 kDa) from the same BCR responder as depicted in Figure 4B confirm the enrichment of phospho-activated AKT and to a lesser degree ZAP70 along with complexed TCL1 (14 kDa for monomeric TCL1) in the membrane compartment at 2 hours of successful BCR stimulation. The altered migration properties of CCR4's membrane associated form served as separation control. (G) Western blot analysis of activation complexes detected by AKT immunoprecipitation was performed after 48 hours of BCR stimulation in a BCR-responsive CLL (left) and a nonresponsive case (right). AKT kinase activity was tested on the immunoprecipitated complexes by assaying phosphorylation of an exogenous GSK3α/β substrate. An α-IgM dose-dependent increase in levels of coimmunoprecipitated pAKT, AKT kinase activity, and complexed ZAP70 was detected in the BCR-responsive case, but not in the nonresponder. Coimmunoprecipitated TCL1 was only detected in the BCR responder. Total TCL1 levels in the lysates from both cultures were similar (bottom panel).
Among the 9 CLL that showed more gradual pAKT phospho-activation and dose-dependent growth stimulation, there was a delayed but ultimately robust recruitment of TCL1 and AKT to the BCR, along with LYN, SYK, ZAP70, and pPKC (Figure 4D). These discrete membrane foci resembled the BCR supramolecular activation complexes seen in tonsillar B cells (ie, Figures 4D vs Figure 4A). Three CLLs with no growth responses after BCR engagement showed absent or greatly delayed TCL1-AKT membrane recruitment and showed only weak TCL1-AKT colocalization after CD40/IL-4 stimulation (Figure 4E).
Immunoprecipitation of AKT performed after 2 hours of α-IgM stimulation in 10 cases confirmed that BCR engagement drove the physical association of TCL1 and AKT and increases in AKT kinase activity, as indicated by increased GSK3 substrate phosphorylation. Subcellular fractionation studies and size exclusion chromatography further confirmed the AKT/TCL1 enrichment and colocalization in the membrane compartment after effective BCR stimulation (Figure 4F). The amount of pAKT, TCL1, and ZAP70 as well as the level of AKT kinase activity detected in the AKT immunoprecipitates after 48 hours of BCR stimulation (n = 7) correlated positively with the degree of the growth response at that time (Figure 4G). TCL1 showed no association with AKT in BCR nonresponders (Figure 4G) or after CD40/IL-4-induced AKT phospho-activation (not shown).
High TCL1 levels in CLL mark an aggressive disease course and independently predict poor response to therapy
To assess the connection between in vitro BCR responsiveness and clinical behavior, we correlated the functional properties seen in culture with outcomes and clinical predictors of the same cases. Although the level of pAKT induction (2 hours) or growth response (48 hours) in cultured cells correlated with multiple aggressive disease features (Table 1), baseline TCL1 levels were the most highly correlated with clinical predictors and outcome. In that regard, CLLs with high TCL1 expression were associated with higher WBCs at presentation (P < .001; Figure 5A), higher peak WBCs in treated patients (P = .004), higher WBCs at relapse in the 33 cases with serial TCL1 measurements (P = .002), and peak WBCs for the 11 patients who never received any treatment (P = .007, Figure 5B). TCL1 levels also positively correlated with advanced clinical stage, shorter LDT, higher serum β-2 microglobulin, chromosome 11q22-23 genomic deletion, and levels of expression of CD20 and CD38 (Table 2).

Higher TCL1 expression is associated with higher WBC and predicts poor clinical outcome, regardless of treatment. (A) Median and range of WBC at diagnosis in all 70 patients were significantly higher in CLLs with moderate or strong TCL1 expression compared with the TCL1-dim/negative cases. (B) Among untreated patients, CLL cases that strongly expressed TCL1 developed higher peak WBCs. (C) Higher TCL1 levels correlated with shorter PFS among all 59 treated patients and (D) with shorter OS in all 70 cases studied in culture. (E) PFS was shorter for patients with high-level TCL1 carrying tumors for both the 34 cases treated upfront with 1- or 2-drug fludarabine-containing regimens and (F) for the 22 cases treated with frontline 3- or 4-drug chemo-immunotherapy regimens.
Higher TCL1 expression is associated with higher WBC and predicts poor clinical outcome, regardless of treatment. (A) Median and range of WBC at diagnosis in all 70 patients were significantly higher in CLLs with moderate or strong TCL1 expression compared with the TCL1-dim/negative cases. (B) Among untreated patients, CLL cases that strongly expressed TCL1 developed higher peak WBCs. (C) Higher TCL1 levels correlated with shorter PFS among all 59 treated patients and (D) with shorter OS in all 70 cases studied in culture. (E) PFS was shorter for patients with high-level TCL1 carrying tumors for both the 34 cases treated upfront with 1- or 2-drug fludarabine-containing regimens and (F) for the 22 cases treated with frontline 3- or 4-drug chemo-immunotherapy regimens.
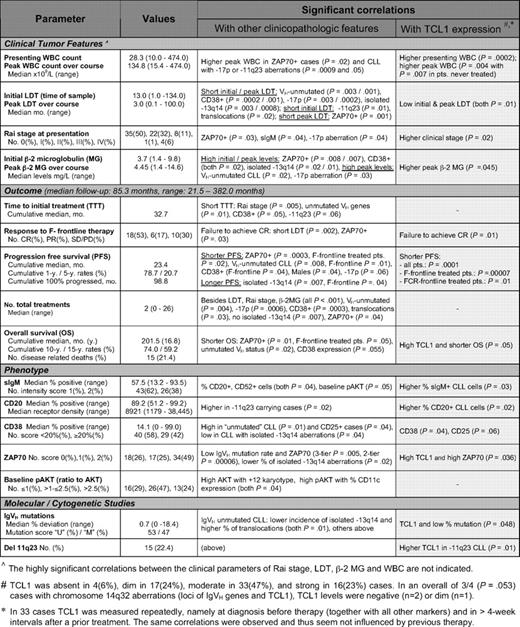
Clinicopathologic features including TCL1 protein levels and their associations in the 70-case study set of BCR-stimulated CLL
Higher TCL1 levels correlated with shorter PFS (P < .001, Figure 5C) in the 59 treated patients and inferior OS (P = .05, Figure 5D) in all 70 cases. This association was observed for those patients receiving 1- or 2-drug fludarabine-containing regimens (P < .001, Figure 5E) as well as those treated with intensive 3- and 4-drug chemo-immunotherapies (P = .01, Figure 5F). In patients treated with these more aggressive regimens, the molecular markers that generally predict shorter PFS in CLL, such as unmutated IGHV status, -17p and -11q22-23 aberrations, and CD38 or ZAP70 expression,32,33 were not predictive of outcome, in contrast to TCL1 (Table 2).
Multivariate analyses, including all of the factors included in Table 2, revealed that high TCL1 and ZAP70 and male sex operated as independent variables predicting a shorter PFS (Table 3). For OS, the 3 significant parameters were IGHV mutational status (relative risk [RR] = 4.83, SE = 0.78, P = .04), TCL1 score, and ZAP70 status, which overrode other clinical parameters, including age. A 3-tier TCL1/ZAP70 sum score (high, sum 4 or 5; mid, sum 2 or 3; and low, sum 0 or 1; RR = 4.59, SE = 0.57, P = .007) eliminated IGHV status in the Cox model of OS and also identified better and worse PFS prognostic groups and a distinct intermediate-risk subset than the single parameters alone (not shown).
Significant factors predicting short PFS in multivariate analysis of clinical, phenotypic, and molecular prognostic features in the subset of 59 treated CLL patients
| Prognostic factor | Risk of disease progression or death (PFS) | ||
|---|---|---|---|
| Relative risk | SE | P | |
| ZAP70+* | 3.85 | 0.59 | .021 |
| High TCL1 | 3.28 | 0.52 | .021 |
| Male sex | 2.14 | 0.42 | .045 |
| Prognostic factor | Risk of disease progression or death (PFS) | ||
|---|---|---|---|
| Relative risk | SE | P | |
| ZAP70+* | 3.85 | 0.59 | .021 |
| High TCL1 | 3.28 | 0.52 | .021 |
| Male sex | 2.14 | 0.42 | .045 |
A 3-tier ZAP70 score (0 indicates absent; 1, weak; and 2, strong) as a better predictor than “positive” versus “negative” led to the elimination of male sex in this Cox hazard model; ZAP70 (0 vs 1 vs 2): RR = 2.58, SE = 0.28, P < .001 with the remaining factor, high TCL1: RR = 3.75, SE = 0.5, P = .009.
Discussion
In a large series of CLLs, we show that the pattern of response to BCR engagement is highly correlated with cellular levels of the lymphoid oncogene TCL1 and the formation of activation complexes at the BCR that include TCL1, AKT, and membrane-proximal tyrosine kinases, such as ZAP70. In particular, a robust growth response after BCR engagement is associated with early and strong AKT phospho-activation in tumors with high TCL1 levels. The rapid formation of TCL1-AKT complexes at the BCR signified a hyperresponsive growth/apoptotic response in cultured CLL cells similar to the pattern in nonneoplastic B cells. The CLL cases with high TCL1 also showed more aggressive growth features in vivo, including advanced clinical stage, higher WBCs, and shorter LDT. The CLL cases that strongly expressed TCL1 were associated with poor response to all therapy types, with TCL1 levels as an independent predictor of outcome in multivariate models.
Our work and that of others have shown that TCL1 is dysregulated as an oncogene in T-cell leukemias,21,34-36 whereas in B-cell lymphomas TCL1 displays a developmentally regulated expression pattern, with progressive silencing in tumors of GC and especially after GC derivation. We demonstrated earlier that TCL1 shows a differential expression in pre-GC CLL that is largely correlated with other markers of that subset, such as ZAP70 and 11q22-23 genomic deletion.20 In this independent CLL cohort, we confirm this strong association of high TCL1 levels with immunophenotypic (ie, ZAP70 expression) and genetic markers (ie, del 11q22-23) of the more aggressive pre-GC CLL subset.
Active BCR signaling in CLL has been previously shown to be associated with recruitment of regulatory kinases to growth-promoting membrane complexes.11-17 Important modulators of the BCR signal include ZAP70 and its downstream target AKT. Activation of the serine/threonine kinase AKT is particularly central to survival regulation because it integrates milieu-derived signals through a variety of pathways, including the BCR.37-39 Based on cotransfection and cell culture studies, the transforming effects of TCL1 appear to be mediated through an activating interaction with the pleckstrin homology domain of the AKT kinase.22,23 Effects of TCL1 on growth factor signaling through PKC, particularly a role for PKC-β, in the development of TCL1-driven CLL-like tumors in mice have also been demonstrated.40,41 We show here in primary CLL cells that AKT directly associates with TCL1 and that this association is induced and stabilized by an effective BCR signal.
The finding that the growth response at 48 hours after BCR engagement is highly correlated with early AKT activation, which in turn was strongly predicted by the cellular levels of TCL1, highly suggests that TCL1 is a direct modulator (or “rheostat”) of this response in CLL. Furthermore, the growth versus apoptotic response of CLL cells to BCR hyperstimulation appears largely dependent on TCL1 levels. In this set of cases, increased TCL1 levels were a much stronger predictor of BCR responsiveness than MAPK activation or ZAP70 positivity. Experimental introduction of TCL1 into a previously TCL1− mature B-cell line also augmented the BCR-induced phospho-AKT response. Overall, these data suggest that TCL1 levels may represent the best signature yet identified to predict the BCR-responsive subset of CLL.12,14-17,42-44
The factors driving high-level expression of TCL1 in CLL are still under investigation, but they probably include epigenetic regulation resulting from microRNA down-regulation45 and transcriptional mechanisms resulting from cytokine-responsive TCL1 promoter elements,46-48 but not chromosome translocation or TCL1 genomic amplification.49 We have previously reported in CLL and other B-cell tumors that TCL1 levels often show striking intratumoral variations, which are correlated with proliferative state.20,29 Here, we note that these observed variations in TCL1 protein levels are restricted to BCR-responsive CLLs, suggesting that they may be predominantly driven by posttranslational causes, such as protection of TCL1 protein in long-lived AKT activation complexes. Although further study is needed, it is probable that much of the observed variations in TCL1 levels reflect the underlying dynamics of the transient signaling complexes that form after growth factor receptor engagement and/or tonic BCR signaling.
This study demonstrates that, although TCL1 levels are highly correlated with BCR responsiveness in vitro, they are also strongly correlated with in vivo proliferative capacity as assessed by tumor burden (WBC count at all phases of disease) and markers of increased cell turnover (ie, β-2 microglobulin). The association of TCL1 with high WBC was even observed for peak WBCs developing in early-stage patients who had been never treated over their entire course. Here, a differential TCL1 expression seems to indicate a variable tumor growth activity, even among these indolent cases. Furthermore, in contrast to other markers of the aggressive pre-GC CLL subset, such as ZAP70, high TCL1 levels in our study were also correlated with inferior response to highly effective multiagent chemo-immunotherapy regimens such as fludarabine, cyclophosphamide, and rituximab,50 as well as to less aggressive 1- or 2-agent therapies. This may reflect, in addition to the TCL1-associated inherently more robust growth capacity, an aspect of a TCL1-mediated apoptotic resistance toward therapy.
In conclusion, TCL1 contributes to the pathogenesis of CLL as a regulator of signaling strength of BCR-induced proximal kinase cascades. As a marker of BCR responsiveness of CLL, TCL1 determines the degree of pAKT activation and the cellular outcome of such antigen receptor engagement. The demonstration here that TCL1 can participate in and regulate growth-promoting BCR-associated kinase complexes suggests new therapy options to improve outcomes in TCL1-expressing CLL. In particular, profiling of TCL1 levels can be applied to identify the BCR-responsive subset of CLL and help select cases where the use of kinase inhibitors and other BCR/AKT/PKC-pathway modulators may be beneficial.
The online version of this article contains a data supplement.
The publication costs of this article were defrayed in part by page charge payment. Therefore, and solely to indicate this fact, this article is hereby marked “advertisement” in accordance with 18 USC section 1734.
Acknowledgments
This work was supported by the CLL Global Research Foundation (D.J., M.H.), the National Cancer Institute (grant CA16672; D.J.), and a Deutsche Forschungsgemeinschaft stipend (HE3553/2-1) and Deutsche Krebshilfe Max-Eder Nachwuchsgruppe award (both M.H.).
National Institutes of Health
Authorship
Contribution: M. Herling designed and performed experiments, analyzed data, and wrote the manuscript; K.A.P. designed and performed experiments; N.W. and N.L. performed experiments; M. Hallek reviewed experimental design; M.J.K. reviewed experimental design and was the principal clinical investigator; and D.J. designed experiments, analyzed data, and wrote the manuscript.
Conflict-of-interest disclosure: M. Herling and D.J. have commercial interests in the reported TCL1 antibody. The remaining authors declare no competing financial interests.
Correspondence: Dan Jones, Department of Hematopathology, Box 72, University of Texas M. D. Anderson Cancer Center, 1515 Holcombe Blvd, Houston, TX 77030; e-mail: dajones@mdanderson.org.

This feature is available to Subscribers Only
Sign In or Create an Account Close Modal