The behavior of classic Hodgkin lymphoma (cHL) is determined by both the intrinsic features of the tumor cells and the characteristics of the microenvironment, making the analysis of entire lymph nodes an effective approach to understanding the disease. We examined the influence of our previously reported 25-microRNA signature for cHL on clinical outcome in 89 homogeneously treated cHL patients with a median follow-up of 80 months. Patients with low miR-135a expression had a higher probability of relapse (P = .04) and a shorter disease-free survival (P = .02). Functional analysis of cHL cell lines showed that mature miR-135a levels increased after pre–miR-135a transfection, causing apoptosis and decreased cell growth. Target analysis showed a direct regulation by miR-135a of JAK2, a cytoplasmic tyrosine kinase involved in a specific subset of cytokine receptor signaling pathways. miR-135a–mediated JAK2 down-regulation led to decreased mRNA and protein levels of the antiapoptotic gene Bcl-xL, suggesting a role for Bcl-xL in miR-135a/JAK2–mediated apoptosis. Our findings confirm the critical role of miR-135a in the survival of cHL cells and in the prognosis of cHL patients, indicating that novel treatment approaches targeting miR-135a may potentially benefit these patients.
Introduction
Classic Hodgkin lymphoma (cHL) is a B-cell neoplasm characterized by the presence of relatively few tumor cells (Hodgkin/Reed-Sternberg cells) in a nonneoplastic microenvironment. The behavior of cHL is determined by the intrinsic features of the Hodgkin/Reed-Sternberg cells and by the characteristics of the nonneoplastic inflammatory cell infiltrate.1 The cells from the inflammatory infiltrate form a complex network of cytokines and chemokines that provide a permissive microenvironment. Some of the cytokines and chemokines secreted by the Hodgkin/Reed-Sternberg cells may act as autocrine growth factors for the Hodgkin/Reed-Sternberg cells,2,3 whereas others appear to modulate the immune microenvironment.4,–6
The Janus kinase/signal transducer and activator of transcription (JAK/STAT) pathway is a common signaling pathway used by many cytokines. The JAK family has 4 members,7 but JAK2 is the predominant JAK activated in response to type I cytokine ligands (erythropoietin, granulocyte macrophage–colony-stimulating factor, thrombopoietin, growth hormone, prolactin, interleukin-3, and interleukin-5).8,9 When a cytokine binds to its cell-surface receptor, it activates the dimerization of the receptor, which has constitutively associated JAK tyrosine kinases. The 2 JAK proteins then phosphorylate each other and act as activated tyrosine kinases that phosphorylate the receptor, allowing the binding and phosphorylation of cytoplasmic STAT proteins. There are 7 STATs, all with a DNA-binding domain. STAT3 and STAT5 are the preferred downstream targets of phosphorylated JAK2.10 The phosphorylated STATs form dimers, leave the receptor, and translocate to the nucleus, where they act as transcription factors that regulate target gene expression related to cell survival, proliferation, angiogenesis, and immune evasion.11,,–14 Bcl-xL is an antiapoptotic gene whose expression is induced by STAT5 DNA binding, and activation of the JAK2/STAT5 pathway can modulate apoptosis and survival through Bcl-xL expression.15
JAK/STAT signaling is regulated at many steps through distinct mechanisms, and deregulation of this pathway is associated with several immune diseases and neoplasms. At the posttranslational level, key regulators include the suppressor of cytokine signaling (SOCS) proteins and the inhibitors of activated STAT.16 Mutations and amplification have been detected at different levels of this pathway in JAK2,17,–19 STATs, and SOCS.20 However, although activating mutations have been found in JAK2 in myeloid neoplasms, the expression of JAK2 in primary mediastinal large B-cell lymphomas and cHL is not the result of mutations,21 although constitutive activation of STATs has been found.22
At the pretranslational level, microRNAs (miRNAs) play an important role in the regulation of protein levels. miRNAs are small endogenous RNAs that regulate gene expression by binding to the downstream (3′-untranslated region [UTR]) of target mRNAs and inhibiting their translation to protein.23,24 miRNAs play a role in tumor pathogenesis by regulating the expression of oncogenes and tumor supressor genes in a sequence-complementary manner.25,26 Several studies in cell lines have identified miRNAs that are characteristic of cHL,27,–29 and we have previously identified a 25-miRNA signature in cHL patient lymph nodes.30
The analysis of both tumor cells and the microenvironment can be an effective approach to understanding the behavior of cHL. To identify biologic prognostic markers that could add value to standard clinical factors,1 we examined the influence of our 25-miRNA signature for cHL30 on outcome in 89 homogeneously treated cHL patients with a median follow-up of 80 months.
Methods
Patients
Eighty-nine adult patients diagnosed with cHL at a single institution between September 1995 and June 2005 were included in the analysis. We had previously examined miRNA expression in tumor samples from these patients30 ; in the present study, we have correlated miRNA expression with clinical outcome. Median age was 29 years, and 47% were male. Seven patients (8%) were HIV+; 79% had nodular sclerosis and 21% had mixed cellularity histology. Using criteria previously described,30 Epstein-Barr virus was present in 28% of the samples. First-line treatment consisted of adriamycin, bleomycin, vinblastine, and dacarbazine or equivalent schedules in 97% of patients. Of 89 patients, 76 (85%) achieved complete remission, 5 (6%) had partial remission, and 8 (9%) were chemoresistant. After a median follow-up of 80 months (range, 7-180 months), overall survival was 84% and disease-free survival was 80% (Table 1). Approval for this study was obtained from the Institutional Review Board of Hospital Clinic, Barcelona. Informed consent was obtained in accordance with the Declaration of Helsinki.
Main clinical characteristics and outcomes of cHL patients (N = 89)
| Characteristic . | No. (%) . |
|---|---|
| Median age, y (range) | 29 (13-89) |
| 45 or older | 15 (17) |
| Sex, male/female | 42/47 (47/53) |
| Histology | |
| Nodular sclerosis | 70 (79) |
| Mixed cellularity | 19 (21) |
| EBV+ | 25 (28) |
| HIV+ | 7 (8) |
| B symptoms | 36 (40) |
| Bulky mass | 21 (24) |
| Anemia (Hb < 105 g/L) | 16 (18) |
| Leukocytosis, > 15 × 109/L | 12 (13) |
| Lymphocytopenia, < 0.6 × 10⁹/L or < 8% of WBCs | 10 (11) |
| Hypoalbuminemia, < 40 g/L | 24 (29) |
| High LDH, > 450 UI/L | 29 (33) |
| High β2-microblobulin, > 2.5 mg/dL | 15 (17) |
| Stage | |
| I-II | 54 (61) |
| III-IV | 35 (39) |
| Hasenclever index ≥ 3* | 16 (27) |
Calculated only in 59 patients with advanced disease (stages III-IV, B symptoms, or bulky mass).
Cell culture and transfection
The cHL cell lines L-428, L-1236, and HDMYZ were cultured in RPMI 1640 containing 10% fetal calf serum (Invitrogen). Transfection of 50 nM and 100 nM of pre–miR-135 and pre-miRNA precursor Negative Control (Applied Biosystems/Ambion) in L-428 and L-1236 were performed by nucleofection (Amaxa Biosystems) using solution L and program X-001 and solution V and program T-001, respectively, as recommended by the manufacturer. HDMYZ was transfected using Lipofectamine 2000 (Invitrogen) as per the manufacturer's protocol. The expression levels of miR-135a considerably increased 24 hours after pre–miR-135a transfection in all 3 cell lines (supplemental Figure 1, available on the Blood website; see the Supplemental Materials link at the top of the online article).
Apoptosis and proliferation assays
Caspase 3 and 7 activities in L-428 cells transfected with pre–miR-135 or with pre-miRNA precursor Negative Control were directly measured at 24 and 48 hours after transfection using a CaspaseGlo 3/7 kit (Promega) as per the manufacturer's protocol. On coated 96-well plates, 10 000 cells/well were plated and CaspaseGlo reagent was added and incubated for 1 hour at room temperature in the dark. Relative light intensity was measured in each well using a Veritas microplate luminometer (Turner Biosystems).
On coated 12-well plates, 100 000 cells/well were plated 24 hours after transfection. The numbers of cells were counted in a Neubauer chamber at 72 hours.
Western immunoblotting
Total protein from all 3 cell lines was isolated using QIAGEN Qproteome Mammalian Protein Prep Kit according to the manufacturer's protocol. Equal amounts of protein (50 μg) were separated by sodium dodecyl sulfate–polyacrylamide electrophoresis in 7.5% Tris-HCl polyacrylamide gels and transferred to pure nitrocellulose membranes (Trans-Blot Transfer Medium, Bio-Rad). Membranes were incubated with mouse monoclonal antibodies against JAK2 (Abcam), JAK3 (Abcam), phospho-STAT5 (Tyr694; Cell Signaling Technology) Bcl-xL (Santa Cruz Biotechonology), and α-tubulin (Sigma-Aldrich). Antibody binding was revealed by incubation with antimouse IgG peroxidase conjugate secondary antibodies (Sigma-Aldrich). Chemiluminescence was detected using SuperSignal West Pico Chemiluminescent Substrate (Pierce Biotechnology) and read in Chemidoc System (Bio-Rad). The protein density of the bands was quantified using Quantity One software, Version 4.2.6, and relative quantification was calculated with reference to the α-tubulin signal.
RNA extraction and miRNA quantification
RNA was extracted from the cell lines using Trizol total RNA isolation reagent (Invitrogen) as per the manufacturer's protocol. TaqMan quantitative reverse-transcribed polymerase chain reaction miRNA assay of miR-135a was used to quantify miR-135a expression levels, as previously described,30 using an Applied Biosystems 7500 Sequence Detection System and RNU6B as endogenous control.
BCL-xL mRNA analysis
Total cDNA was synthesized from total RNA using the High Capacity cDNA Reverse Transcription Kit (Applied Biosystems) as per the manufacturer's protocol. Polymerase chain reaction was performed using the following primers for BCL-xL: 5′-ATGTCTCAGAGCAACCGGGAG-3′ and 5′-TTCCGACTGAAGAGTGAGC-3′.
Renilla luciferase reporter vector
Two 48-bp synthetic oligonucleotides, containing from 5′ to 3′: XhoI sticky end (5 bp), a fragment from the 3′UTR of Jak2 gene containing the miR-135a target sequence (35 bp), BglII restriction site (6 bp), and NotI sticky end (2 bp), were cloned in the psiCheck2 vector (Promega) in the 3′UTR of Renilla luciferase gene. The 2 oligonucleotides sense (5′-TCG AG TC ATG AAC TAA ATT TAA GCT TAA GCC ATA AAA TAG AGA TCT GC-3′) and antisense (5′-GGC CGCAGA TCT CTA TTT TAT GGC TTA AGC TTA AAT TTA GTT CAT GA C-3′) were first annealed with a Tris buffer (100 mM Tris HCl, pH 7.5, 1 M NaCl, 10 mM ethylenediaminetetraacetic acid) in a heating block at 95°C for 5 minutes, followed by a gradual reduction of temperature until room temperature. The psiCheck2 vector was linearized by digestion with NotI and XhoI (New England Biolabs) and purified from an agarose gel. The annealed oligonucleotides were ligated in the linearized psiCheck2 vector into the NotI and XhoI cloning sites located in the downstream of the Renilla luciferase reporter gene with T4 DNA ligase (New England Biolabs). The ligation reaction was transformed in TOP10F′ Escherichia coli competent cells (Invitrogen). Positive clones were selected by restriction digestion with BglII and reconfirmed by sequencing.
The 3 cell lines were transfected with 0.2 μg of the modified psiCheck2 vector containing the insert with 500 nM of pre-miR-135 or pre-Mir Negative Control. The Renilla luciferase and Firefly luciferase activity was measured at 48 hours after transfection with the Promega Dual luciferase reporter assay system (Promega) in a Veritas microplate luminometer. The empty psiCheck2 vector was used as negative control, and the transfection efficiency was normalized with the Firefly luciferase gene.
Statistical analysis
All statistical analyses were performed with BRB Array Tools (Biometric Research Branch, National Cancer Institute, National Institutes of Health; http://linus.nci.nih.gov/BRB-ArrayTools.html), SPSS 14.0, and R software (Version 2.6.0). Class comparison and Student t test were used to analyze differences between groups. The clinical outcomes of relapse rate and disease-free survival, as defined by Cheson et al,31 were analyzed using the Survival Analysis tool (Find genes correlated with survival) from BRB Array Tools. miR-135a expression was dichotomized using maxstat package of R,32 and survival curves were drawn using the Kaplan-Meier method. Sex, age (≥ 45 years vs < 45 years), World Health Organization classification, extent of disease (limited vs advanced), and miR-135a expression level (low vs high) were included in the Cox multivariate regression analysis of disease-free survival.
Results
Clinical outcome and miR-135a expression
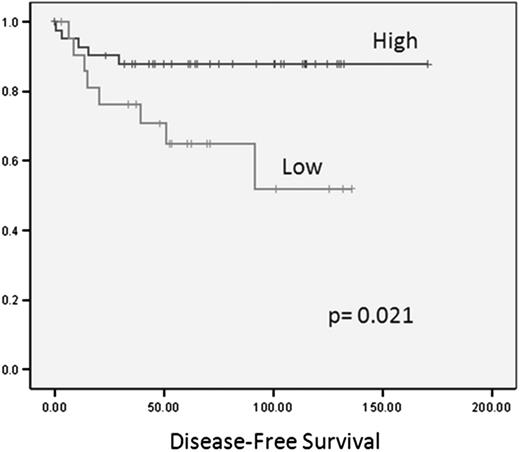
As previously reported,30 miR-135a was down-regulated in the cHL samples compared with the reactive lymph nodes (P < .001). When we analyzed the correlation between clinical outcome and the expression of the 25 miRNAs included in the cHL signature in the primary tumors of 89 cHL patients, only miR-135a expression correlated with disease-free survival. Using the cutoff selected by maxstat, we divided the 64 patients who had attained complete response into 2 groups according to their miR-135a expression levels. Forty-two patients with high miR-135a expression had a longer disease-free survival (151 months; 95% confidence interval, 135-167 months) than the 22 with low miR-135a expression (90 months; 95% confidence interval, 66-115 months; P = .02; Figure 1). Thirty-six percent of patients with low miR-135a levels relapsed, compared with only 12% of those with high levels (P = .046). No significant association was observed between miR-135a expression and overall survival. In the multivariate analysis, only miR-135a expression emerged as a prognostic factor for disease-free survival (relative risk = 3.41, P = .034).
A greater down-regulation of miR-135a was also observed in the 3 cHL cell lines (L-428, L-1236, HDMYZ), containing only tumor cells, than in the reactive lymph nodes (P = .007; supplemental Figure 2A). These results are in line with data in the mammalian miRNA expression atlas33 (smiRNAdb, http://www.mirz.unibas.ch/smiRNAdb), which includes 2 additional cHL cell lines, L591 and KMH2 (supplemental Figure 2B).
miR-135a and apoptosis and proliferation in cell line L-428
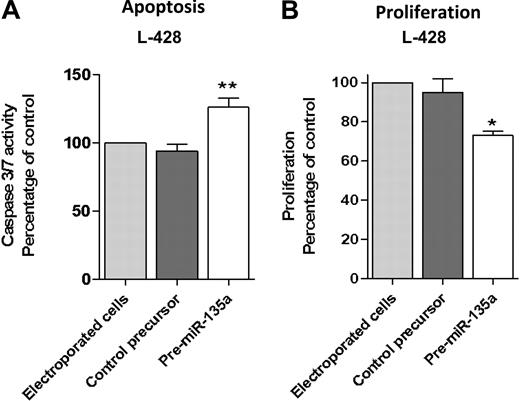
To further investigate the correlation between miR-135a and clinical outcome, we transfected the cHL cell line L-428 with pre–miRNA-135 to increase the low miR-135a levels and then examined repercussions on apoptosis and proliferation. Transfection with pre–miR-135 increased apoptosis. Analysis at 48 hours after transfection showed that caspase 3/caspase 7 activity was 36% higher than in control cells (P < .01; Figure 2A). Along the same lines, the proliferation assay showed that pre–miR-135–transfected cells grew less than control cells transfected with pre-miRNA precursor negative control (P < .05; Figure 2B).
Apoptosis and proliferation analysis after pre-miR-135 transfection in the L-428 cell line. (A) Analysis at 48 hours after transfection showed that caspase 3/caspase 7 activity was 36% higher than in control cells, transfected with pre–miR-negative control (**P < .01). (B) The proliferation assay at 72 hours showed that pre–miR-135–transfected cells grew less than control cells transfected with pre-miRNA precursor-negative control (*P < .05).
Apoptosis and proliferation analysis after pre-miR-135 transfection in the L-428 cell line. (A) Analysis at 48 hours after transfection showed that caspase 3/caspase 7 activity was 36% higher than in control cells, transfected with pre–miR-negative control (**P < .01). (B) The proliferation assay at 72 hours showed that pre–miR-135–transfected cells grew less than control cells transfected with pre-miRNA precursor-negative control (*P < .05).
JAK2 is a target of miR-135a
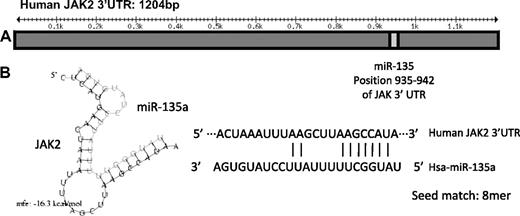
To further elucidate the mechanism by which miR-135a affected apoptosis and proliferation in cell line L-428 and clinical outcome in cHL patients, we first analyzed its putative targets using the TargetScan 4.2 database, which predicted 459 conserved targets for miR-135a. Of these 459 targets, we selected those whose down-regulation could increase apoptosis, and from the targets with the highest score, we focused on JAK2 because of its demonstrated importance in hematologic malignancies34 and its known role in cHL.35 The JAK2 gene has a 1256-bp 3′UTR region that presents an 8-mer binding site for miR-135a (Figure 3).
Schematic representation of the JAK2 3′UTR region and miR-135a binding. (A) miR-135a is predicted by TargetScan to target JAK2 mRNA in the position 935 to 942 of its 3′UTR region. (B) On the left, the predicted hybridization of miR-135a and JAK2 mRNA by the Pictar database. The minimum free energy required (mfe) for RNA hybridization is shown. On the right, the predicted hybridization of miR-135a and JAK2 mRNA by miRbase (seed sequence, 8mer).
Schematic representation of the JAK2 3′UTR region and miR-135a binding. (A) miR-135a is predicted by TargetScan to target JAK2 mRNA in the position 935 to 942 of its 3′UTR region. (B) On the left, the predicted hybridization of miR-135a and JAK2 mRNA by the Pictar database. The minimum free energy required (mfe) for RNA hybridization is shown. On the right, the predicted hybridization of miR-135a and JAK2 mRNA by miRbase (seed sequence, 8mer).
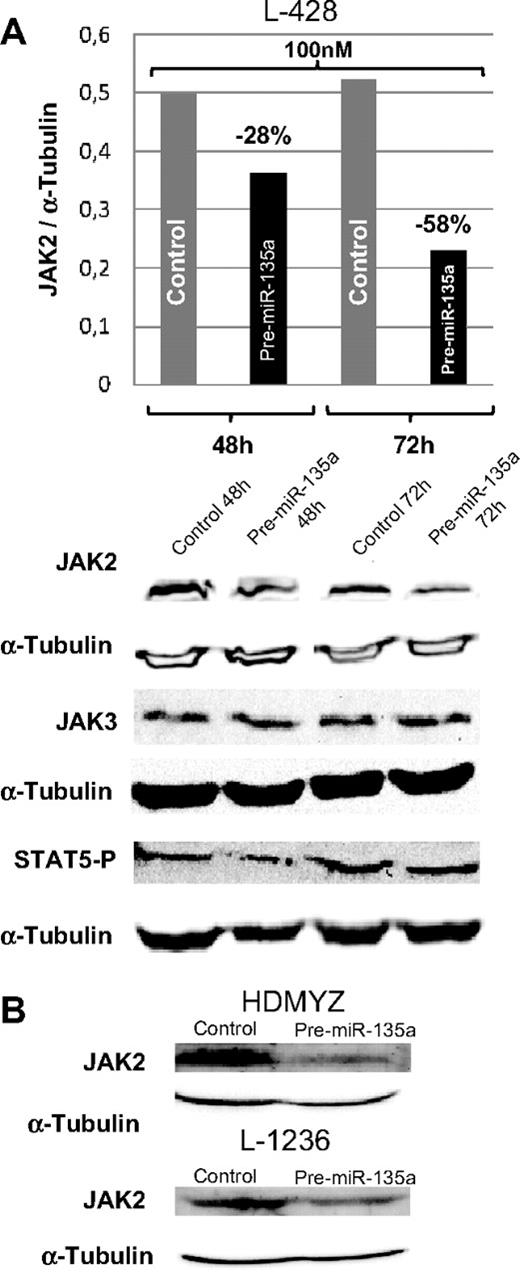
In cHL cell lines, miR-135a and JAK2 showed an opposing expression pattern; whereas miR-135a was unexpressed or expressed at very low levels, JAK2 protein was expressed at normal levels. To test whether miR-135a regulates JAK2 expression in cHL cell lines, we used pre–miR-135 to increase the miR-135a levels in the cell. The analysis of JAK2 protein levels at 48 and 72 hours after transfection showed a dose-dependent reduction of the protein expression by 28% (100 nM; 48 hours) and by 58% (100 nM; 72 hours; Figure 4A). These findings were then confirmed in the L-1236 and HDMYZ cell lines, where JAK2 decreased by 38% and 63%, respectively (Figure 4B).
Western blot analysis of JAK2 levels in cHL cells after transfection. (A) JAK2, JAK3, and STAT5 P levels in L-428 cells at 48 and 72 hours after transfection with 100 nM of pre-miRNA versus control cells. JAK3 was used as control for miR-135a specificity. In concordance with decreasing JAK2 levels, a slight decrease in levels of the downstream target phosphorylated STAT5 was observed. (B) Validation of the down-regulation effect produced by miR-135a on JAK2 in HDMYZ and L-1236 cHL cell lines.
Western blot analysis of JAK2 levels in cHL cells after transfection. (A) JAK2, JAK3, and STAT5 P levels in L-428 cells at 48 and 72 hours after transfection with 100 nM of pre-miRNA versus control cells. JAK3 was used as control for miR-135a specificity. In concordance with decreasing JAK2 levels, a slight decrease in levels of the downstream target phosphorylated STAT5 was observed. (B) Validation of the down-regulation effect produced by miR-135a on JAK2 in HDMYZ and L-1236 cHL cell lines.
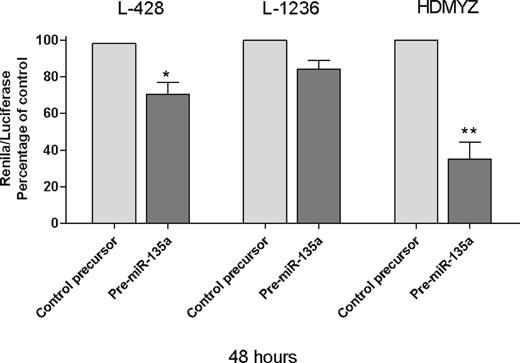
Finally, in the Renilla/luciferase assay, we inserted a 48-bp fragment containing the miR-135 recognition sequence of JAK2, in the 3′UTR of Renilla gene in psiCheck2 vector. When we transfected the cells with either this modified vector and pre–miR-135a or the modified vector and pre–miR-negative control, we found a 29.6% reduction in Renilla activity at 48 hours after transfection (P < .05; Figure 5), indicating that JAK2 is a direct target of miR-135a in cHL cells. These findings were then confirmed in the L-1236 and HDMYZ cell lines, where the reduction was 15.7% and 64.9%, respectively (Figure 5).
miR-135a mediates Bcl-xL expression through JAK2
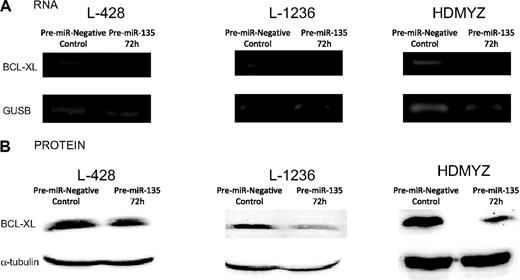
To investigate whether the apoptosis signal observed in the cHL cell lines was a result of JAK2 level modulation, we analyzed the Bcl-xL mRNA and protein levels in all 3 cell lines transfected with pre–miR-135 versus control cells. At 72 hours after transfection in the cells transfected with the pre-miRNA, we found a reduction in JAK2 protein that correlated with a reduction in the total amount of Bcl-xL mRNA (Figure 6A) and protein (Figure 6B), indicating an miR-135-JAK2–dependent apoptosis.
Bcl-xL expression analysis. (A) Reverse-transcribed polymerase chain reaction of Bcl-xL at 72 hours after transfection with 100 nM of pre-miR-135a. A reduction in Bcl-xL mRNA levels can be observed in the pre–miR-135–transfected cells versus the control cells. No change was observed in the β-glucuronidase (GUSB) mRNA levels, used as control. (B) Western blot analysis of Bcl-xL at 72 hours after transfection showed a correlation between BcL-xL mRNA and protein levels.
Bcl-xL expression analysis. (A) Reverse-transcribed polymerase chain reaction of Bcl-xL at 72 hours after transfection with 100 nM of pre-miR-135a. A reduction in Bcl-xL mRNA levels can be observed in the pre–miR-135–transfected cells versus the control cells. No change was observed in the β-glucuronidase (GUSB) mRNA levels, used as control. (B) Western blot analysis of Bcl-xL at 72 hours after transfection showed a correlation between BcL-xL mRNA and protein levels.
Discussion
JAK2 mutations are present in a variety of myeloproliferative disorders, resulting in tyrosine kinase activation, phosphorylation of STAT5, and expression of target genes, including Bcl-xL. To date, however, these mutations have not been observed in cHL patients.21 Recent studies have shown that JAK/STAT signaling is regulated at various steps, allowing control of signaling strength, duration, and specificity, and that deregulation of this pathway plays an important role in tumor pathogenesis.16
Genetic lesions are frequently found in cHL cells, including JAK2 gain36 and amplification17 and inactivating mutations in SOCS1,37 a negative regulator of JAK/STAT signaling. An activated JAK/STAT signaling pathway is a characteristic feature of cHL cells, conferring proliferation signals and protection against apoptosis.34 Our study provides strong evidence that miRNAs, specifically miR-135a, help to control the JAK/STAT signaling pathway and that miR-135a may function as a potential tumor suppressor through its target JAK2.
miR-135a is encoded in 2 genes: MIRN135A1 and MIRN135A2, located at 3p21.1 and 12q23.1, respectively. Although cytogenetic analysis of Hodgkin lymphoma is technically difficult, breakpoints in 3p21 and 12q23 can be found in cHL,38 which may explain the relatively low expression levels of miR-135a in cHL and interindividual differences in expression levels.
One of the major obstacles in cHL research is the small proportion of neoplastic cells in the tumor (2% of the total cellularity). We chose to examine miRNA expression of the entire cHL lymph node because of the proven importance of the microenvironment in this disease.1,5,39 Moreover, the constitutive activity of the JAK2/STAT pathway is caused not only by genetic lesions but also by cytokines, such as interleukin-13,2 produced by the Hodgkin/Reed-Sternberg cells and the microenvironment cells.6 For this reason, the analysis of miRNAs in the whole lymph node may be more appropriate than in selected Hodgkin/Reed-Sternberg cells, especially when correlating results with clinical outcome. With this approach, we have found that the differential miR-135a expression levels detected in the whole sample may be a clinical predictor of relapse, as patients with low miR-135a expression had a higher probability of relapse.
Notably, when examining miR-135a expression in the cHL cell lines, we observed that increased expression levels of miR-135a led to a decrease in JAK2 protein levels and, as a result, higher apoptosis rates and lower proliferation levels through the regulation of Bcl-xL expression (Figure 7 and supplemental Figure 3). The mRNA expression of Bcl-xL, a downstream protein in the JAK2/STAT5 pathway, is induced by phosphorylated STAT5 DNA binding. Bcl-xL is a prosurvival protein that appears up-regulated in some hematologic malignancies.40 Like BCR-ABL mutations, JAK2 mutations impair apoptotic response to DNA damage by altering the Bcl-xL deamidation pathway.41,42 The prevention of DNA damage–induced apoptosis by the inappropriate up-regulation of survival pathways is one of the hallmarks of cellular transformation and chemotherapy failure.43 These findings could explain the association between miR-135a expression levels and interindividual differences in relapse and disease-free survival observed in the cHL patients.
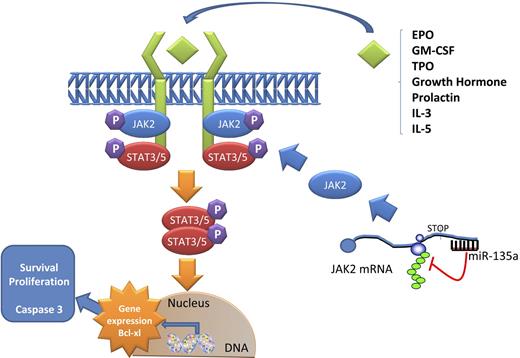
Model of JAK2/miR-135a–mediated survival signaling in L-428 cHL cells. The JAK/STAT pathway is used by many cytokines. When a ligand binds a receptor, a conformational change in the receptor allows 2 JAK2 proteins to phosphorylate each other and activate phosphorylation events that allow STAT proteins to form dimers. These dimers then translocate to the nucleus and activate specific transcription of specific genes, such as Bcl-xL, related to survival and proliferation. miR-135a plays a role in this pathway by regulating the translation of JAK2 protein.
Model of JAK2/miR-135a–mediated survival signaling in L-428 cHL cells. The JAK/STAT pathway is used by many cytokines. When a ligand binds a receptor, a conformational change in the receptor allows 2 JAK2 proteins to phosphorylate each other and activate phosphorylation events that allow STAT proteins to form dimers. These dimers then translocate to the nucleus and activate specific transcription of specific genes, such as Bcl-xL, related to survival and proliferation. miR-135a plays a role in this pathway by regulating the translation of JAK2 protein.
The JAK2/STAT signaling pathway has been a major focus of new drug development targeting JAK2 because it is mutated in a significant number of myeloproliferative disorders.44 Novel JAK2 inhibitors have been developed and tested, and some of them are now being studied in phase 1/2 clinical trials.45,46 The approach of using miRNAs as therapeutic tools to modulate JAK2 levels could be a useful approach, either alone or in combination with these new JAK2 inhibitors or with less specific tyrosine kinase inhibitors, such as imatinib or dasatinib.
In conclusion, we have identified miR-135a as a novel prognostic marker of relapse in cHL and shown that miR-135a modulates apoptosis and survival in L-428 cHL cells by targeting JAK2, which in turn affects Bcl-xL expression levels. Although our findings require validation in an independent patient cohort before definite conclusions can be drawn, they suggest that cHL may be amenable to new therapeutic approaches based on miR-135a expression.
The online version of this article contains a data supplement.
The publication costs of this article were defrayed in part by page charge payment. Therefore, and solely to indicate this fact, this article is hereby marked “advertisement” in accordance with 18 USC section 1734.
Acknowledgments
The authors thank Dr Kate Hodgson for her comments on previous versions of the manuscript.
This work was supported in part by the Spanish Ministry of Public Health (FISS-PI060087 and PI080095), the Servei de Donació de Cossos I Sala de Dissecció (SDCSD) of the School of Medicine of the University of Barcelona, and the Farreras-Valenti Foundation. T.D. is an FI fellow supported by Agencia de Gestió D'Ajuts Universitaris I de Recerca (AGAUR), Generalitat de Catalunya, and Fondo Social Europeo.
Authorship
Contribution: A.N. designed and performed the research, analyzed the data, and wrote the manuscript; T.D., A.P., C.C., and G.F. performed the research; A.M. designed the research; A.G. selected cases and analyzed the clinical data; B.G. performed statistical analysis; C.M. selected patients; E.M. wrote the paper; M.M. designed and supervised the research and wrote the paper; and all authors have seen and approved this final version of the manuscript and agree with the decision to submit.
Conflict-of-interest disclosure: The authors declare no competing financial interests.
Correspondence: Mariano Monzo, Human Anatomy Unit, Molecular Oncology and Embryology Laboratory, School of Medicine, University of Barcelona, IDIBAPS, Casanova 143, 08036 Barcelona, Spain; e-mail: mmonzo@ub.edu.
References
Author notes
Presented in part as an oral presentation at the 50th Annual Meeting of the American Society of Hematology, San Francisco, CA, December 2008.

This feature is available to Subscribers Only
Sign In or Create an Account Close Modal