

Abstract
Membrane-spanning proteins may interact with a variety of other integral and peripheral membrane proteins via a diversity of protein-protein interactions. Not surprisingly, defects or mutations in any one of these interacting components can impact the physical and biological properties on the entire complex. Here we use quantum dots to image the diffusion of individual band 3 molecules in the plasma membranes of intact human erythrocytes from healthy volunteers and patients with defects in one of their membrane components, leading to well-known red cell pathologies (hereditary spherocytosis, hereditary elliptocytosis, hereditary hydrocytosis, Southeast Asian ovalocytosis, and hereditary pyropoikilocytosis). After characterizing the motile properties of the major subpopulations of band 3 in intact normal erythrocytes, we demonstrate that the properties of these subpopulations of band 3 change significantly in diseased cells, as evidenced by changes in the microscopic and macroscopic diffusion coefficients of band 3 and in the compartment sizes in which the different band 3 populations can diffuse. Because the above membrane abnormalities largely arise from defects in other membrane components (eg, spectrin, ankyrin), these data suggest that single particle tracking of band 3 might constitute a useful tool for characterizing the general structural integrity of the human erythrocyte membrane.
Introduction
In the well-studied erythrocyte membrane, a complex of membrane-spanning proteins comprised of band 3, Rh proteins, CD47, glycophorin A, and several other polypeptides is linked to a spectrin/actin cortical cytoskeleton via the bridging protein, ankyrin (labeled “ankyrin complex” in Figure 1A).1,2 In the same membrane, a second major complex comprised of band 3, glycophorin C, the glucose transporter, and perhaps Rh proteins is linked to a complex of spectrin, actin, and protein 4.1 via bridging proteins, p55, adducin, and dematin (labeled “junctional complex” in Figure 1A).2-5 A third population of band 3 is hypothesized to be unencumbered by attachment to a cytoskeletal protein (labeled free band 3)6 and might therefore be expected to display increased lateral diffusion, at least over long time periods.7

Models of human erythrocyte membrane showing major populations of band 3 and their likely models of lateral diffusion. (A) Lateral view of erythrocyte membrane showing major membrane-spanning proteins including: glycophorin C (GPC), Rh protein (Rh), band 3 (3), the glucose transporter (GLUT 1), Rh-associated glycoprotein (RhAG), CD47, and glycophorin A (GPA). Labeled peripheral membrane proteins include: spectrin, ankyrin, protein 4.1 (4.1) and protein 4.2 (4.2), adducin, P55, and dematin. Note that the 3 hypothesized populations of band 3 include freely diffusing band 3, band 3 in an ankyrin complex, and band 3 in the junctional complex. (B) Top view of hexagonal spectrin network showing expected mobilities of band 3. Three types of band 3 interactions are hypothesized, each with its predicted mobility: (1) free band 3 should exhibit high mobility over short time scales, but lower mobility with periodically confined diffusion (hop diffusion) over longer time scales, (2) band 3 bound to the spectrin-actin junctional complex through adducin should also show a limited (possibly even more limited than case 3) diffusion over short time periods and similarly restricted long time diffusion and (3) band 3 linked to spectrin tetramers through ankyrin should display limited mobility over short time periods and significantly restricted motion over long time periods.
Models of human erythrocyte membrane showing major populations of band 3 and their likely models of lateral diffusion. (A) Lateral view of erythrocyte membrane showing major membrane-spanning proteins including: glycophorin C (GPC), Rh protein (Rh), band 3 (3), the glucose transporter (GLUT 1), Rh-associated glycoprotein (RhAG), CD47, and glycophorin A (GPA). Labeled peripheral membrane proteins include: spectrin, ankyrin, protein 4.1 (4.1) and protein 4.2 (4.2), adducin, P55, and dematin. Note that the 3 hypothesized populations of band 3 include freely diffusing band 3, band 3 in an ankyrin complex, and band 3 in the junctional complex. (B) Top view of hexagonal spectrin network showing expected mobilities of band 3. Three types of band 3 interactions are hypothesized, each with its predicted mobility: (1) free band 3 should exhibit high mobility over short time scales, but lower mobility with periodically confined diffusion (hop diffusion) over longer time scales, (2) band 3 bound to the spectrin-actin junctional complex through adducin should also show a limited (possibly even more limited than case 3) diffusion over short time periods and similarly restricted long time diffusion and (3) band 3 linked to spectrin tetramers through ankyrin should display limited mobility over short time periods and significantly restricted motion over long time periods.
Despite the network of interactions among erythrocyte membrane proteins, even polypeptides attached to the hexagonally tethered junctional complex would be predicted to display some degree of lateral mobility (Figure 1B). Discher and colleagues8 determined that thermal fluctuations in the actin hub can lead to movements of up to 40 nm in the anchored actin filaments without release of the actin from the membrane. Furthermore, since the distance between junctional complexes (∼ 70 nm) is much smaller than the contour length of spectrin tetramers (∼ 200 nm),8,9 it might be expected that the band 3 molecules attached to ankyrin near the center of spectrin tetramers should also be capable of considerable movement without dissociating from the spectrin skeleton (Figure 1B). Finally, the spectrin tetramers may form fences that define triangular compartments within the hexagonal spectrin lattice, and within these compartments, unattached proteins (eg, free band 3) might be anticipated to diffuse up to approximately 70 nm without encountering a spectrin barrier. Long range diffusion might then proceed via slow intercompartment movement, perhaps when the spectrin tetramers transiently dissociate, thereby opening a gap in the putative “fence” that would otherwise prevent diffusion to neighboring compartments.
Because of extensive interconnections among membrane proteins, defects in one protein can often destabilize multiprotein complexes and thereby affect global membrane properties such as cell morphology, mechanical stability, and function. Thus, deficiencies or defects in ankyrin,10,11 certain domains of spectrin, band 3,12-14 or protein 4.215 can lead to a collection of pathologies, termed hereditary spherocytosis (HS),16-18 where membrane shedding, reduced cell deformability, and loss of biconcave disc morphology lead to early removal of the cell from circulation.11,19-21 Similarly, defects or deficiencies in proteins that stabilize the 2-dimensional spectrin/actin lattice can result in hereditary elliptocytosis (HE)21-23 or in more severe cases to hereditary pyropoikilocytosis (HPP)21,24 Other morphologic abnormalities can derive from other molecular lesions, including Southeast Asian ovalocytosis (SAO) from deletion of residues 400-408 in band 325-27 and hereditary stomatocytosis/hydrocytosis (HHy) from mutations within the membrane-spanning domain of band 328 or RhAG.29,30 Because of this strong interdependence of membrane proteins, we hypothesized that a protein such as band 3, that participates in both major membrane complexes and also exists in free form, might serve as a useful reporter of the structural integrity of the membrane. To test this hypothesis, we labeled band 3 covalently with a quantum dot (q-dot) and characterized its mobility in both intact normal erythrocytes and erythrocytes with a variety of structural defects (HS, HE, SAO, HHy, and HPP) using single particle imaging methodology. We report here that major differences exist among the above pathologic red cells in both the rate and extent that band 3 diffuses. These diffusion and compartment size data suggest that characterization of the motile properties of a prominent membrane protein such as band 3 can serve as a tool for interrogating the structural properties of multiple domains of a complex biological membrane.
Methods
Labeling of band 3 in intact erythrocytes with DIDS-biotin
Materials used for the synthesis of DIDS-biotin are listed in supplemental materials (available on the Blood website; see the Supplemental Materials link at the top of the online article). Details regarding the synthesis (Figure S1) and characterization (Figure S2) are also provided in supplemental materials. Blood samples from patients with hereditary hemolytic anemias (see Figure S3) were drawn following informed consent in accordance with the Declaration of Helsinki and institutional review board (IRB) approval obtained from Purdue University and centrifuged at 1000g to pellet the erythrocytes. The plasma and white cell fraction (buffy coat) were discarded. Erythrocytes were washed 3 times with phosphate-buffered saline (PBS), pH 7.4, containing 5 mM glucose, and again the white cell fraction was removed. Red blood cells (RBCs) diluted to 5% hematocrit in the same buffer were incubated with 10−11 M to 10−13 DIDS-biotin at 37°C for 1.5 hours to allow covalent reaction of the compound with band 3. This low concentration was determined from binding studies, where approximately 50% binding of DIDS-biotin to RBCs was found to occur at 30 μm. We used such low concentrations to react approximately with 1 biotin linker per cell. Under these experimental conditions, we observed that approximately 70% of the cells were labeled with a single q-dot when incubated with excess streptavidin q-dots. Cells with 2 or 3 q-dots attached were rarely seen. DIDS-biotin–labeled cells were then washed 3 times with PBS containing 0.1% bovine serum albumin (BSA) to remove unbound reagent, and the cells were incubated at room temperature with streptavidin Q-dot 525 or streptavidin Alexa Fluor 488 for 30 minutes. Unbound streptavidin conjugates were removed by washing twice with 0.1% BSA in PBS, and cells were allowed to settle onto a precleaned, polylysine-coated coverslip located within a custom built chamber ready for imaging. Unattached cells were washed off of the coverslip with PBS containing 0.1% BSA. Finally, 500 μL PBS were added to the chamber, and the cells were imaged as described below.
Single q-dot fluorescence video microscopy
Observation was performed on an Olympus IX-71 inverted microscope (Olympus, Center Valley, PA). Oblique angle fluorescence imaging was used to excite single q-dots on the apical surfaces of immobilized erythrocytes. The entire microscope was maintained at 37°C by enclosure in a temperature-controlled environment. The excitation laser (argon ion, 488 nm emission; Newport, Irvine, CA) was expanded, filtered (488/10-nm line width bandpass filter; Chroma Technology, Rockingham, VT) and directed toward the microscope objective (100× PlanApo, 1.45 NA TIRFM oil immersion; Olympus) parallel but off the optical axis through a dichroic mirror (500 nm cutoff; Chroma Technology). The resultant fluorescence image was projected through the dichroic mirror and an emission filter (525/50-nm bandpass; Chroma Technology), and the image was collected with a dual microchannel plate (MCP)–intensified, cooled charge-coupled device (CCD) camera (XR/Turbo-120z; Stanford Photonics, Palo Alto, CA). The excitation beam was set such that it was just outside of the condition for total internal reflection, thus allowing for a deeper excitation while still reducing background due to fluorescent matter in solution. Data were collected from the dots attached to the top of the cell at 120 frames/s. Each movie was recorded for 1000 frames. Only q-dots whose trajectories were at least 40 frames long were chosen for analysis, however, because even trajectories recorded for 1000 frames revealed band 3 diffusion for maximally 8 seconds, all data report only a brief snapshot of band3 behavior in the membrane. The trajectories were collected on a random selection of erythrocytes in each sample. In general, 100 to 500 RBCs were analyzed in each sample.
Analysis of mobility
The apparent position of the q-dot in the video image was determined as described by Gelles et al.31 Briefly, a kernel was developed from a Gaussian distribution which was then cross-correlated with each video frame in the neighborhood of the label of interest. For each frame, the resulting cross-correlation function was thresholded, and the particle position was found as the center-of-mass of the thresholded correlation intensity.
Analysis of the mobility was carried out based on the measured mean-squared displacement (MSD) of the observed label as described previously.7,32-34 For each trajectory, the MSD for every time interval was calculated according to the formula34,35 :
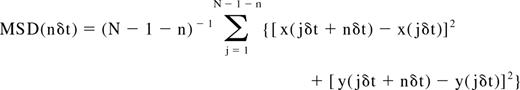
where δt is the time resolution and (x(jδt + nδt), y(jδt + nδt)) describes the particle position following a time interval nδt after starting at position (x(jδt), y(jδt)), N is the total number of frames in the sequence, n is a positive integer.
The MSD versus time plots (MSD-t plots) were analyzed and classified as describing simple Brownian, confined, or hop diffusion, as described in Fujiwara et al.36 and Umemura et al.37 All plots were fit with an approximation to the exact result for diffusion through an infinite array of partially permeable barriers.33 From this analysis, estimates of the short-time diffusion coefficient, Dμ, the asymptotic long time diffusion coefficient, DM, and, if applicable, the average spacing between barrier (referred to as the compartment size) L were obtained. Gaussian fits were used on the histograms of the distributions of diffusion coefficients/compartment sizes to determine the mean values of the distributions. The number of Gaussian distributions required to fit the histograms was chosen using the F test with a 95% confidence level.
Results
Labeling of band 3
Characterization of the movement of single band 3 molecules in whole erythrocytes required the ability to specifically label band 3, the erythrocyte anion transporter (AE1), in a nonperturbing manner. Anti-band 3 antibodies were not selected for this purpose because of their potential to cross-link band 3 into unnatural aggregates or displace band 3 from its natural protein partners. Therefore, DIDS, an inhibitor of band 3-mediated anion transport, which reacts covalently with Lys539 of band 3,38 was selected for the design of a band 3–specific labeling reagent. Importantly, DIDS binding to intact erythrocytes follows a noncooperative, single site-binding isotherm, suggesting that it does not preferentially label 1 band 3 population over another.39
To convert DIDS from a simple anion transport inhibitor to a selective anchor for q-dots on band 3, DIDS was linked via a peptide spacer to biotin, a high-affinity ligand of streptavidin, as described in “Methods” in the supplementary material. The peptide spacer was constructed to contain 4 anionic amino acids (to facilitate binding to the anion transporter) and a lysine residue (for attachment of biotin). The resulting construct was found to react covalently with whole erythrocytes and mediate binding of fluorescent streptavidin, as demonstrated in Figure 2A.

Structure and specificity of DIDS-biotin reagent for band 3. (A) Fluorescent image of whole erythrocytes reacted with a subsaturating concentration of DIDS-biotin reagent (10 μM) and then labeled with Alexa Flour 598–derivatized streptavidin. (B) Image of unlabeled (control) whole erythrocytes that were similarly incubated with Alexa Fluor 598–derivatized streptavidin. (C) SDS-PAGE analysis of the specificity of DIDS-biotin reagent for band 3. Erythrocytes were either not reacted with DIDS-biotin reagent (lane 1) or reacted with 1 μM DIDS-biotin reagent (lane 2) before separation by SDS-PAGE. After electrophoretic transfer onto nitrocellulose, the molecular weights of DIDS-biotin–labeled polypeptides were determined by staining with streptavidin–horseradish peroxidase (1:1500). Lane 3 contains Coomassie blue–stained erythrocyte membranes, and lane 4 contains molecular weight markers. Vertical line(s) have been inserted to indicate a repositioned gel lane. (D) Structure of the DIDS-biotin reagent.
Structure and specificity of DIDS-biotin reagent for band 3. (A) Fluorescent image of whole erythrocytes reacted with a subsaturating concentration of DIDS-biotin reagent (10 μM) and then labeled with Alexa Flour 598–derivatized streptavidin. (B) Image of unlabeled (control) whole erythrocytes that were similarly incubated with Alexa Fluor 598–derivatized streptavidin. (C) SDS-PAGE analysis of the specificity of DIDS-biotin reagent for band 3. Erythrocytes were either not reacted with DIDS-biotin reagent (lane 1) or reacted with 1 μM DIDS-biotin reagent (lane 2) before separation by SDS-PAGE. After electrophoretic transfer onto nitrocellulose, the molecular weights of DIDS-biotin–labeled polypeptides were determined by staining with streptavidin–horseradish peroxidase (1:1500). Lane 3 contains Coomassie blue–stained erythrocyte membranes, and lane 4 contains molecular weight markers. Vertical line(s) have been inserted to indicate a repositioned gel lane. (D) Structure of the DIDS-biotin reagent.
The specificity of the DIDS-biotin conjugate was established by reacting the conjugate with intact erythrocytes, isolating their membranes, separating component proteins by sodium dodecyl sulfate polyacrylamide gel electrophoresis (SDS-PAGE), blotting the proteins onto nitrocellulose paper, and visualizing the location of biotinylated polypeptides by staining with streptavidin–horseradish peroxidase. As seen in Figure 2C, only 1 polypeptide with apparent Mr approximately 100 kDa was labeled. Because band 3 is the only known receptor for DIDS on human erythrocytes, and because band 3 has the molecular weight of the protein stained in Figure 2C (ie, ∼ 100 kDa), we conclude that band 3 is selectively labeled by the DIDS-biotin conjugate in intact erythrocytes. Further, because streptavidin-linked q-dots do not bind erythrocytes that have not been reacted with DIDS-biotin (Figure 2B), we suggest that DIDS-biotin labeling enables selective imaging of band 3 diffusion in intact erythrocytes.
Single-particle tracking experiments were invariably performed on whole cells reacted with very few q-dots to avoid confusion due to crossing trajectories. To derivatize a single or at most 2 or 3 band 3 molecules per intact erythrocyte, a standard DIDS-biotin binding curve was obtained by evaluating the fluorescence of bound streptavidin-Alexa Fluor 488–labeled erythrocytes as a function of the concentration of DIDS-biotin added. Half maximal binding was observed at 30 μM DIDS-biotin (Figure 3), and derivatization of only 1 or 2 molecules/cell was achieved at 10−11 M DIDS-biotin. Therefore, all subsequent erythrocyte labeling was performed using 10−11 M DIDS-biotin. We do not believe that this concentration of DIDS-biotin significantly affects the diffusion of band 3 in the red cell.

Analysis of DIDS-biotin binding to intact human erythrocytes. Washed normal human erythrocytes were reacted with DIDS-biotin reagent as described in Methods, labeled with streptavidin–Alexa Fluor 488, washed 3 times in buffered saline, and analyzed for bound Alexa Fluor 488 by flow cytometry. The intensity of the bound Alexa Fluor 488 fluorescence is plotted as a function of the concentration of DIDS-biotin reagent added. Fifty percent saturation was observed at 30 μM DIDS-biotin reagent.
Analysis of DIDS-biotin binding to intact human erythrocytes. Washed normal human erythrocytes were reacted with DIDS-biotin reagent as described in Methods, labeled with streptavidin–Alexa Fluor 488, washed 3 times in buffered saline, and analyzed for bound Alexa Fluor 488 by flow cytometry. The intensity of the bound Alexa Fluor 488 fluorescence is plotted as a function of the concentration of DIDS-biotin reagent added. Fifty percent saturation was observed at 30 μM DIDS-biotin reagent.
Analysis of band 3 mobility on normal and fixed erythrocytes
Due to the noise inherent in the measurement of the position of a single q-dot during single particle tracking, even stationary labels were found to report a nonzero diffusion coefficient. This nonzero diffusion coefficient for immobilized labels sets the level of accuracy in determining meaningful mobilities. To determine this level in the current study, the mobility of band 3 on acrolein-fixed RBCs was monitored at 37°C using the usual methodology. Figure 4 shows a typical trajectory of the labeled band 3 on these fixed intact RBCs. From analysis of individual band 3 trajectories on greater than 130 of these fixed cells, 2 diffusion coefficients were measured corresponding to a diffusion coefficient at short times (termed microscopic diffusion coefficient, Dμ) and the asymptotic diffusion coefficient at long times (termed macroscopic diffusion coefficient, DM). The top row of Figure 5 displays the distribution of Dμ and DM values measured for labeled band 3 molecules on fixed human RBCs. Fitting a single Gaussian distribution to each of these sets of measurements yields a mean Dμ of 6.8 × 10⁻¹⁴ cm2/s and a mean DM of 5.5 × 10⁻¹⁴ cm2/s. These values establish the smallest meaningful Dμ and DM diffusion coefficients that can be measured with our imaging system. Importantly, Dμ and DM values for q-dots attached directly to polylysine-coated glass slides were not significantly different (Dμ = 6.2 × 10⁻¹⁴ and DM = 3.2 × 10⁻¹⁴ cm2/s).

Representative trajectories of DIDS-biotin–labeled band 3 on normal and mutant intact human erythrocytes. After labeling with DIDS-biotin conjugate, the diffusion of the labeled band 3 was imaged for 100 consecutive frames at 120 frames/s on fixed normal, unfixed normal, HS, HPP, HE, HHy, and SAO erythrocytes. Because most of these cell types have multiple populations of band 3, the trajectory of only the most abundant population is displayed (percent of total band 3 is indicated in parentheses).
Representative trajectories of DIDS-biotin–labeled band 3 on normal and mutant intact human erythrocytes. After labeling with DIDS-biotin conjugate, the diffusion of the labeled band 3 was imaged for 100 consecutive frames at 120 frames/s on fixed normal, unfixed normal, HS, HPP, HE, HHy, and SAO erythrocytes. Because most of these cell types have multiple populations of band 3, the trajectory of only the most abundant population is displayed (percent of total band 3 is indicated in parentheses).

Distributions of the logarithms of the microscopic (Dμ) and macroscopic (DM) diffusion coefficients, and the compartment sizes determined by analysis of individual trajectories of labeled band 3 molecules on intact fixed normal, unfixed normal, HE, HPP, HHy, SAO, and HS erythrocytes.
Distributions of the logarithms of the microscopic (Dμ) and macroscopic (DM) diffusion coefficients, and the compartment sizes determined by analysis of individual trajectories of labeled band 3 molecules on intact fixed normal, unfixed normal, HE, HPP, HHy, SAO, and HS erythrocytes.
In comparison to fixed cells, labeled band 3 displays a higher mobility on intact, unfixed normal human RBCs at 37°C. A typical trajectory is shown in Figure 4, while the distributions of measured Dμ and DM are shown in row 2 of Figure 5 (see individual data in Figure S4). Note that the observed diffusion coefficients are significantly larger than those measured on fixed cells. The distribution of microscopic diffusion coefficients fits well with 2 Gaussian curves centered at 1.4 × 10⁻¹¹ and 2.2 × 10⁻¹⁰ cm2/s (Table 1), which represent of 77% and 23% of the labeled band 3 population, respectively. In contrast, the macroscopic diffusion coefficient displays a single broad peak at 1.7 × 10⁻¹² cm2/s (Table 1).
Microscopic and macroscopic diffusion data of healthy and disease RBCs
| RBC type | Dμ, cm2/s | DM, cm2/s | Percent immobile* | Percent constrained† | Percent free |
|---|---|---|---|---|---|
| Fixed (n = 134)‡ | (6.8 ± 0.1) × 10−14§ | (5.5 ± 0.2) × 10−14 | 95‖ | 0 | 5 |
| Normal (n = 626) | (1.4 ± 0.4) × 10−11 (77%)¶(2.2 ± 0.1) × 10−10 (23%) | (1.7 ± 0.1) × 10−12 | 24 | 30 | 46 |
| HPP (n = 349) | (7.9 ± 0.5) × 10−11 | (1.5 ± 0.1) × 10−11 | 7 | 37 | 56 |
| HS-1 (n = 107) | (2.7 ± 1.3) × 10−12 (27%)(5.5 ± 0.7) × 10−11 (73%) | (1.4 ± 0.1) × 10−12 | 34 | 32 | 34 |
| HS-2 (n = 124) | (3.8 ± 1.1) × 10−12 (42%)(9.6 ± 1.2) × 10−11 (58%) | (2.2 ± 0.1) × 10−12 | 20 | 37 | 43 |
| HE-1 (n = 133) | (5.4 ± 0.8) × 10−11 | (9.8 ± 1.7) × 10−13 (69%)(2.0 ± 0.4) × 10−10 (31%) | 23 | 31 | 46 |
| HE-2 (n = 212) | (1.2 ± 0.1) × 10−12 (37%)(3.0 ± 0.3) × 10−11 (63%) | (8.8 ± 0.5) × 10−13 | 19 | 25 | 56 |
| HE-3 (n = 168) | (8.2 ± 0.4) × 10−13 (20%)(2.6 ± 0.4) × 10−11 (80%) | (8.3 ± 0.3) × 10−13 (78%)(8.1 ± 1.1) × 10−11 (22%) | 26 | 22 | 52 |
| HHy (n = 171) | (1.5 ± 1.2) × 10−12 (40%)(4.4 ± 1.4) × 10−11 (60%) | (8.1 ± 0.4) × 10−13 | 31 | 30 | 39 |
| SAO (n = 173) | (2.1 ± 0.1) × 10−12 (16%)(4.5 ± 0.3) × 10−11 (84%) | (1.8 ± 0.1) × 10−12 | 21 | 31 | 48 |
| HS-unknown defects | |||||
| HS-3 (n = 231) | (1.2 ± 1.9) × 10−12 (25%)(2.9 ± 0.3) × 10−11 (75%) | (6.8 ± 0.3) × 10−12 | 34 | 28 | 38 |
| HS-4 (n = 173) | (4.9 ± 0.3) × 10−11 | (4.0 ± 0.2) × 10−13 | 21 | 33 | 46 |
| HS-5 (n = 206) | (1.8 ± 0.3) × 10−12 (17%)(6.7 ± 0.4) × 10−11 (82%) | (1.8 ± 0.1) × 10−12 | 25 | 35 | 40 |
| HS-6 (n = 136) | (2.7 ± 0.5) × 10−12 (11%)(1.0 ± 0.2) × 10−10 (89%) | (3.2 ± 0.1) × 10−12 | 20 | 30 | 50 |
The totally immobile fraction is defined as the fraction of band 3 molecules that was found to have a DM value less than or equal to the slowest 95% of DM values measured for band 3 on fixed erythrocytes (DMImm); that is, the fraction of band 3 that diffuses similar to band 3 on fixed cells.
Percent confined includes all trajectories that were classified as undergoing confined or hop diffusion and for which DM > DMImm.
Total number of trajectories analyzed.
Errors are given as the SEM.
Defined as such.
Reflects the fraction of total area contained in each peak of the Gaussian fit to the distribution. For those distributions that fit best with a single peak it is understood that 100% of the area is contained within that peak
Band 3 mobility in erythrocytes with HE and HPP
A typical trajectory of band 3 on intact erythrocytes with HE (commonly thought to derive from a defect in one of the horizontal interactions that stabilizes the membrane skeleton) is shown in Figure 4. Although the specific mutations responsible for this and the other altered RBCs evaluated in this publication were not determined, it is conceivable that at least 2 of the 3 HE samples examined (Figures 5 and S5) represent different molecular defects, because their osmotic deformability scans were significantly different (see Figure S6). Consistent with this interpretation, analysis of the distribution of diffusion coefficients of band 3 at 37°C in the first HE sample (HE-1) revealed a single Gaussian distribution for Dμ values, but 2 Gaussian distributions for DM values; however, the converse was true for sample HE-2 (Figure 5 and Table 1). Thus, although the major population of band 3 in both patient's samples exhibited similar values of Dμ and DM of approximately 4 × 10⁻¹¹ and approximately 9 × 10⁻¹³ cm2/s, respectively, the “extra” band 3 population in the HE-1 sample displayed a faster DM of 2.0 × 10⁻¹⁰ cm2/s, whereas the additional population of band 3 in the HE-2 sample had a slower Dμ of 1.2 × 10⁻¹²cm2/s. Because approximately 150 cells were examined from each patient, we interpret these behaviors to indicate that the 2 HE pathologies are molecularly different.
The other major morphologic disorder ascribed to defects in horizontal interactions within the membrane skeletal network is termed HPP. Although analysis of band 3 diffusion in these cells at 37°C revealed a relatively normal Dμ of 7.9 × 10⁻¹¹ cm2/s (compared with 1.4 × 10⁻¹¹ cm2/s [77%] and 2.2 × 10⁻¹⁰ cm2/s [23%] in normal RBCs), the value for DM was the fastest yet measured (Figures 4 and 5 and Table 1). Thus, DM in HPP cells was determined to be 1.5 × 10⁻¹¹ cm2/s (ie, 10 times faster than normal), suggesting that long-range band 3 diffusion in HPP cells is relatively unimpeded by physical barriers. Moreover, all band 3 molecules in these cells appeared to diffuse homogeneously (ie, only a single Gaussian distribution was obtained for both Dμ and DM), suggesting that the 2 distinct band 3 populations seen in healthy cells (Figure 5) are either indistinguishable or absent in HPP cells.
Band 3 mobility in erythrocytes with HS
HS cells are collectively characterized by a defect in one of several interactions connecting the phospholipid bilayer to the spectrin skeleton. Six HS samples were analyzed in this study. SDS-PAGE and Western blot analysis revealed that HS sample 1 may have an abnormal band 3 characterized by a slightly lower molecular weight, whereas HS sample 2 may suffer from a slight deficiency in spectrin (see Figure S7). However, no molecular defect could be identified in any of the other 4 HS samples other than their spherocytic morphologies, lower mean cell volumes (MCV), and altered osmotic scans on an ektacytometer. In general, the diffusion behavior of band 3 at 37°C in each of the 6 HS samples was similar, with each sample yielding 2 distinct Gaussian distributions of Dμ and one distribution of DM (Figure 5, rows 4 and 5, and Figure S8 and Table 1). Although similar to normal cells in this gross description, the behavior of band 3 in the HS patients was otherwise very different. Thus, the distribution of band 3 molecules between faster and slower diffusing populations of Dμ in intact HS erythrocytes was significantly shifted toward the faster diffusing population (ie, 80% of band 3 in HS cells was in the faster diffusing population vs 23% of band 3 in normal cells; Figures 5 and S8), suggesting a smaller fraction of band 3 molecules in HS erythrocytes is restricted by attachment to the membrane skeleton. Further, the slower diffusing population in HS cells was seen to move considerably slower than the corresponding slow diffusing population in normal RBCs (average of 2.4 × 10⁻¹² in HS vs 1.4 × 10⁻¹¹ cm2/s in normal RBCs). Taken together, these data suggest that short term constraints on band 3 diffusion in HS cells are significantly different from those in normal cells.
Because average values of DM did not significantly differ between HS and normal RBCs (2.6 × 10⁻¹² vs 1.7 × 10⁻¹² cm2/s, respectively; Table 1), we would assume that the rate of diffusion from one spectrin compartment to another is not significantly different between normal and HS samples.
Band 3 mobility in erythrocytes with HHy
Analysis of the trajectories of band 3 in intact HHy cells (Figure 4) revealed a microscopic diffusion coefficient (Dμ) characterized by 2 Gaussian distributions with mean values of 1.5 × 10⁻¹² (ie,10 times slower than the slower population in normal RBCs) and 4.4 × 10⁻¹¹ cm2/s (ie, 5 times slower than the faster population in normal RBCs; Table 1). The distribution of macroscopic diffusion coefficients showed only a single peak with a mean of 8.1 × 10⁻¹³ cm2/s (Figure 5 and Table 1). This macroscopic diffusion coefficient was 2 times slower than that found in normal RBCs.
Band 3 mobility in SAO erythrocytes
Approximately half of the band 3 molecules in SAO erythrocytes contain a deletion of residues 400-408, the remaining copies of band 3 being normal.26,27,40 Because only the “normal” population of band 3 can be labeled with DIDS,26 analysis of diffusion data from SAO cells must be interpreted with caution, because the mobility of the mutated band 3 is never measured. With this caveat in mind, 2 Gaussian distributions of Dμ with mean values of 2.1 × 10⁻¹² and 4.5 × 10⁻¹¹ cm2/s were fitted, both 5 times slower than the corresponding populations on normal RBC (Table 1). These data would suggest that diffusion of even the normal population of band 3 in SAO membranes is significantly impacted by the presence of the mutant isoform. In contrast, only a single population of band 3 molecules was detected by analysis of DM, and the measured value (1.8 × 10⁻¹² cm2/s) was similar to that found on normal RBCs.
Analysis of compartment size distributions
Roughly half of the band 3 population in each cell type was determined by our analysis algorithm to diffuse within a confined area during the observation period of the imaging experiment (see “Analysis of mobility”). The final column of Figure 5 shows the measured distribution of calculated compartment sizes for the fraction of band 3 that exhibited this temporarily confined diffusion in the various cell types (see also Figure S9). In normal cells, roughly half of this confined population diffused within an apparent compartment of 35 nm diameter, while the other half diffused within a compartment of approximately 70 nm. Except for HPP erythrocytes (and 3 of 6 HS samples shown in Figure S8), the best fits of the data on all of the pathologic cells yielded only a single compartment size of 35-42 nm. However, diffusion of band 3 on HPP erythrocytes was characterized by compartment sizes of 58, 93, and 122 nm, and diffusion on HS samples was highly variable, with 2 of the 6 showing multiple compartment sizes similar to HPP cells. Based on these limited data, it would appear that the anion transporter experiences significantly fewer barriers while diffusing on HPP and some HS cells than on normal erythrocytes.
While it is tempting to begin to draw conclusions on the dimensions of the spectrin network from the above data, because only half of the band 3 population exhibits this temporarily confined diffusion, any complete interpretation of compartment size data must also consider those band 3 molecules that do not experience “confined diffusion.” Included in this category are band 3 polypeptides that display any of the following 3 modes of diffusion: (1) molecules that see no barriers within the time frame of 1 analysis (usually 8.0 s), (2) molecules whose “hopping” movement between compartments is fast relative to the frequency of image acquisition, and (3) molecules that are confined to compartments so small that their compartments/diffusion coefficients cannot be accurately determined.41 Because those band 3 molecules that exhibit unrestrained diffusion might also provide information on the integrity of the spectrin network, we have calculated the percent of total band 3 that diffuses in a relatively unrestricted manner by subtracting the fraction of band 3 diffusing according to mode 3 above from the total fraction of band 3 not exhibiting “confined” diffusion (Table 1). Except for band 3 in HPP cells, the fraction of this relatively unrestricted band 3 appears to be moderately constant from 1 pathologic cell to the next.
Discussion
To study the mobility of band 3 in essentially unperturbed intact erythrocytes, we required a probe that would: (1) react covalently with band 3 (to prevent probe hopping among band 3 molecules during the measurement), (2) derivatize no other membrane protein, (3) avoid promoting aggregation or clustering of band 3, and (4) enable imaging of band 3 with highly fluorescent particles. For this purpose, we designed and synthesized a DIDS-biotin conjugate that not only met all of the above criteria, but also permitted the reproducible derivatization of only one or few band 3 molecules/cell, thereby avoiding confusion over which particle/band 3 was being monitored. Because single fluorophores (eg, fluorescein) were strongly quenched by the high concentration of proximal hemoglobin, the DIDS-biotin probe proved to be especially valuable because it allowed labeling of band 3 with q-dots that could be easily tracked using a high speed CCD camera.
As noted in the introduction, we set out to determine whether the mobility of a prominent membrane protein such as band 3 might be exploited to detect defects in other major membrane components. Although the molecular mutations in the 12 different hemolytic anemia samples examined were not determined, we suggest that the answer to this question remains in the affirmative, because band 3 diffusion in all of the pathologic samples displayed unequivocally abnormal properties. Thus, unlike normal erythrocytes, where 77% of the band 3 diffused with a slow Dμ of 1.4 × 10⁻¹¹ cm2/s, HPP cells contained no band 3 that diffused with such slow kinetics (Table 1 and Figure 5). Although HS cells, like normal erythrocytes, exhibited a bimodal distribution of Dμ values, the relative abundances of the slow and fast populations differed markedly from normal, with the slow population dominating the behavior in healthy cells (73% of the total band 3), but the fast population assuming prominence in HS samples (80% of total band 3). Moreover, a substantial fraction of band 3 in all HE samples was found to redistribute from the slower to faster diffusing population, and DM values for 2 of the 3 HE samples were approximately 10 times faster than in normal cells. Perhaps equally interesting was the observation that even normal copies of band 3 in cells containing mutated band 3 (ie, SAO cells) were able to sense the impact of their mutated counterparts (ie, the slow and fast Dμ values in SAO cells were both 10 times slower than normal). Because most of the above pathologies do not involve a defect in band 3, we suggest that a prominent membrane component such as band 3 can be used as a sentinel to determine whether mutations in other cellular components compromise the integrity of the membrane.
It was interesting that many (but not all) of the changes in band 3 properties in the hemolytic anemias were consistent with current understandings of the underlying defects in these membrane abnormalities. Thus, as noted above, a substantial fraction of band 3 in all HS cells shifted toward a more rapidly diffusing population. If one or both of the Dμ populations were to correspond to ankyrin- and/or adducin-attached band 3, then this increase in band 3 mobility would be consistent with observations that linkages connecting the bilayer (primarily via band 3) to the spectrin skeleton are compromised in HS.11-14 Similarly, the complete loss of the slow diffusing population of band 3 in HPP and the concomitant nearly complete loss of totally immobilized band 3 in the same cells would be consistent with published data demonstrating that the spectrin skeleton is extensively fragmented in HPP and that band 3-ankyrin affinity is influenced by spectrin tetramer formation42 ; ie, in agreement with previous fluorescence recovery after photobleaching (FRAP) data from Golan and coworkers43 showing that band 3 diffuses 6 times faster and has a smaller immobilized fraction in HPP cells than in any HS or normal sample examined (see Table 1). Moreover, the slower Dμ values of band 3 in the SAO cells is consistent with the fact that band 3 forms linear aggregates in these cell types,26,44 and the faster Dμ in HE cells is not incompatible with the view that the spectrin network is weakened in this pathology.22,23
In contrast, except for results on normal erythrocytes, the compartment size data were generally not anticipated. Rationalization of compartment sizes measured in normal cells might be possible if the larger compartments (ie, approximately 70 nm) were to correspond to open areas between putative “spectrin fences,” and the smaller compartments were to derive from cytoskeletally attached band 3. Thus, because the length of an extended spectrin tetramer is reported at approximately 200 nm,8,9 and because spectrin tetramers are thought to be compacted to approximately one-third of this length in situ,9 the size of a compartment in which free band 3 can diffuse might be approximately 70 nm. The smaller compartments of 35 nm might then correspond to spectrin-anchored band 3, because as Discher and coworkers8 note, even spectrin-attached actin hubs move/oscillate within a compartment of approximately 40 nm. How then might the common compartment size of 35-42 nm seen in most of the remaining hemolytic anemias be explained? While no definitive interpretation can be offered, we speculate that this population of band 3 might also correspond to those polypeptides that are anchored to spectrin via the junctional complex or ankyrin. Thus, our data analysis algorithm calculates a compartment size for only those band 3 molecules that exhibit confined diffusion over the time period of a measurement (∼ 8 s), and thus those band 3 molecules that encounter no barriers within this time frame will not contribute to the compartment size measurement. In this regard, it is interesting that HPP cells and 2 of the HS samples display several distinct compartment sizes of significantly larger dimensions, suggesting that the defects in these membranes somehow enable band 3 to diffuse within larger putative “corrals.”
Previous studies of the rotational and lateral diffusion of band 3 in erythrocyte membranes have consistently identified 2 populations of the polypeptide, one attributed to a cytoskeletally anchored fraction and the other to a freely diffusing population. Rotational relaxation studies of Cherry and colleagues45 demonstrated that both populations were mobile, but that one exhibited relatively unrestricted rotation and the other displayed restrained, yet measurable rotation. Subsequent studies by Beth and coworkers46 showed that the skeletally attached band 3 can rotate through an angle of 73°, probably because of the flexibility of the junction between the cytoplasmic and membrane-spanning domains of band 3. Data of Golan et al47 have further demonstrated that depletion of ankyrin releases the less mobile population from its rotational restriction and that the rotational and lateral diffusion of band 3 are independently regulated, the former by protein interactions at the cytoplasmic surface of the membrane, and the latter by the spectrin content of the cell.43,48 Additional studies from the Golan laboratory49 have also identified 2 populations of band 3 based on lateral diffusion measurements using FRAP. Finally, Kusumi and colleagues7,50 introduced single-particle imaging methodologies to explore band 3 diffusion in erythrocyte ghosts, and they also identified 2 diffusing populations, albeit the diffusion coefficient of only the more mobile fraction was reported.
We have also found evidence for 2 major populations of band 3 in normal human erythrocytes. Thus, analysis of over 600 cells from 8 different donors yields 2 Dμ values and 2 compartment sizes for band 3. The conundrum, however, lies in the fact that recent membrane models (Figure 1A) display 3 populations of band 3 (ie, an ankyrin bound, an adducin bound, and a free population of band 3). Whether band 3 in both the ankyrin and junctional complex diffuse with the slower diffusion coefficients and within the smaller compartments will have to await further scrutiny, but it is tempting to speculate that the faster diffusing band 3 that moves within the larger compartment might correspond to freely diffusing band 3. Ongoing studies on mice deficient in major proteins of both the ankyrin complex and junctional complex will help to resolve this uncertainty.
The online version of this article contains a data supplement.
The publication costs of this article were defrayed in part by page charge payment. Therefore, and solely to indicate this fact, this article is hereby marked “advertisement” in accordance with 18 USC section 1734.
Acknowledgments
The authors thank Steven C. Habicht, Derek Doorneweerd, Sumith Kalaratne, Prasad Rajendra Bandari, and Estela Campanella for helpful discussions.
P.S.L. acknowledges funding from the National Institutes of Health (Grant GM24417-29). K.R. acknowledges funding from the National Science Foundation (Grant 0646633).
National Institutes of Health
Authorship
Contribution: G.C.K. and P.S.L. designed research; G.C.K. performed research; G.C.K., synthesized and characterized the DIDS-biotin; J.S., C.S., and G.C.K. contributed microscopic analysis; G.C.K., J.S., and K.R. analyzed data; F.A.K., R.L., and P.G.G. supplied blood specimens; and P.S.L. and K.R. wrote the paper.
Conflict-of-interest disclosure: The authors declare no competing financial interests.
Correspondence: Philip S. Low, Department of Chemistry, Purdue University, 560 Oval Dr, West Lafayette, IN 47907; e-mail: plow@purdue.edu or Ken Ritchie, Department of Physics, Purdue University, 525 Northwestern Ave, West Lafayette, IN 47907; e-mail: kpritchie@purdue.edu.

This feature is available to Subscribers Only
Sign In or Create an Account Close Modal