

Abstract
Hepcidin is a major regulator of iron metabolism. Hepcidin-based therapeutics/diagnostics could play roles in hematology in the future, and thus, hepcidin transport is crucial to understand. In this study, we identify α2-macroglobulin (α2-M) as the specific hepcidin-binding molecule in blood. Interaction of 125I-hepcidin with α2-M was identified using fractionation of plasma proteins followed by native gradient polyacrylamide gel electrophoresis and mass spectrometry. Hepcidin binding to nonactivated α2-M displays high affinity (Kd 177 ± 27 nM), whereas hepcidin binding to albumin was nonspecific and displayed nonsaturable kinetics. Surprisingly, the interaction of hepcidin with activated α2-M exhibited a classical sigmoidal binding curve demonstrating cooperative binding of 4 high-affinity (Kd 0.3 μM) hepcidin-binding sites. This property probably enables efficient sequestration of hepcidin and its subsequent release or inactivation that may be important for its effector functions. Because α2-M rapidly targets ligands to cells via receptor-mediated endocytosis, the binding of hepcidin to α2-M may influence its functions. In fact, the α2-M–hepcidin complex decreased ferroportin expression in J774 cells more effectively than hepcidin alone. The demonstration that α2-M is the hepcidin transporter could lead to better understanding of hepcidin physiology, methods for its sensitive measurement and the development of novel drugs for the treatment of iron-related diseases.
Introduction
The hormone hepcidin plays a role in orchestrating iron metabolism.1-12 This peptide, originally discovered in urine as a bactericidal molecule,13 was later shown to be a regulator of iron metabolism.3,5 In fact, it plays an important role in conditions of altered iron demand.3,5
The function of hepcidin is regulation of transmembrane iron transport.4,5 Hepcidin binds to its cell surface receptor, ferroportin (solute carrier family 40 [iron-regulated transporter], member 1), leading to internalization and degradation of the protein complex by the lysosome.1 Because ferroportin enables iron efflux from enterocytes, hepatocytes, and macrophages, its internalization after hepcidin binding leads to decreased iron release.1 Hence, the hepcidin-mediated decrease in ferroportin iron export from enterocytes into blood leads to depressed intestinal iron absorption.3,4 At the same time, iron export from hepatocytes and macrophages is blocked, which further decreases serum iron.3-5
Hepcidin also plays a role during inflammation, infection, and cancer.3-5 Under these conditions, iron is shifted from the circulation into stores, making it less available.3 In anemia and hypoxia, hepcidin regulates iron availability for erythropoiesis. In the future, hepcidin may find a place in treating disease states.3-5 Furthermore, hepcidin is predicted to become an indicator of body iron stores.
We investigated the presence of plasma hepcidin-binding molecules because the identification of such entities will provide new insights into hepcidin function. Indeed, it is known that many hormones are transported in the blood by carrier molecules,14-16 but a specific hepcidin-binding protein has not been identified. Hence, knowledge of hepcidin transport is essential for understanding its distribution and may be important for its measurement in plasma.
In this study, we incubated blood plasma with125I-labeled human hepcidin and then separated plasma proteins using native electrophoresis. For the identification of these molecules, the complexes were purified using a native 2-dimensional separation technique with identification by mass spectrometry.17 We identified α2-macroglobulin (α2-M) as the specific hepcidin-binding molecule in plasma.
Methods
Chemicals, plasma, and serum
Chemicals were from Sigma-Aldrich (St Louis, MO). Blood was obtained from healthy volunteers (2 females, 3 males) after the study was approved by the Ethics Committee (Institute of Hematology and Blood Transfusion, Prague) and informed consent was obtained from the participants in accordance with the Declaration of Helsinki. To obtain serum, blood was collected into vacuutainer tubes, allowed to stand 15 minutes and centrifuged (2000g for 25 minutes at 20°C). To obtain plasma, blood was collected into vacuutainer tubes and centrifuged (1500g for 5 minutes at 20°C). Plasma or serum were pooled and used for experiments. Analysis of these blood samples by the Institute of Hematology and Blood Transfusion demonstrated they were within the normal range for serum iron, serum ferritin, and transferrin saturation (Table 118,19 ).
Serum Fe, transferrin saturation, and serum ferritin levels in blood from healthy volunteers in this study
| Healthy volunteers | Serum Fe,* μmol/L | Tf saturation,† % | Serum ferritin,‡ μg/L |
|---|---|---|---|
| Female, A | 10.86 | 35 | 75 |
| Female, B | 22.32 | 41 | 55 |
| Male, A | 9.14 | 50 | 98 |
| Male, B | 25.41 | 26 | 79 |
| Male, C | 16.45 | 35 | 25 |
| Mean ± SD | 16.84 ± 5.75 | 37.4 ± 7.22 | 66.4 ± 22.64 |
Reagents
Unmodified (DTHFPICIFCCGCCHRSKCGMCCKT) and M21Y-modified (DTHFPICIFCCGCCHRSKCGYCCKT) hepcidin peptides were custom-synthesized and purity was confirmed by Clonestar Peptide Services (Brno, Czech Republic). Goat anti–human α2-M antibody (sc-8514) was from Santa Cruz Biotechnology (Santa Cruz, CA).
Hepcidin renaturation
We used an established method for hepcidin renaturation based on dissolving hepcidin in denaturant (6 M guanidine HCl), subsequent reduction with dithiothreitol, followed by purification using reversed-phase chromatography and slow oxidation.1
Hepcidin concentration
Radiolabeling of hepcidin
Hepcidin was labeled with 125I via the protocol of Nemeth et al1 using IodoBeads (Pierce Biotechnology, Rockford, IL). This protocol maintains the conformation of hepcidin.1 Iodinated hepcidin was then purified using a Waters μBondapack C18 WAT027324 column (Waters, Milford, MA) prewet with methanol and equilibrated with 0.1% trifluoroacetic acid (TFA).
Determination of biologic activity of renatured hepcidin
The biologic activity of hepcidin was determined according to Rivera.23 Twelve to 14 days before the experiment, 5-week-old female C57Bl/6 mice (Charles River Laboratories, Wilmington, MA) were switched to a low-iron diet (Harlan-Teklad, Madison, WI). These were injected intraperitoneally with 50 μg hepcidin, controls were injected with phosphate-buffered saline (PBS). Six hours later, the mice were anesthetized with avertin and blood was collected. The blood was centrifuged at 700g for 15 minutes at 4°C and the sera collected. Serum iron and total iron-binding capacity were then analyzed (Jewish General Hospital, Montreal, Canada). Animal studies were performed with approval of the Animal Care Committee of the Lady Davis Institute for Medical Research/McGill University, Montreal, QC.
Fractionation of blood plasma proteins by FPLC
Fractionation was performed at 25°C. Blood plasma (500 μL) was diluted with 4.5 mL buffer A (50 mM Tris-HCl, pH 8.0) and loaded onto a MONO Q-5/50 GL column (GE Healthcare, Little Chalfont, United Kingdom) connected to a BioLogic HR (Bio-Rad Laboratories, Hercules, CA) fast-pressure liquid chromatography (FPLC). The fractions were eluted using a linear gradient (0-1 M) of NaCl in buffer A.
Native gel electrophoresis and gel processing
Samples were separated on a linear gradient (3%-12%) native polyacrylamide gel containing Triton X-100 in Tris-glycine buffer.17 The gel was exposed and scanned on a phosphorimager (Fuji, Cypress, CA). The radiogram was analyzed using Aida software (Raytest, Straubenhart, Germany).
Analysis of the hepcidin–α2-M interaction using FPLC
Binding of hepcidin to plasma proteins or purified α2-M was studied via size-exclusion chromatography using FPLC (BioLogic DuoFlow System; BioRad) fitted with a Superdex 200 10/300 GL (GE Healthcare) column. Samples of plasma or purified α2-M (Sigma-Aldrich) were incubated with 125I-hepcidin for 1 hour at 37°C, loaded into the column and eluted with 0.14 M NaCl/0.01 M Hepes (pH 7.4) at 25°C. Radioactivity in the fractions was measured with a 1480 Wallac Wizard 3′ gamma counter (Turku, Finland).
Enzymatic in-gel digestion and μLC-mass spectrometric analysis
In-gel digestion and mass spectrometric analysis was performed as described.17 Proteins were reduced with 30 mM Tris-(2-carboxyethyl)phosphine hydrochloride at 65°C for 30 minutes and alkylated by 30 mM iodacetamide for 60 minutes in the dark. After overnight digestion at 37°C in buffer containing 0.01% 2-mercaptoethanol, 0.1 M 4-ethylmorpholine acetate, 10% MeCN, and sequencing grade trypsin (20 ng/μL; Promega, Madison, WI), the peptides were purified on a macrotrap column packed with polymeric reversed-phase material (Michrom BioResources, Auburn, CA). The column was connected to an LCQDECA ion trap mass spectrometer (Thermo Scientific, San Jose, CA) equipped with a nanoelectrospray ion source. Full scan spectra were recorded over 350 to 2000 Da followed by MS/MS scans of the 3 most intense ions in the preceding full scan. Peak lists were analyzed using SEQUEST (Thermo Fisher Scientific, Waltham, MA).
Activation of α2-M by methylamine
Protease-binding to α2-M triggers a conformational change converting it to an activated form able to bind hormones.24 Proteases cannot be used to activate α2-M due to their damaging effects, which would prevent proper binding analysis. Considering this, previous workers demonstrated this conformational change can be mimicked by treatment with methylamine.24-26 Furthermore, physicochemical and functional data suggest that methylamine activated α2-M (α2-M-MA) closely resembles the structure and function of protease-activated α2-M.25,26
In vitro conversion of α2-M by methylamine into the activated protein (α2-M-MA) was achieved using an established technique where samples of α2-M (1.4 μM; Sigma-Aldrich) were treated with 200 mM methylamine/0.05 M Tris/HCl (pH 8.1).27 Unreacted methylamine was removed from α2-M-MA via a Sephadex G-25 centrifugal column.28,29
Determination of α2-M and α2-M-MA-hepcidin complex stoichiometry by ultracentrifugation
α2-M (Mw 720 000 Da) can be sedimented by ultracentrifugation.30 We exploited this method to determine α2-M-hepcidin and α2-M-MA-hepcidin complex stoichiometry.
The mixture of α2-M or α2-M-MA with hepcidin (molar ratio, 1:5; at this molar ratio hepcidin is above the α2-M and α2-M-MA saturating concentration) was incubated at 37°C for 2 hours and then subjected to ultracentrifugation at 180 000g for 2 hours at 37°C. Control tubes contained hepcidin only. The amount of hepcidin bound to α2-M or α2-M-MA was calculated by subtracting the hepcidin concentration in the supernatant before and after ultracentrifugation. The number of hepcidin binding sites was calculated as the molar ratio of the bound hepcidin to total α2-M. In preliminary experiments using the ultracentrifugation of α2-M and α2-M-MA without any hepcidin added, we proved by measurement of total protein (Quick Start Protein Assay Kit; Bio-Rad) that no α2-M remained in the supernatant after ultracentrifugation, as it was completely pelleted. We also verified that the hepcidin concentration in the control tubes was the same before and after centrifugation.
Determination of the Kd for hepcidin-α2-M and hepcidin-α2-M-MA
To determine the equilibrium dissociation constant (Kd) for hepcidin-binding to α2-M, samples containing a constant amount of α2-M or α2-M-MA and increasing concentrations of 125I-hepcidin were incubated for 2 hours at 37°C and separated using native electrophoresis. The radiogram was quantified using Aida software (Raytest).
Under our conditions, the determination of Kd from the binding curve required correction for hepcidin depletion. Assuming that nonactivated α2-M contains 2 binding sites for hepcidin (as indicated from ultracentrifugation experiments), we calculated the free hepcidin concentration for each well by subtraction of the bound hepcidin obtained from the y-axis values. The binding hyperbola were processed using GraphPad Prism 3.00 (GraphPad Software, San Diego, CA).
The binding data for α2-M-MA were fitted using a multisite Hill equation.31 The free hepcidin concentration was calculated using the numerical solution of an implicit binding function (see equations 1FD2–3). The data analysis was based on the concerted binding reaction:

with the dissociation equilibrium constant:
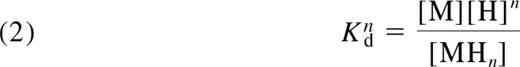
where M denotes α2-M; H, hepcidin; n, the cooperativity coefficient; and the square brackets denote concentration. We derived the modified Hill equation, that is expressed in terms of the total concentrations (hence subscript 0) of hepcidin and macroglobulin:
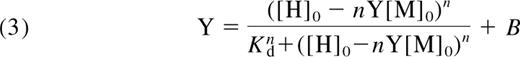
where Y is the ratio of the concentration of the hepcidin-α2-M complex to that of total α2-M. The fitting of equation 3 to the data involved iteration of the values of n and Kd combined with the numerical solution of equation 3, using NSolve in Mathematica.32 Refinement of the choices of values for n and Kd were made by inspection of fit of the function to the data. The use of nonlinear regression was not possible because of the implicit (in Y) nature of equation 3.
Cell culture and Western analysis
J774 cells (ATCC) were grown using standard procedures33 and used when at approximately 90% confluence to maximize ferroportin detection. Western analysis was performed by established methods34,35 using the Invitrogen NuPAGE Novex System for optimal detection (Carlsbad, CA). Briefly, protein samples (100 μg) were separated on NuPAGE Bis-Tris 4% to 12%, 1.5 mm gels (Invitrogen) and then transferred to Invitrolon PVDF membranes. The primary antibodies used were anti-ferroportin (1/2500; Dr D. Haile, Audie Murphy Hospital, San Antonio, Texas) and anti–β-actin (1/10 000; clone AC-1; Sigma-Aldrich). Secondary antibodies used were anti–rabbit (1:2000; Sigma-Aldrich) and anti–mouse (1:10 000; Sigma-Aldrich) conjugated with horseradish peroxidase. Incubation with the primary antibody was for 2 hours at room temperature (RT), and with the secondary antibody for 1 hour at RT both in 10% skim milk (Tris-buffered saline/0.1% Tween 20; pH 7.4). The protein bands were visualized using ECL (GE Healthcare). Bands on x-ray film were quantified by scanning densitometry and analyzed using Quantity One (Bio-Rad).
Statistical analysis
Results were expressed as mean plus or minus SD. Data were compared using the Student t test. Results were considered significant for P values less than .05.
Results
125I-labeling of native and M21Y hepcidin
We hypothesized that similar to other hormones, hepcidin circulates bound to specific binding protein(s).16,36 We examined the presence and identity of binding proteins using 125I-hepcidin and native nondissociative separation techniques.
Synthetic hepcidin must be renatured to be a soluble and effective signaling molecule. This was performed using established methods and the biologic activity tested using mice.1 Active hepcidin can be labeled by 125I and used as a tracer. Because tyrosine, which is considered to be optimal for efficient radio-iodination, is not present in natural human hepcidin, modified hepcidin with a Met/Tyr23 substitution (M21Y modified) was also assessed, as in previous studies.1,6 This modified hepcidin was compared with unmodified (physiologically relevant) hepcidin.
In preliminary experiments, we compared the 125I-labeling efficiency of both unmodified hepcidin (DTHFPICIFCCGCCHRSKCGMCCKT), containing 2 histidines and 2 phenylalanines, which can be iodinated,37 and the M21Y-modified human hepcidin. We performed 2 parallel labelings of the same amount of either peptide using equal amounts of 125I. Interestingly, both forms of hepcidin were labeled with similar specific activity (unmodified hepcidin, 1.6 μCi/μg; modified hepcidin, 2.1 μCi/μg). Hence, under these labeling conditions, tyrosine modification of hepcidin only slightly increased bound 125I.
To avoid the possible problem that M21Y-modified hepcidin may behave differently from unmodified hepcidin, we used only unmodified (physiologically relevant), 125I-labeled, HPLC-purified (Figure 1A) human hepcidin in all further experiments described below. Importantly, this peptide was shown to display physiologic activity by significantly (P < .01) decreasing the saturation of transferrin with iron after it was injected into mice (Figure 1B), demonstrating its utility for further studies. There was no difference in the ability of labeled or nonlabeled hepcidin to decrease transferrin iron saturation, demonstrating the functional integrity of the peptide.

Preparation of bioactive hepcidin. (A) The HPLC profile of purified 125I-hepcidin. Synthetic human hepcidin was renatured, labeled using 125I, as described in “Methods,” and subjected to HPLC purification (broken line: 125I radioactivity; solid line: 210 nm UV absorbance). More than 98% of the peptide was present in the main 125I peak. (B) Hepcidin significantly (*P < .01) decreases the saturation of transferrin (Tf) with iron when mice were injected with the renatured peptide. Results in panel A are typical of 3 or 4 experiments, while those in panel B are mean ± SD (3-4 experiments).
Preparation of bioactive hepcidin. (A) The HPLC profile of purified 125I-hepcidin. Synthetic human hepcidin was renatured, labeled using 125I, as described in “Methods,” and subjected to HPLC purification (broken line: 125I radioactivity; solid line: 210 nm UV absorbance). More than 98% of the peptide was present in the main 125I peak. (B) Hepcidin significantly (*P < .01) decreases the saturation of transferrin (Tf) with iron when mice were injected with the renatured peptide. Results in panel A are typical of 3 or 4 experiments, while those in panel B are mean ± SD (3-4 experiments).
Identification of 2 hepcidin-binding proteins
After incubation of human plasma or serum with 125I-hepcidin and subsequent separation using nondenaturing native electrophoresis, 2 major bands (labeled as “?”) were detected corresponding to complexes of 125I-hepcidin with unknown molecules (Figure 2A). The migration of the 2 bands on Figure 2A are markedly different, at least in part, probably due to their differences in Mr. Free hepcidin is not visible, because as a cationic peptide, it migrates out of the sample well toward the cathode. For purification of these protein complexes and their identification by mass spectrometry, we required a nondenaturing separation technique that preserves 125I-hepcidin-binding protein interactions and enables high resolution separation of the many plasma proteins. To meet these requirements, we used an established nondenaturing, 2-dimensional separation technique to identify the hepcidin-binding plasma protein(s).17 This method combines FPLC with native electrophoresis and is compatible with mass spectrometry.17

125I-hepcidin binds to 2 unknown molecules in plasma and serum. (A) Human plasma (10 μL) or serum (10 μL) were incubated with 125I-human hepcidin (2.8 μM) for 1 hour at 37°C and 2 bands were detected ↓ corresponding to a complex of 125I-human hepcidin with unknown binding proteins. (B) Native fast-pressure liquid chromatography (FPLC) fractionation of blood plasma followed by (C) separation of fractions using native-gradient PAGE. FPLC fractions were trace labeled with 125I-hepcidin and separated by native gradient PAGE. After electrophoresis, the gel was vacuum dried, exposed to a storage phosphorimaging screen, and scanned on a phosphorimager. Results are typical of 3 or 4 experiments.
125I-hepcidin binds to 2 unknown molecules in plasma and serum. (A) Human plasma (10 μL) or serum (10 μL) were incubated with 125I-human hepcidin (2.8 μM) for 1 hour at 37°C and 2 bands were detected ↓ corresponding to a complex of 125I-human hepcidin with unknown binding proteins. (B) Native fast-pressure liquid chromatography (FPLC) fractionation of blood plasma followed by (C) separation of fractions using native-gradient PAGE. FPLC fractions were trace labeled with 125I-hepcidin and separated by native gradient PAGE. After electrophoresis, the gel was vacuum dried, exposed to a storage phosphorimaging screen, and scanned on a phosphorimager. Results are typical of 3 or 4 experiments.
Fractions of plasma from the first dimension of the preparative separation using FPLC (Mono Q column; Figure 2B) were collected, and aliquots from each were trace labeled with 125I-labeled hepcidin with which it was incubated for 1 hour at 37°C. The labeled fractions were then separated by native 3% to 12% gradient polyacrylamide gel electrophoresis (PAGE) as a second dimension of separation (Figure 2C). Fraction 13 contained only the lower, rapidly migrating band in Figure 2A, while fractions 15 to 17 contained both the lower and top bands (Figure 2C). Thus, the latter fractions were pooled and used for further analysis, described in the next section below, to identify the 125I-hepcidin-binding molecules. It was of interest to note that the upper band in fraction 15 consisted of a doublet (Figure 2C). This could correspond to the activated and nonactivated forms of α2-M that are known to migrate slightly differently24,38 (see also Figure 7).
Examination of the hepcidin-binding proteins in blood
To identify the uppermost hepcidin-binding protein shown on Figure 2A, fractions 15 through 17 in Figure 2C were concentrated on centrifugal ultrafilters (Millipore Ultrafree NMW 3000) and resolved by native 3% to 12% gradient PAGE. When an aliquot of the pooled fractions was separated by native gradient PAGE and stained for protein with Coomassie blue (Figure 3A lane 1), the top band was in a similar migration position as the 125I-hepcidin-binding molecule detected by phosphorimaging after a 1 hour incubation of 125I-hepcidin with either human plasma (Figure 3A lane 2) or pooled fractions 15 through 17 (Figure 3A lane 3). The band resulting from the addition of 125I-hepcidin to plasma (Figure 3A lane 2) or pooled fractions 15 through 17 (Figure 3A lane 3) comigrated with a band resulting from the incubation of 125I-hepcidin with purified α2-M for 1 hour at 37°C (Figure 3A lane 4). It is important to note that the uppermost band was well resolved from adjacent proteins, allowing subsequent MS analysis (described in the next paragraph).

Identification of α2 macroglobulin as a hepcidin-binding protein. (A) A hepcidin-binding protein in complete human plasma or fractionated plasma comigrates with a complex of purified α2-macroglobulin (α2-M) and 125I-hepcidin. Lane 1: fractions 15 through 17 from the plasma fractionation experiment (see Figure 2C) were pooled and concentrated, separated by native gradient PAGE, and stained using Coomassie blue. Lanes 2 through 4 (phosphorimager scan of a different gel run in parallel to the Coomassie blue gel in lane 1): complete human plasma (lane 2), pooled fractions 15 through 17 (lane 3; from Figure 2C) and purified α2-M (10 μg; lane 4) were incubated with 125I-hepcidin (2.8 μM) for 1 hour at 37°C and separated by native PAGE and visualized using a phosphorimager. (B,C) Identification of the hepcidin-binding protein in blood plasma by mass spectrometry. MS/MS spectrum confirming the identity of α2-M in the top band of panel A. The region of the gel corresponding to the top band that consists of 125I-hepcidin bound to an unknown plasma protein from pooled fractions 15 through 17 (Figure 3A lane 3) was cut from the gel and digested with trypsin. The resulting tryptic peptides were separated on a C18 column connected online to the mass spectrometer. Each full scan experiment measuring the peptide masses was followed by 3 MS/MS fragmentation scans providing sequence information of the fragmented peptides. As a representative example of one peptide identification, the full MS scan (B) and fragmentation MS/MS spectrum of the peptide 493LSFYYLIMAK502 (C) from α2-M is shown. The MS spectrum exhibits intense signals at m/z 625.2 (circled) and 1248.3. These signals represent doubly- and singly-charged ions of the peptide, respectively. The near complete series of C-terminal y-ions in the MS/MS spectrum of doubly-charged ions clearly confirms the α2-M peptide sequence 493LSFYYLIMAK502 (panel C top line). The major peak in the full scan spectrum at m/z 923.2 corresponds to an additional coeluting peptide originating from α2-M, as was confirmed by its MS/MS spectrum (not shown).
Identification of α2 macroglobulin as a hepcidin-binding protein. (A) A hepcidin-binding protein in complete human plasma or fractionated plasma comigrates with a complex of purified α2-macroglobulin (α2-M) and 125I-hepcidin. Lane 1: fractions 15 through 17 from the plasma fractionation experiment (see Figure 2C) were pooled and concentrated, separated by native gradient PAGE, and stained using Coomassie blue. Lanes 2 through 4 (phosphorimager scan of a different gel run in parallel to the Coomassie blue gel in lane 1): complete human plasma (lane 2), pooled fractions 15 through 17 (lane 3; from Figure 2C) and purified α2-M (10 μg; lane 4) were incubated with 125I-hepcidin (2.8 μM) for 1 hour at 37°C and separated by native PAGE and visualized using a phosphorimager. (B,C) Identification of the hepcidin-binding protein in blood plasma by mass spectrometry. MS/MS spectrum confirming the identity of α2-M in the top band of panel A. The region of the gel corresponding to the top band that consists of 125I-hepcidin bound to an unknown plasma protein from pooled fractions 15 through 17 (Figure 3A lane 3) was cut from the gel and digested with trypsin. The resulting tryptic peptides were separated on a C18 column connected online to the mass spectrometer. Each full scan experiment measuring the peptide masses was followed by 3 MS/MS fragmentation scans providing sequence information of the fragmented peptides. As a representative example of one peptide identification, the full MS scan (B) and fragmentation MS/MS spectrum of the peptide 493LSFYYLIMAK502 (C) from α2-M is shown. The MS spectrum exhibits intense signals at m/z 625.2 (circled) and 1248.3. These signals represent doubly- and singly-charged ions of the peptide, respectively. The near complete series of C-terminal y-ions in the MS/MS spectrum of doubly-charged ions clearly confirms the α2-M peptide sequence 493LSFYYLIMAK502 (panel C top line). The major peak in the full scan spectrum at m/z 923.2 corresponds to an additional coeluting peptide originating from α2-M, as was confirmed by its MS/MS spectrum (not shown).
Guided by the phosphorimager scan, the top band in Figure 3A (lane 3) was cut from the gel. This band corresponded to a complex of 125I-hepcidin with an unknown protein from fractions 15 through 17. This segment of gel was rehydrated, digested with trypsin, and subjected to MS analysis. The unknown protein was unambiguously identified by μLC-MS/MS analysis as α2-M (P01023; Table 2). A SEQUEST search against the human SwissProt database assigned 55 peptides to the protein covering 52% of the α2-M sequence (Figure 3B,C; Table 2). It is notable from Table 2 that other proteins were also identified, although the abundance was far lower (number of peptides: 2-6). These comigrating molecules were also tested for 125I-hepcidin-binding, but no significant affinity was identified (data not shown). Hence, considering the low abundance of these other proteins in comparison to α2-M and their lack of hepcidin-binding ability, they were considered contaminants.
Identification of the hepcidin-binding protein in plasma as α-2-macroglobulin
| Band no. | Protein name | DTB no. | MW, kDa | No. of peptides |
|---|---|---|---|---|
| 1 | α-2-macroglobulin precursor* | P01023 | 163 | 55 |
| 1 | Ig kappa chain C region | P01834 | 12 | 2 |
| 1 | Ig lambda chain C regions | P01842 | 11 | 3 |
| 1 | Ig gamma-1 chain C region | P01857 | 36 | 6 |
| 1 | Ig gamma-2 chain C region | P01859 | 36 | 6 |
| 1 | Ig gamma-4 chain C region | P01861 | 36 | 2 |
| 1 | Ig alpha-1 chain C region | P01876 | 38 | 4 |
| 2 | Serum albumin precursor | P02768 | 69 | 40 |
DTB indicates Swiss-Prot number; and MW, molecular weight.
α2-M: P01023: Pooled fractions 15 through 17 (see Figure 3A lane 3) were cut from the gel, rehydrated, digested with trypsin, and subjected to MS analysis. The unknown protein was identified by LC-MS/MS analysis as α2-M. The results are typical from 3 experiments.
To further confirm that α2-M was a specific hepcidin-binding protein, we performed α2-M immunoprecipitation experiments on human plasma followed by stripping ligands from α2-M with strongly acidic buffer and ultrafiltration of released peptides on a Millipore Ultrafree filter, Mr cutoff 5 kDa. We proved by mass spectrometry the presence of hepcidin in the ultrafiltrate. Other peptides, known to be bound by α2-M, were also identified, such as osteoprotegerin.14 The detectability of hepcidin in MG immunoprecipitates from different individuals varied widely, and this was probably due to the broad intra- and interpersonal levels of hepcidin.39 Moreover, α2-M was confirmed as a major hepcidin-binding protein by other approaches described as shown in the next section.
Super-shift analysis further confirms α2-M is a hepcidin-binding protein
Additional evidence that α2-M was the hepcidin-binding protein was obtained by supershift analysis (Figure 4A,B). Human plasma was incubated with 125I-hepcidin (2.8 μM) for 1 hour at 37°C. This sample was then divided into equal portions to which increasing amounts of anti–α2-M antibody was added (5-20 μL; concentration: 200 μg/mL) and the samples were separated using native-gradient PAGE. Increasing amounts of anti–α2-M antibody led to a progressive supershift of the band into the sample well (Figure 4A,B). This was consistent with the formation of a high Mr complex between the antibody and 125I-hepcidin-α2-M complex, which, due to its large size, remained in the sample well (Figure 4A). It is relevant to note that hepcidin is a cationic peptide and thus unbound hepcidin does not migrate into the gel. Hence, in the absence of anti–α2-M antibody (Figure 4A lane 1), some radioactivity still remained in the sample well. Control studies using a nonspecific antibody (ie, anti–cyclin D1) did not result in a supershift (Figure 4A). Collectively, these studies demonstrated that anti–α2-M antibody super-shifts the 125I-hepcidin-α2-M complex, again confirming that α2-M is a hepcidin-binding protein.

Hepcidin-binding protein in plasma is supershifted with an anti–α2-M antibody. (A) Human plasma was incubated with 125I-human hepcidin (2.8 μM) for 1 hour at 37°C. This sample was then divided into portions to which increasing amounts of anti–α2-M antibody (5-20 μL; concentration 200 μg/mL) or anti–cyclin D1 antibody (20 μL; concentration 200 μg/mL) were added. The samples were separated using native-gradient PAGE. After electrophoresis, the gel was vacuum dried, scanned, and analyzed using a phosphorimager. Results are typical from 3 separate experiments. (B) The radioactivity in the 125I-hepcidin–α2-M protein band (▴) and the sample wells (■) were plotted to show that the addition of anti–α2-M antibody progressively decreases the radioactivity in the 125I-hepcidin–binding protein band and increases the activity in the sample wells. The activity in the wells is because the high molecular weight antibody–α2-M complex cannot penetrate into the gel. The radioactivity in the sample well with no antibody is caused by the presence of cationic free hepcidin, which does not migrate into the gel. Results are typical of 3 separate experiments.
Hepcidin-binding protein in plasma is supershifted with an anti–α2-M antibody. (A) Human plasma was incubated with 125I-human hepcidin (2.8 μM) for 1 hour at 37°C. This sample was then divided into portions to which increasing amounts of anti–α2-M antibody (5-20 μL; concentration 200 μg/mL) or anti–cyclin D1 antibody (20 μL; concentration 200 μg/mL) were added. The samples were separated using native-gradient PAGE. After electrophoresis, the gel was vacuum dried, scanned, and analyzed using a phosphorimager. Results are typical from 3 separate experiments. (B) The radioactivity in the 125I-hepcidin–α2-M protein band (▴) and the sample wells (■) were plotted to show that the addition of anti–α2-M antibody progressively decreases the radioactivity in the 125I-hepcidin–binding protein band and increases the activity in the sample wells. The activity in the wells is because the high molecular weight antibody–α2-M complex cannot penetrate into the gel. The radioactivity in the sample well with no antibody is caused by the presence of cationic free hepcidin, which does not migrate into the gel. Results are typical of 3 separate experiments.
Size-exclusion chromatography via FPLC demonstrates α2-M is a hepcidin-binding protein
Binding of hepcidin to α2-M was further confirmed by size-exclusion chromatography using FPLC. As shown in the inset of Figure 5, a complex of purified α2-M and 125I-hepcidin comigrated with the peak of radioactivity formed in blood plasma after addition of 125I-hepcidin. Again, this evidence supports the experiments above, confirming the role of α2-M as a hepcidin-binding protein.

Analysis of the hepcidin-α2-M interaction using native FPLC. The main graph shows the UV absorbance of fractions of human plasma (broken line) and purified α2-M (broken line) separated by gel-size chromatography using FPLC (“Methods”). The inset shows that the complex of purified α2-M and 125I-hepcidin comigrates with the peak of radioactivity formed in blood plasma after addition of 125I-hepcidin. Free 125I-hepcidin (■); 125I-hepcidin incubated for 1 hour at 37°C with either plasma (▴; concentration 2.8 μM) or purified α2-M (●; 1.4 μM). Results are typical of 3 experiments.
Analysis of the hepcidin-α2-M interaction using native FPLC. The main graph shows the UV absorbance of fractions of human plasma (broken line) and purified α2-M (broken line) separated by gel-size chromatography using FPLC (“Methods”). The inset shows that the complex of purified α2-M and 125I-hepcidin comigrates with the peak of radioactivity formed in blood plasma after addition of 125I-hepcidin. Free 125I-hepcidin (■); 125I-hepcidin incubated for 1 hour at 37°C with either plasma (▴; concentration 2.8 μM) or purified α2-M (●; 1.4 μM). Results are typical of 3 experiments.
Serum albumin is the second 125I-hepcidin-binding protein, but binds the peptide nonspecifically
As shown in Figure 2A and C, 2 major bands were identified as hepcidin-binding proteins at the top and bottom of the gel. The studies above clearly identified the top band as α2-M. Identification of the 125I-hepcidin-binding protein in the lower band (Figure 2 A,C) was performed in an analogous way as described above for the top band (α2-M). The fractions 15 through 17 from the FPLC-resolved human plasma were pooled (Figure 2C), trace labeled with 125I-hepcidin (20 nM), and resolved by native gradient PAGE. After this band was cut from the gel and analyzed by mass spectrometry for its protein components, albumin was found to be the hepcidin-binding protein in the lower band (Table 2 band 2). Moreover, a Coomassie blue stained band of albumin (Sigma-Aldrich) shown in Figure 6A (second lane) corresponded to the most abundant protein in plasma, namely albumin (Figure 6A first lane). The lower-migrating 125I-hepcidin-binding protein in human plasma (Figure 6B first lane) comigrated with purified albumin labeled with 125I-hepcidin and detected by phosphorimaging (Figure 6B second lane). These experiments confirmed that albumin was the lower rapidly migrating 125I-hepcidin–binding protein in Figure 2A and C.

Confirmation that albumin is a second hepcidin-binding protein that binds this ligand nonspecifically. (A) Whole human plasma and albumin (purity: 99%) were separated using native PAGE and stained with Coomassie blue for protein. Note that the band of purified albumin comigrates with the most abundant protein present in human plasma (albumin). (B) Whole plasma and purified albumin were trace labeled with 125I-hepcidin, resolved by native PAGE, and visualized using a phosphorimager. The band of purified albumin-125I-hepcidin comigrates with the bottom band present in human plasma (albumin), which also binds 125I-hepcidin. The top band in lane 1 is 125I-hepcidin bound to α2-M. (C) Increasing amounts of 125I-hepcidin (up to 1400 nM) were added to albumin (1.5 nM), the mixture was incubated for 1 hour at 37°C, separated by native PAGE, and the albumin–125I-hepcidin complex was visualized and quantified using a phosphorimager. Results in panels A and B are typical of 3 experiments while those in panel C are mean ± SD of 3 experiments.
Confirmation that albumin is a second hepcidin-binding protein that binds this ligand nonspecifically. (A) Whole human plasma and albumin (purity: 99%) were separated using native PAGE and stained with Coomassie blue for protein. Note that the band of purified albumin comigrates with the most abundant protein present in human plasma (albumin). (B) Whole plasma and purified albumin were trace labeled with 125I-hepcidin, resolved by native PAGE, and visualized using a phosphorimager. The band of purified albumin-125I-hepcidin comigrates with the bottom band present in human plasma (albumin), which also binds 125I-hepcidin. The top band in lane 1 is 125I-hepcidin bound to α2-M. (C) Increasing amounts of 125I-hepcidin (up to 1400 nM) were added to albumin (1.5 nM), the mixture was incubated for 1 hour at 37°C, separated by native PAGE, and the albumin–125I-hepcidin complex was visualized and quantified using a phosphorimager. Results in panels A and B are typical of 3 experiments while those in panel C are mean ± SD of 3 experiments.
Hepcidin-binding to albumin was found to be nonspecific, displaying nonsaturable kinetics in the range of up to a 1000-fold molar excess of hepcidin over albumin (Figure 6C). By quantitating radioactivity in the 2 hepcidin-containing bands (Figure 6B first lane), we found that 30% of plasma 125I-hepcidin was bound to α2-M, and the rest was associated with albumin. Considering this observation in relation to the fact that in humans the concentration of α2-M (∼ 2.8-5.5 μM)40,41 is 180 to 360 times less than albumin (≈ 1 mM),42 it was clear α2-M is the major and specific hepcidin transport molecule. Because the concentration of human hepcidin in plasma varies from 0 to 1.5 μM,39 it is apparent there is an excess of α2-M. Thus, it was important to determine the affinity of α2-M for hepcidin to assess the specificity of the interaction that is crucial for understanding its activity.
Identification of a cooperative mechanism of hepcidin binding to activated α2-M
To determine the α2-M-hepcidin affinity constant and stoichiometry, we examined 125I-hepcidin binding to α2-M to assess the hepcidin concentration required to saturate a constant amount of α2-M. We could not use the measurement of free and bound 125I-hepcidin because, in contrast to the 125I-hepcidin-α2-M complex, the free unbound hepcidin is a cationic peptide13 that does not migrate into gels. To separate the α2-M-125I-hepcidin complex, we performed native electrophoresis at 37°C to provide physiologically relevant temperature, ionic strength, and pH for the determination of the hepcidin-binding constant with both α2-M and α2-M-MA. This is an established technique used to examine interactions of physiologic ligands with α2-M.43,44
Under physiologic conditions, α2-M is activated to bind ligands by a range of proteases.45,46 This can be closely mimicked by treatment with methylamine (see “Materials”),24 and this method is preferred to protease activation that nonspecifically damages α2-M, perturbing the results. In fact, activation by MA is the established method of choice for examining binding of ligands to activated α2-M.24,27,43,44 Hence, in this investigation, we assessed the binding of hepcidin to α2-M and its MA-activated form (α2-M-MA; Figure 7A-C). Binding of 125I-hepcidin to nonactivated α2-M resulted in a curve indicating a single saturable class of noninteracting 125I-hepcidin-binding sites (Figure 7A). Fitting of these data and Scatchard analysis led to an estimate of 2 hepcidin-binding sites per α2-M molecule, with a Kd of 177 (± 27) nM (equation 3). Using 125I-hepcidin, we were able to demonstrate that increasing concentrations of unlabeled hepcidin compete with 125I-hepcidin, preventing binding of the label to α2-M (Figure 7B). These data demonstrate that the labeled peptide was both functional and competitive at concentrations approximated by the previously measured Kd in binding with the unlabeled peptide.

Characterization of α2-macroglobulin interaction with hepcidin and confirmation of the biologic activity of the α2-macroglobulin-hepcidin complex. (A) Saturation binding curve of 125I-human hepcidin with nonactivated α2-M demonstrating a single class of noninteracting binding sites. (B) Increasing concentrations of unlabeled hepcidin competes with 125I-hepcidin preventing binding of the label to α2-M. (C) Migration of methylamine-activated human macroglobulin (α2-M-MA) differs from nonactivated α2-M. (D) Saturation binding curve of 125I-human hepcidin with α2-M-MA demonstrating sigmoidal binding. This indicated allosteric cooperativity and the identification of higher order hepcidin-binding to α2-M-MA. In contrast, nonactivated α2-M demonstrated a hyperbolic function that corresponded to 2 independent binding sites with the same affinity. (E) Western analysis demonstrating that the α2-M–hepcidin complex, but not the α2-M–albumin complex reduces ferroportin expression in J774 cells. (A,D) Samples of 100 μg α2-M or α2-M-MA were incubated for 1 hour at 37°C with increasing concentrations of 125I-human hepcidin. The samples were separated using native gradient (3%-12%) PAGE. After electrophoresis, the gel was scanned on a phosphorimager and analyzed using Aida and GraphPad software. (B) α2-M (143 nM) was incubated for 1 hour at 37°C with 125I-human hepcidin (717 nM) and increasing concentrations of unlabeled hepcidin from 150 to 1200 nM. The samples were separated using native gradient (3%-12%) PAGE. After electrophoresis, the gel was scanned and analyzed as in panels A and D. (C) α2-M and α2-M-MA were resolved on a native gel as described for panels A and C and then stained with Coomassie blue protein stain. (E) J774 cells were incubated for 6 hours at 37°C in culture media without FCS containing either hepcidin (0.7 μM), α2-M (2.8 μM), hepcidin (0.7 μM) + α2-M (2.8 μM), albumin (2.8 μM), or hepcidin (0.7 μM) + albumin (2.8 μM). Results in panels A, B, and D are mean ± SD from 3 separate experiments, while panel C shows a typical gel from 3 experiments performed. The Western analysis shown in panel E is from a typical blot, while the densitometric scan is mean ± SD from 5 or 6 experiments. *P < .05; **P < .01.
Characterization of α2-macroglobulin interaction with hepcidin and confirmation of the biologic activity of the α2-macroglobulin-hepcidin complex. (A) Saturation binding curve of 125I-human hepcidin with nonactivated α2-M demonstrating a single class of noninteracting binding sites. (B) Increasing concentrations of unlabeled hepcidin competes with 125I-hepcidin preventing binding of the label to α2-M. (C) Migration of methylamine-activated human macroglobulin (α2-M-MA) differs from nonactivated α2-M. (D) Saturation binding curve of 125I-human hepcidin with α2-M-MA demonstrating sigmoidal binding. This indicated allosteric cooperativity and the identification of higher order hepcidin-binding to α2-M-MA. In contrast, nonactivated α2-M demonstrated a hyperbolic function that corresponded to 2 independent binding sites with the same affinity. (E) Western analysis demonstrating that the α2-M–hepcidin complex, but not the α2-M–albumin complex reduces ferroportin expression in J774 cells. (A,D) Samples of 100 μg α2-M or α2-M-MA were incubated for 1 hour at 37°C with increasing concentrations of 125I-human hepcidin. The samples were separated using native gradient (3%-12%) PAGE. After electrophoresis, the gel was scanned on a phosphorimager and analyzed using Aida and GraphPad software. (B) α2-M (143 nM) was incubated for 1 hour at 37°C with 125I-human hepcidin (717 nM) and increasing concentrations of unlabeled hepcidin from 150 to 1200 nM. The samples were separated using native gradient (3%-12%) PAGE. After electrophoresis, the gel was scanned and analyzed as in panels A and D. (C) α2-M and α2-M-MA were resolved on a native gel as described for panels A and C and then stained with Coomassie blue protein stain. (E) J774 cells were incubated for 6 hours at 37°C in culture media without FCS containing either hepcidin (0.7 μM), α2-M (2.8 μM), hepcidin (0.7 μM) + α2-M (2.8 μM), albumin (2.8 μM), or hepcidin (0.7 μM) + albumin (2.8 μM). Results in panels A, B, and D are mean ± SD from 3 separate experiments, while panel C shows a typical gel from 3 experiments performed. The Western analysis shown in panel E is from a typical blot, while the densitometric scan is mean ± SD from 5 or 6 experiments. *P < .05; **P < .01.
In accordance with previous studies,20 MA-activation caused a mobility shift in α2-M migration on native electrophoresis, suggesting a conformational change (Figure 7C). In contrast to nonactivated α2-M (Figure 7A), activated α2-M-MA bound hepcidin and resulted in a sigmoidal saturation curve as a function of increasing 125I-hepcidin concentration (Figure 7D). The shape of this curve was typical of cooperative allosteric binding47 and its analysis using a modified Hill equation (see “Methods”) demonstrated that activation of α2-M led to the appearance of additional binding sites. Fitting to the data gave the number of binding sites as n∼3 with a Kd for each site being approximately 0.3 μM. The estimate of n∼3 represents the lowest number of hepcidin molecules bound to the α2-M oligomer, as the Hill equation does not account for subtle variations between affinities of the sites, thus limiting precision in this calculation.
To definitively define the stoichiometry of hepcidin-binding to α2-M-MA, ultracentrifugation was used (see “Methods”). This method enabled separation of bound hepcidin (pelleted) and unbound hepcidin (not pelleted) and demonstrated that each molecule of α2-M or α2-M-MA bound 1.98 + 0.11 and 4.1 + 0.19 (3 experiments) molecules of hepcidin, respectively. This value was further substantiated by the data in Figure 7D, showing that the binding curve plateaued as the hepcidin to α2-M molar ratio was increased to 4. Collectively, our data indicate the presence of 4 hepcidin-binding sites per α2-M-MA molecule.
The α2-M-hepcidin complex decreases ferroportin expression in J774 cells
To assess the functional effect of the α2-M-hepcidin complex, studies were initiated using commercial α2-M (Sigma-Aldrich) and J744 cells that express ferroportin48,49 and respond to hepcidin by reducing ferroportin expression.50,51 Cells were incubated for 6 hours at 37°C in media without FCS containing: hepcidin (0.7 μM), α2-M (2.8 μM), hepcidin (0.7 μM) plus α2-M (2.8 μM), albumin (2.8 μM), or hepcidin (0.7 μM) plus albumin (2.8 μM; Figure 7E). Before the addition to cells, all solutions were incubated for 1 hour at 37°C to ensure complex formation. Hepcidin only slightly (P > .05) reduced ferroportin, while α2-M alone or α2-M plus hepcidin significantly (P < .05 and P < .01, respectively) decreased its expression (Figure 7E). A potential reason for α2-M alone reducing ferroportin expression may be contamination with hepcidin present in the purified α2-M, as found in studies examining other α2-M ligands.14 This effect of α2-M alone was observed in different lots of the protein from Sigma-Aldrich and also when it was purchased from a different source (Sapphire Bioscience, Sydney, Australia). In contrast to the α2-M plus hepcidin treatment, albumin plus hepcidin did not lead to any significant decrease in ferroportin (Figure 7E). These experiments demonstrate that the α2-M-hepcidin complex is functionally active and more effective than hepcidin alone at reducing ferroportin expression. Furthermore, it should be noted that this is not a nonspecific effect, as hepcidin added to the protein control (albumin) at the same concentration as α2-M had no significant effect on ferroportin expression. Previous studies by Kaplan and colleagues1 have shown that the effect of hepcidin on down-regulating ferroportin is far more complete than that demonstrated in Figure 7E. However, it is notable that Kaplan et al used HEK293 cells transfected with ferroportin, which hyperexpress this protein.1 Hence, the comparison to J744 cells cannot be readily made as the latter express ferroportin under a physiologic control mechanism. Furthermore, the study of Kaplan et al assessed membrane ferroportin expression, while we examined total cellular ferroportin, which is less likely to demonstrate ablation after only 6 hours of incubation with α2-M–hepcidin. Other authors using western blots have also shown, in J774 cells, that the response of ferroportin to hepcidin is less than complete.50
Discussion
We hypothesized that in analogy to other hormones,52-54 hepcidin would circulate bound to specific binding proteins. We used 125I-hepcidin to demonstrate the presence of hepcidin-binding proteins in human blood. To identify these proteins by mass spectrometry, we purified 125I-labeled hepcidin-binding protein complexes using a native 2-dimensional technique consisting of FPLC and nondenaturing PAGE.17 The hepcidin-binding proteins were identified as α2-M and albumin (Figures 3,Figure 4,Figure 5–6).
The identity of α2-M as a specific, high-affinity, hepcidin-binding protein was confirmed by the following evidence: (1) purified α2-M binds 125I-hepcidin and this complex comigrates with the band obtained by adding 125I-hepcidin to fractionated or whole plasma as shown in Figure 3A; (2) the hepcidin-binding protein complex in plasma was recognized and super-shifted with an anti–α2-M antibody (Figure 4), but not by a nonspecific control antibody; (3) native size-exclusion chromatography demonstrated the 125I-hepcidin-carrier protein complex in plasma was coeluting with 125I-hepcidin added to purified α2-M (Figure 5); and (4) Kd measurements demonstrated specific 125I-hepcidin-binding to 2 (α2-M) and 4 (α2-M-MA) high-affinity sites on the protein, with evidence of allosteric cooperativity in α2-M-MA (Figure 7). These studies were confirmed by ultra-centrifugation, where α2-M or α2-M-MA bound 2 or 4 hepcidin ligands per molecule, respectively.
The current results are significant, as it has been previously thought that due to the low Mr of hepcidin (≈ 2800 Da),55 it would be rapidly cleared by the kidney, reducing its half-life. The specific binding of α2-M prevents this clearance, and, hence, markedly modulates the activity of the peptide. If we consider a theoretical calculation where all α2-M is activated (Kd: 0.3 μM) and the affinity of albumin for hepcidin is weak (assumed/approximated Kd:1 mM), then approximately 11% of hepcidin would be free. This may explain the presence of some hepcidin in urine.13
This is the first demonstration that α2-M is a high-affinity hepcidin-binding molecule. Moreover, upon activation, there is evidence of multiple allosteric binding sites on α2-M-MA, and this has not been described for its other ligands. Further, these observations suggest a regulatory role for α2-M on hepcidin function. It is known that α2-M is a multifunctional plasma protein.24 The first described function of α2-M was its “trapping” and inhibition of proteases.56 This inhibition process triggers a conformational change in α2-M, converting it to the activated form, which binds hormones, signaling molecules, etc.24 In fact, numerous molecules bind to α2-M and α2-M-MA, such as transforming growth factor-β types 1 and 2,57,58 platelet-derived growth factor,59 nerve growth factor,60 tumor necrosis factor-α,15 basic fibroblast growth factor,61 interleukins-1, -6, and -8,62-64 vascular endothelial growth factor,65 growth hormone,66 osteoprotegerin,14 leptin,52 activin, and inhibin.67 The binding affinities (Kd) of α2-M and α2-M-MA for their ligands are rarely described, but for some24,68,69 it was reported to lie within 10−7 to 10−9 M, which corresponds to the affinity of α2-M for hepcidin (ie, α2-M, Kd = 177 nM; α2-M-MA, Kd ≈ 0.3 μM) observed herein.
Panyutich and Ganz36 demonstrated that α2-M-MA binds anti-microbial peptides known as defensins, which have some homology to hepcidin. However, these authors did not demonstrate cooperative allosteric binding. Considering the cooperativity found upon hepcidin-binding to α2-M-MA (Figure 7D), it is relevant to discuss that a sigmoidal binding curve is also observed when O2 binds with the 4 heme centers of hemoglobin, leading to efficient uptake and release.47 Analogously, the efficient binding and release of 4 hepcidin molecules to α2-M mediated via allosteric activation may be crucial for its function. It is notable that again, like hemoglobin, α2-M is composed of 4 subunits,24 thus alterations in interactions between subunits may lead to cooperative binding.
The functionality of the α2-M–hepcidin complex was shown in our studies where it was more effective than hepcidin alone at reducing ferroportin-1 expression (Figure 7E). The precise mechanism inducing this effect is unknown. However, ligands bound to α2-M undergo endocytosis by binding to the α2-M receptor.24,70,71 This receptor is found in many cell types,72 and mediates ligand uptake and delivery to endosomes and lysosomes.24,73,74 Therefore, considering the ability of α2-M to target its ligands to cells,24 it is conceivable that hepcidin-binding to α2-M could influence hepcidin activity. Such alterations may include the half-life of hepcidin, its tissue transfer, and the binding of hepcidin to ferroportin. It is also possible that the α2-M–hepcidin complex binds to other receptors. Finally, the hepcidin-MG complex could play some signaling role once it is processed by the lysosome.
In conclusion, identification of α2-M as the hepcidin carrier will lead to deeper understanding of its role in iron metabolism. Because hepcidin has diagnostic potential, any method for determination of its blood concentration must take into account hepcidin-binding proteins. This investigation is important for understanding hepcidin function and its use in diagnostic tests.
The publication costs of this article were defrayed in part by page charge payment. Therefore, and solely to indicate this fact, this article is hereby marked “advertisement” in accordance with 18 USC section 1734.
Acknowledgments
The authors thank Mrtvá Ryba and old Sumava. We also appreciate assistance from Miroslav Kušiak and Vojtěch Drbohlav from Immunotech-Beckmann Coulter, Prague, Czech Republic. We also kindly acknowledge the assistance of the following people for their careful examination and comments on the manuscript before submission: Dr Katie Dixon, Dr Danuta Kalinowski, Ms Zaklina Kovacevic, Dr David Lovejoy, and Dr Helena Mangs.
This research was supported by grants to D.V. and J.P. from the Czech Science Foundation (GACR) No. 204/07/0830, No.204/03/H066, No. 305/09/1390, Ministry of Health (MZCR) grants MZCR/UHKT No. 023736, IGA MZCR No. NR8930-4, IGA MZCR NR8317-4, IGA No. NS 10300-3, and the Ministry of Education, Youth, and Sports of the Czech Republic (MSM) projects No. LC06044, No. LC07017, No. MSM 0021620858, No. 0021620806, and Institutional Research Concept AV0Z50200510 (IMIC). This project was also supported by a fellowship and grants from the NHMRC of Australia to D.R.R, a University of Sydney Short-Term Visiting Fellowship to D.V and D.R.R. and a University of Sydney Post-doctoral Fellowship to R.S.
Authorship
Contribution: G.P., J.P., K.K., I.H., P.H., P.W.K., S.S.-L., P.P., R.S., E.B., M.L.-H.H., and Y.S.R. designed and performed experiments and wrote sections of the manuscript; and D.V. and D.R.R. designed the study, obtained grant funding, and wrote the manuscript.
Conflict-of-interest disclosure: The authors declare no competing financial interests.
Correspondence: Des R. Richardson, Iron Metabolism and Chelation Program, Department of Pathology and Bosch Institute, Blackburn Bldg D06, University of Sydney, Sydney, New South Wales, 2006 Australia or Daniel Vyoral, Institute of Hematology and Blood Transfusion, U Nemocnice 1, Prague 2, 128 20, Czech Republic; e-mail: d.richardson@med.usyd.edu.au or Daniel.Vyoral@uhkt.cz.
