Abstract
It has been reported that infectious mononucleosis (IM)–symptomatic primary Epstein-Barr virus infection produces a global down-regulation of interleukin-15 receptor-α (IL-15Rα) on T cells and natural killer cells associated with a defective IL-15 responsiveness that lasts for many years after the disease episode. In contrast with these results, our data indicate that, in the T-cell compartment derived from remote IM subjects, there is no quantitative or qualitative defect in the expression of the IL-15Rα chain and no deficit in T-cell responsiveness to IL-15. We observed efficient signal transduction, survival, and proliferation even in response to low IL-15 concentrations. These data are relevant and shed new light on the immune long-term response in IM subjects because they contradict the hypothesis that defects in Epstein-Barr virus–host immune balance may be correlated with a long-lasting global deficit in T-cell responsiveness to IL-15.
Introduction
Interleukin-15 (IL-15) is a member of the 4-α-helix bundle cytokine family that plays a major role linking innate and adaptive immunity. The receptor for IL-15 (IL-15R) is composed of 3 chains: an IL-15Rα chain, capable of binding IL-15 with high affinity in the absence of other receptor subunits; the IL-15/IL-2 receptor β chain; and the γC chain that in turn bind IL-15 at low affinity.1,2 Remarkably, it has been shown that the cytoplasmic portion of human IL-15Rα contains motifs allowing association with adaptor molecules and kinases,3 also qualifying the IL-15Rα chain as a signaling subunit. In the absence of IL-15 or IL-15Rα, defects are observed in naive and memory CD8+ T cells, intestinal intraepithelial lymphocytes, and natural killer (NK) and NK/T lineages.4,5 Depending on the lymphoid lineage or stage of differentiation, IL-15 can act to increase survival, induce proliferation, and/or drive differentiation.6 IL-15Rα expression on immune competent cells is essential, and defects in its expression may impair lymphoid homeostasis at different levels.7-10
Modified expression and/or function of cytokines or cytokine receptor is a mechanism by which several viruses hijack these factors for escaping to immune response and/or improving their survival and expansion11 ; and in this respect, the IL-15/IL-15R system is modified in different viral pathologies. For instance, human herpes simplex virus-1 has been recently reported to induce IL-15 gene expression in human monocytic cells,12 whereas human T lymphotropic virus type I (HTLV-I) Tax protein trans-activates both IL-15 and IL-15Rα gene transcription through an nuclear factor–κB sites favoring spontaneous proliferation and resistance to apoptosis in adult T-cell leukemia cells.13,14 On the other hand, CD8+ T cells in human immunodeficiency virus (HIV) disease exhibit reduced expression of the γc chain in all maturation subsets of CD8+ T cells.15 Loss of IL-15Rβ and γc expression is also associated with disappearance of memory T cells in respiratory tract after influenza infection.16 Recently, it has also been reported that infectious mononucleosis (IM), the symptomatic form of primary Epstein-Barr virus (EBV) infection, leads to long-term down-regulation of IL-15Rα expression, which causes global deficit in T-cell responsiveness to IL-15.17
Primary infection with EBV is usually asymptomatic in childhood but may present as IM if it occurs later in life.18 The virus infects the oropharynx and then spreads throughout the lymphoid tissues, remaining latent in memory B cells.18 Although latent EBV infection usually remains asymptomatic, EBV may be associated with malignancies, such as nasopharyngeal carcinoma and as Burkitt lymphoma,19 and Hodgkin lymphoma (HL).20 Interestingly, a previous history of IM has been shown to increase the risk of HL.20 In addition, immunodeficiency increases the risk of EBV-associated lymphoid malignancies, and rare immunologic defects such as X-linked lymphoproliferative disease21 and NK cell deficiency22 are also associated with an increase in the risk of EBV-related malignancies. We were highly interested in these latter results suggesting a long-term global deficit in T-cell responsiveness to IL-15 for a better understanding of the immune response in IM subjects.
Thus, we initially reassessed the expression of the IL-15Rα chain and the IL-15 responsiveness in peripheral blood mononuclear cells (PBMCs) from subjects with remote IM, derived from freshly isolated blood and/or from samples subjected to short-term nitrogen fluid storage. Our data indicate that, in the T-cell compartment derived from these IM subjects, there is no defect in the expression of the IL-15Rα chain and no deficit in T-cell responsiveness to IL-15 because we observed signal transduction, survival, and proliferation even in response to low IL-15 concentrations.
Thus, we conclude that the IL-15/IL-15R system is completely efficient in the subjects that have undergone IM.
Methods
Study subjects
Eleven subjects with remote IM were analyzed. They were diagnosed with IM between one and 30 years before the present study. Diagnoses were based on clinical grounds and confirmed by EBV serology (heterophile antibody positivity and presence of antiviral capsid antigen-specific IgM antibodies, with subsequent isotype switching to IgG). Seven of these subjects were recruited for the purpose of the present study, allowing the analysis of fresh peripheral blood, whereas 4 post-EBV IM subjects were recruited from a study on the genetic control of EBV infection in the particular setting of HL.23 These donors belong to different families: one had a personal history of IM (IM11) before HL diagnosis and the 3 other post-EBV IM were siblings of 3 different subjects with HL (IM08, IM09, IM10). They gave a peripheral blood sample allowing storage of frozen PBMCs. Blood samples were also taken from 12 healthy adult volunteers, most of whom were in the same age range (18-30 years) as the IM subjects. The study was approved by the French Consultative Committee for the Protection of Persons in Biomedical Research of Hôpital Necker. Informed consent was obtained in accordance with the Declaration of Helsinki.
PBMCs and purified CD8+ T-cell cultures
Fresh PBMCs were isolated from healthy controls and subjects with past IM using standard Ficoll-hypaque density centrifugation with Ficoll-Paque (GE Healthcare, Little Chalfont, United Kingdom). After 2 rounds of depletion of monocytes by plastic adherence, primary blood lymphocytes (PBLs) were consistently at least 91% pure as determined by flow cytometry with color staining for CD14. Monocyte contamination was less than 2%. CD8+ T cells were purified by positive selection using the CD8 T-cell enrichment kits (CD8 microbeads; Miltenyi Biotec, Auburn, CA) according to the manufacturer's instructions. Purity of CD8+ T cells thus obtained was approximately 95%. CD8− fraction containing more than 95% of CD4+ T cells was used in some experiments.
PBLs or purified CD8+ T cells were cultured at 106 cells/mL in RPMI 1640 medium supplemented with 10% heat-inactivated fetal bovine serum (FBS) (Invitrogen, Carlsbad, CA), 2 mM L-glutamine, 100 U/mL penicillin, and 100 μg/mL streptomycin sulfate (Sigma-Aldrich, St Louis, MO) at 37°C in a 5% CO2 incubator and activated in 96-well plates in the presence or absence of IL-2 (1000 IU/mL) or IL-15 (1-100 ng/mL; R&D Systems, Minneapolis, MN) or 0.1 μg/mL monoclonal anti-CD3 antibody (BD Biosciences PharMingen, San Diego, CA) associated with the presence or not of IL-15 (1 ng/mL) or IL-2 (100 IU/mL) for periods of 15 minutes to 15 days.
Western blotting
To detect IL-15–induced STAT5 phosphorylation, cells were serum-starved for 2 hours at 37°C and then stimulated with IL-2 or IL-15 for 30 minutes at 37°C. After stimulation, cold washing medium (phosphate buffered saline [PBS], NaF 1%, Na3VO4 0.5%, sodium pyrophosphate 10%) was added to terminate stimulation and cells were pelleted and lysed in a buffer containing Nonidet P-40 1%, 50 mM Tris, pH 7.6, 150 mM NaCl, in the presence of the phosphatases inhibitors (25 mM β-glycerophosphate and 1 mM sodium orthovanadate) and protease inhibitors (Complete protease inhibitor cocktail tablets; Roche Diagnostics, Indianapolis, IN). The detergent-insoluble material was removed by centrifugation at 14 000g for 15 minutes at 4°C. Proteins of interest were resolved by sodium dodecyl sulfate–polyacrylamide gel electrophoresis, transferred to nitrocellulose, and immunoblotted with an anti-STAT5a/b (sc-835), antiphosphoSTAT5a/b (sc-11761-R), anti–IL-2Rβ (sc-1046), anti–IL-2Rγ (sc-670), or anti–IL-15Rα (sc-9172) (all antibodies from Santa Cruz Biotechnology, Santa Cruz, CA), or mAb147 (R&D Systems) antibodies. Blots were developed by the enhanced chemiluminescence system (GE Healthcare).
Flow cytometry
PBMCs taken from the flasks at the conclusion of the culture period were stained following an indirect or direct immunofluorescence protocol. Briefly, mononuclear cells were directly labeled with a phycoerythrin (PE)-conjugated anti-CD69 or indirectly labeled with IL-15Rα–specific antibodies (sc-9172 from Santa Cruz Biotechnology, AF247 and mAb147 from R&D Systems, or huIL-15R-M161 and huIL-15R-M162 from Amgen, Thousand Oaks, CA), in PBS containing 1% bovine serum albumin and 0.05% sodium azide (fluorescence-activated cell sorter [FACS] buffer) at 4°C for 30 minutes, and washed 3 times with cold FACS buffer. Cells were then stained with PE-conjugated goat anti–mouse IgG or PE-conjugated goat anti–rabbit IgG.
When double labeling was performed, PBLs were incubated with commercial fluoresceinated conjugated monoclonal antibody (mAb) against CD4 or CD8 (ImmunoTools, Friesoythe, Germany) at 4°C for 30 minutes. The cell pellet was washed twice with cold FACS buffer and finally resuspended in the same solution at a concentration of 106 cells/mL. Background staining of goat anti–mouse IgG-PE, goat anti–rabbit IgG-PE, or an isotype-specific Ab was routinely used as negative control. The expression of each Ag on the cellular samples was quantified on a Becton Dickinson FACScalibur cytometer and analyzed with CellQuest software (BD Biosciences, San Jose, CA). Viable cells were electronically gated on forward- and side-scatter parameters, which are characteristic of activated lymphocytes. Despite their slightly different distribution, the same region of the cell samples activated in the absence or presence of cytokines was chosen to allow comparison.
Analysis of lymphocyte-cell division by CFSE dye dilution
PBLs from healthy volunteers and IM subjects were washed twice in PBS and then labeled with 5,6-carboxyfluorescein diacetate succinimidyl ester (CFSE; Invitrogen) at a concentration of 4 μM per 5 × 10⁶ cells for 10 minutes at 37°C. Free CFSE was quenched by the addition of an equal volume of FBS. After 4 washes in 10% FBS in complete media, cells were cultured with appropriate stimuli for 5 to 15 days at 37°C/5% CO2. Cell division was analyzed in total PBLs. In some experiments, cell proliferation analysis was performed in conjunction with CD4 staining. Cells undergoing division were identified by the decrease in CFSE resulting from dilution of the dye with each division. The medium-alone culture consisted of nonproliferating cells (CFSE bright) with less than 5% CFSE dim (proliferating) cells.
Results
IL-15Rα expression on IM T cells is comparable with the expression on T cells from healthy subjects
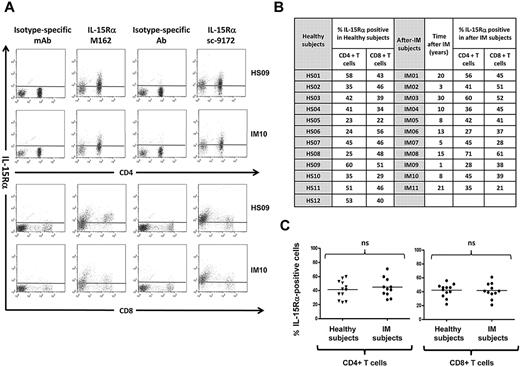
Dot plot analysis of IL-15Rα membrane expression in gated CD8+ and CD4+ T-cell populations derived from IM subjects and healthy subjects was performed using huIL-15R-M162 (Amgen) and sc-9172 (Santa Cruz Biotechnology) IL-15Rα-specific antibodies. T cells derived from IM subjects and healthy subjects display similar IL-15Rα surface expression independently of the antibody used (Figure 1).
T cells from healthy subjects and from IM subjects express the 3 chains of the IL-15 receptor. (A) Expression of IL-15Rα on PBLs. Representative staining profiles for IL-15Rα expression on CD4+ and CD8+ T cells from 1 long-term post-IM subject (IM10) and 1 healthy subject (HS09). Analysis was restricted to the lymphocyte population (ie, excluding monocytes) by gating on cell size and 2 different antibodies (huIL-15R-M162 and sc-9172) were used to validate the staining. These results are representative of those obtained in experiments on 11 post-IM subjects studied between 1 and 20 years after diagnosis, and 12 healthy carriers. (B,C) Summary of IL-15Rα expression on CD4+ T and CD8+ T cells in the post-IM subjects and healthy subjects. (B) Table results are expressed as the percentage of IL-15Rα–positive cells, stained with the anti–IL-15Rα antibody sc-9172, in CD4+ T and CD8+ T populations from 11 post-IM subjects and 12 healthy subjects. (C) Scatterplots of IL-15Rα on CD4+ T cells (left panel) and CD8+ T cells (right panel). Horizontal lines represent the median value for each group. Statistical analysis was performed using the Student t test and shows no significant differences between CD4+ T cells or between CD8+ T populations. NS indicates not significant.
T cells from healthy subjects and from IM subjects express the 3 chains of the IL-15 receptor. (A) Expression of IL-15Rα on PBLs. Representative staining profiles for IL-15Rα expression on CD4+ and CD8+ T cells from 1 long-term post-IM subject (IM10) and 1 healthy subject (HS09). Analysis was restricted to the lymphocyte population (ie, excluding monocytes) by gating on cell size and 2 different antibodies (huIL-15R-M162 and sc-9172) were used to validate the staining. These results are representative of those obtained in experiments on 11 post-IM subjects studied between 1 and 20 years after diagnosis, and 12 healthy carriers. (B,C) Summary of IL-15Rα expression on CD4+ T and CD8+ T cells in the post-IM subjects and healthy subjects. (B) Table results are expressed as the percentage of IL-15Rα–positive cells, stained with the anti–IL-15Rα antibody sc-9172, in CD4+ T and CD8+ T populations from 11 post-IM subjects and 12 healthy subjects. (C) Scatterplots of IL-15Rα on CD4+ T cells (left panel) and CD8+ T cells (right panel). Horizontal lines represent the median value for each group. Statistical analysis was performed using the Student t test and shows no significant differences between CD4+ T cells or between CD8+ T populations. NS indicates not significant.
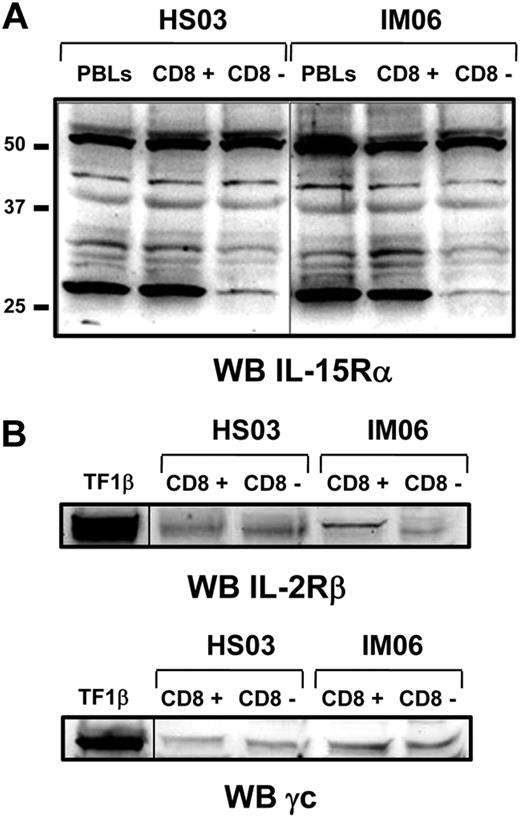
Subsequently, we analyzed by Western blot the panel of IL-15Rα isoforms using the anti–IL-15Rα mAb147 (R&D Systems) in total PBLs population and purified CD8+ and CD8− cell subsets. At least 5 different isoforms of IL-15Rα with molecular weight ranging between 30 and 56 kDa were detected in samples derived from both IM subjects and healthy subjects without qualitative and quantitative differences in the 2 groups (Figure 2A). The 56-kDa band represents the full-length isoform, whereas the other bands display molecular weight compatible with isoforms derived from alternative splicing of exons 2, 3, and/or 7.24,25 In addition, Western blot analyses show that purified CD8+ and CD8− cell subsets from both groups equally express the IL-2/IL-15Rβ and γc chains (Figure 2B).
Expression of IL-15R on purified CD8+ and CD8− T-cell fractions by Western blotting. (A) Expression of IL-15Rα isoforms was analyzed on purified CD8+ and CD8− T-cell fractions from IM06 and HS03 subjects using the mAb147 (R&D Systems). Similar results were obtained with the antibody of sc-9172 (Santa Cruz Biotechnology, data not shown). (B) Expression of IL-2/15Rβ and γc was analyzed on both cell subpopulations. Similar results were obtained from different subjects in each group. A vertical line has been inserted to indicate a repositioned gel lane.
Expression of IL-15R on purified CD8+ and CD8− T-cell fractions by Western blotting. (A) Expression of IL-15Rα isoforms was analyzed on purified CD8+ and CD8− T-cell fractions from IM06 and HS03 subjects using the mAb147 (R&D Systems). Similar results were obtained with the antibody of sc-9172 (Santa Cruz Biotechnology, data not shown). (B) Expression of IL-2/15Rβ and γc was analyzed on both cell subpopulations. Similar results were obtained from different subjects in each group. A vertical line has been inserted to indicate a repositioned gel lane.
IL-15 stimulation induces STAT5 phosphorylation in T cells from remote IM and healthy subjects
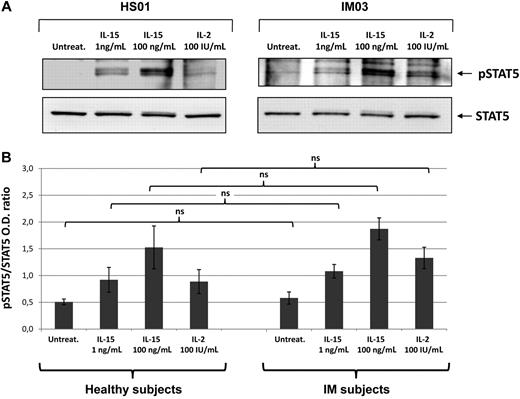
To determine whether IL-15 receptor expressed on T cells from post-IM subjects and healthy subjects, we analyzed by Western blotting the signal transduction induced by IL-15 (1 and 100 ng/mL) and IL-2 (100 IU/mL). There was no detectable STAT5 phosphorylation in untreated culture, whereas 1 ng/mL of IL-15 induced detectable levels of phosphorylation, which were optimal using 100 ng/mL. IL-2 at 100 IU/mL induced a response similar to that observed with lower concentrations of IL-15 (Figure 3).
IL-15- and IL-2-induced STAT5 phosphorylation. (A) T cells from IM03 and HS01 were either untreated (untreat.) or stimulated with recombinant IL-15 (1 or 100 ng/mL) or IL-2 (100 IU/mL) for 30 minutes at 37°C. After stimulation, cells were lysed and phosphorylated STAT5a/b was detected by blotting the lysates with an antibody recognizing the STAT5a/b phosphorylated form (p-STAT5). Equivalent amounts of protein in the lysates were confirmed by blotting with anti-STAT5a/b (STAT5). (B) Means of pSTAT5/STAT5 ratio were obtained from 3 IM subjects (IM03, IM04, IM05) and 3 healthy subjects (HS01, HS02, HS05). Statistical analysis was performed using the Student t test and shows no significant differences between IM subjects and healthy subjects, independently of the stimuli used. NS indicates not significant.
IL-15- and IL-2-induced STAT5 phosphorylation. (A) T cells from IM03 and HS01 were either untreated (untreat.) or stimulated with recombinant IL-15 (1 or 100 ng/mL) or IL-2 (100 IU/mL) for 30 minutes at 37°C. After stimulation, cells were lysed and phosphorylated STAT5a/b was detected by blotting the lysates with an antibody recognizing the STAT5a/b phosphorylated form (p-STAT5). Equivalent amounts of protein in the lysates were confirmed by blotting with anti-STAT5a/b (STAT5). (B) Means of pSTAT5/STAT5 ratio were obtained from 3 IM subjects (IM03, IM04, IM05) and 3 healthy subjects (HS01, HS02, HS05). Statistical analysis was performed using the Student t test and shows no significant differences between IM subjects and healthy subjects, independently of the stimuli used. NS indicates not significant.
IL-15 rescues IM T cells from apoptosis
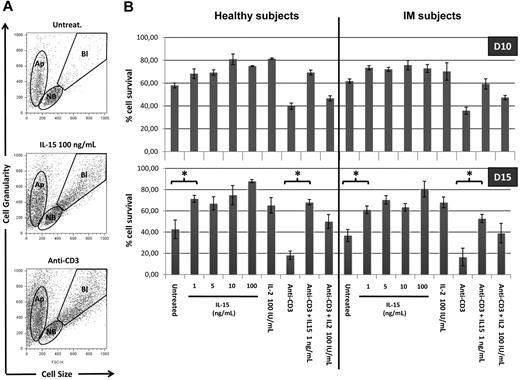
We further defined the responsiveness to IL-15 of T cells from IM subjects and healthy subjects analyzing the long-term survival of total PBLs and T cells induced by IL-15 and IL-2 in the presence or absence of anti-CD3 stimulation. The ability of both cytokines to prevent apoptosis was examined by evaluating by flow cytometry in lymphocyte populations the ratio between the apoptotic cell compartment and living compartment (nonblastic and blastic cells) (Figure 4A). After 10 days in culture, total PBLs in the absence of exogenous cytokines display 60% of viable cells in both groups (Figure 4B). Treatment with IL-15 (1-100 ng/mL) or IL-2 (100 IU/mL) slightly but significantly increases the percentage of living cells (70%-80%). Anti-CD3 triggering decreases the percentage of living T cells to 40%. In this latter situation, IL-15 at 1 ng/mL, but not IL-2, strongly protects CD3-treated T cells from apoptosis increasing the percentage of living cells to approximately 60% to 70% in both groups.
IL-15 rescues PBLs from apoptosis. (A) Altered pool sizes of nonblastic, blastic, and apoptotic cells in lymphocytes populations. PBLs triggered or not with anti-CD3 mAbs were incubated for 10 to 15 days in the absence or presence of increasing concentrations of IL-15 or 100 IU/mL of IL-2. Shown are typical forward-scatter (size) versus side-scatter (granularity) profiles of cells gated on the indicated populations. Apoptotic cells (Ap) are defined by their small size and high granularity. Viable cells in cultures included nonblastic cells (NB) and distinctly larger blastic cells (Bl), the latter being absent in cultures incubated without exogenous cytokines. (B) Bars represent the percentage of nonapoptotic cells, defined by the ratio between Ap pool and NB + Bl pools. Each bar represents mean of 3 different donors (IM06, IM07, and IM01 vs HS03, HS06, and HS11) in the different culture conditions. P values (< .005) between different conditions culture were calculated with Student t test.
IL-15 rescues PBLs from apoptosis. (A) Altered pool sizes of nonblastic, blastic, and apoptotic cells in lymphocytes populations. PBLs triggered or not with anti-CD3 mAbs were incubated for 10 to 15 days in the absence or presence of increasing concentrations of IL-15 or 100 IU/mL of IL-2. Shown are typical forward-scatter (size) versus side-scatter (granularity) profiles of cells gated on the indicated populations. Apoptotic cells (Ap) are defined by their small size and high granularity. Viable cells in cultures included nonblastic cells (NB) and distinctly larger blastic cells (Bl), the latter being absent in cultures incubated without exogenous cytokines. (B) Bars represent the percentage of nonapoptotic cells, defined by the ratio between Ap pool and NB + Bl pools. Each bar represents mean of 3 different donors (IM06, IM07, and IM01 vs HS03, HS06, and HS11) in the different culture conditions. P values (< .005) between different conditions culture were calculated with Student t test.
After 15 days in culture, the percentage of living cells decreases up to 40% and less than 20% in untreated PBLs and CD3-treated T cells, respectively. In post-IM subjects and healthy subjects, the antiapoptotic effect of the different concentrations of IL-15 and IL-2 appears to be highly magnified both in untreated and CD3-treated T cells.
IL-15 induces CD69 expression on T cells from IM subjects and healthy subjects
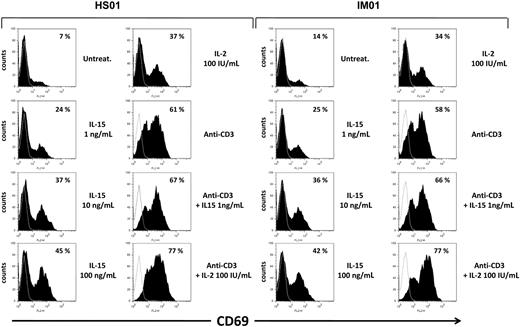
Subsequently, we checked the responsiveness to IL-15 and IL-2 of T cells from IM subjects and healthy subjects, investigating the induction of the activation marker CD69 whose early surface expression has been found to strongly correlate with the degree of proliferative activity.26 PBLs triggered or not with anti-CD3 mAbs were incubated for 3 days in the absence or presence of increasing concentrations of IL-15 or 100 IU/mL of IL-2. Flow cytometry showed that, after 3 days in culture, expression of CD69 was almost undetectable in the untreated gated CD8+ T compartment. Treatment with IL-15 (1-100 ng/mL) triggered the expression of CD69 already at the lowest cytokine concentration (1 ng/mL). Use of the higher concentrations of IL-15 and IL-2 (100 IU/mL) further improved CD69 expression, which reached the highest levels after combined cytokines/anti-CD3 stimulations. Similar results were obtained in CD8+ T cells from IM and healthy subjects (Figure 5). In addition, an increase in CD69 expression induced by IL-15 and IL-2 was also observed on gated CD4+ T cells, even if to a lesser extent (data not shown).
Induction of the CD69 surface expression by IL-15 in CD8+ gated T cells from IM subjects. PBLs triggered or not with anti-CD3 mAbs were incubated for 3 days in the absence or presence of increasing concentrations of IL-15 or 100 IU/mL of IL-2, and then double-stained for CD69 and CD8 and analyzed by flow cytometry, as described in “Flow cytometry.” Percentage of CD69+ cells in CD8+ gated T cells is indicated for each cell treatment. Data are representative of 4 identical experiments.
Induction of the CD69 surface expression by IL-15 in CD8+ gated T cells from IM subjects. PBLs triggered or not with anti-CD3 mAbs were incubated for 3 days in the absence or presence of increasing concentrations of IL-15 or 100 IU/mL of IL-2, and then double-stained for CD69 and CD8 and analyzed by flow cytometry, as described in “Flow cytometry.” Percentage of CD69+ cells in CD8+ gated T cells is indicated for each cell treatment. Data are representative of 4 identical experiments.
IL-15– and IL-2–induced IM-derived CD8+ T-cell proliferation
Finally, we studied the in vitro proliferative response to IL-15 and IL-2 on CD4+ and CD4− T-cell compartments from long-term post-IM subjects and healthy subjects. PBLs proliferative potential was checked with CFSE labeling: Cells undergoing division were identified by the decrease in CFSE staining, resulting from dilution of the dye with each division.
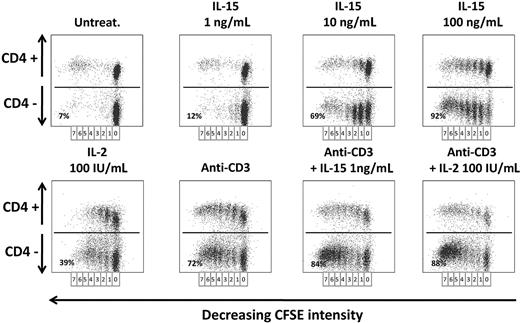
In remote IM subjects (Figure 6), there was no T-cell proliferation in 6-day-old untreated culture, whereas IL-15 was already efficient in inducing an initial T-cell division already at the lowest concentration of 1 ng/mL but only in a small subset of CD4− T cells (12%). In addition, IL-15 at this concentration displayed a powerful synergistic effect on anti-CD3–stimulated cells (84%). Use of higher IL-15 concentrations and IL-2 (100 IU/mL) recruited in the cell cycle a prominent fraction of CD4− T cells that performed up to 7 cell divisions (69% at 10 ng/mL and 92% at 100 ng/mL of IL-15, 39% for IL-2). Similar results were observed in the CD4+ T-cell fraction, but to a lesser extent. T cells from healthy subjects behaved as T cells from remote IM subjects (data not shown).
Proliferation of PBLs from IM subjects in response to IL-2 or IL-15. CFSE-labeled PBLs prepared from one IM subject (IM02) were cultivated for 6 days with or without anti-CD3 mAbs in the absence or presence of various concentrations of IL-15 (1-100 ng/mL) or IL-2 (100 IU/mL). The percentage of proliferating cells was analyzed by flow cytometry measurements of the dilution of CFSE on day 6 in CD4+ or CD4− T-cell fractions after staining with an anti–CD4-PE mAb. Seven successive generations of lymphocytes were observed, and the indicated percentages represent the proliferating cells in the CD4− cell fraction for each cell treatment. Data are representative of 4 identical experiments. Similar results were obtained with T cells from healthy subjects (data not shown).
Proliferation of PBLs from IM subjects in response to IL-2 or IL-15. CFSE-labeled PBLs prepared from one IM subject (IM02) were cultivated for 6 days with or without anti-CD3 mAbs in the absence or presence of various concentrations of IL-15 (1-100 ng/mL) or IL-2 (100 IU/mL). The percentage of proliferating cells was analyzed by flow cytometry measurements of the dilution of CFSE on day 6 in CD4+ or CD4− T-cell fractions after staining with an anti–CD4-PE mAb. Seven successive generations of lymphocytes were observed, and the indicated percentages represent the proliferating cells in the CD4− cell fraction for each cell treatment. Data are representative of 4 identical experiments. Similar results were obtained with T cells from healthy subjects (data not shown).
Discussion
It has been recently reported that IM was associated with down-regulation of IL-15Rα on T cells and NK cells, which appeared to be permanent and to a defective IL-15 responsiveness that lasts for many years after the disease episode.17 These data were interesting both for a better understanding of the long-term immune response in IM subjects and for the development of a human “KO model” of IL-15Rα expression in a restricted lymphoid compartment. We therefore reassessed the expression of the IL-15Rα chain and IL-15 responsiveness on freshly isolated blood samples and on frozen PBMCs obtained from certified IM subjects long after recovery from acute IM and from healthy subjects and did not confirm the previously reported results. We first analyzed the expression of IL-15Rα using 4 different mAbs recognizing different epitopes on the IL-15Rα molecule by flow cytometry and by Western blot. We did not observe any quantitative (flow cytometry) or qualitative (Western blot) differences in the expression of the IL-15Rα subunit on different T-cell subsets derived from healthy subjects or from IM subjects. Indeed, Western blot analysis revealed that T cells from both groups expressed the same panel of isoforms for the IL-15Rα chain, which were detected at the T-cell surface with similar mean fluorescence intensity.
In addition, T cells of both groups of subjects display a similar responsiveness to low concentrations of recombinant IL-15 (1 ng/mL) concerning signal transduction, induction of long-term survival proliferative response, and induction of the CD69 early activation marker. T cells from healthy subjects and from IM subjects were challenged with increasing concentrations of recombinant IL-15 ranging between 1 and 100 ng/mL. Induction of STAT5 phosphorylation was observed in both groups already at the minimal IL-15 concentration that in addition guaranteed long-term survival, triggering of proliferation, and early induction of the activation marker CD69 in T cells stimulated or not with anti-CD3 mAb. In addition, T cells from both groups of subjects were also highly sensitive to IL-2, showing that the IL-2/15R βγc complex is not affected and functional.
On the other hand, permanent loss of IL-15Rα chain in the T/NK compartment would require a specific targeting and infection by EBV of the T/NK progenitor during the acute phase. This is theoretically possible,27-29 but, to the best of our knowledge, no mechanism has been ever reported by which EBV infection may permanently hinder IL-15Rα expression.
The discordance between our results and those previously published concerning IL-15Rα expression and IL-15 responsiveness of the T-cell compartment in IM subjects17 cannot be easily explained; nevertheless, 2 major technical issues differentiate the 2 works. We essentially analyzed fresh blood samples and recently frozen PBMCs of remote IM subjects, whereas the paper of Sauce et al17 is based on the use of frozen cell samples, many of which had been stored for decades. Thus, it is possible that, depending on the quality of recovery from long-term frozen samples, a more or less important cell loss and/or an unbalanced selection of T-cell subsets may cause the expansion of cells bearing unusual defects. In addition, the anti–IL-15Rα antibody (mAb147, clone 151307 from R&D Systems) used by Sauce et al17 is not recommended, according to the manufacturer's instructions for flow cytometry but for Western blot and enzyme-linked immunosorbent assay. On the other hand, this mAb, when used for Western blot analysis, equally recognizes several IL-15Rα isoforms in T cells from both healthy and IM subjects. Therefore, these technical differences could account, at least in part, for the divergent results.
The group of IM subjects that we analyzed had undergone the disease from periods ranging between 12 months and 20 years, but we have not analyzed subjects in the acute phase and we cannot exclude that a transient loss of the IL-15Rα chain may occur during this period. This should be further studied, but we propose that this phenomenon cannot uniquely be mediated by yet undetermined cytokines17 and that additional mechanisms should be involved in the down-regulation of the IL-15Rα chain. For instance, the loss of the IL-15Rα subunit could be the result of its shedding under soluble form induced by matrix metalloproteinases as recently described in inflammatory and neoplastic syndromes.3,30 If this hypothesis holds true, secretion of the IL-15Rα chain during the acute phase of IM could lead to the formation of the soluble complex sIL-15Rα/IL-15, which has the potential to boost the activation of naive CD8+ T cells and their development into effector cells and long-term memory T cells,31,32 favoring the disease resolution. Thus, the detection of the soluble receptor and/or of the soluble complex could represent additional serologic markers for the follow-up of the infectious disease.
In conclusion, our results show that, different from what was previously reported,17 IM subjects do not display long-term global deficit in the responsiveness of the T-cell compartment to IL-15 linked to a permanent loss of the IL-15Rα expression by these cells. These data are relevant because they shed a new light on the long-term evolution and efficiency of the T-cell response in IM subjects.
The publication costs of this article were defrayed in part by page charge payment. Therefore, and solely to indicate this fact, this article is hereby marked “advertisement” in accordance with 18 USC section 1734.
Acknowledgments
The huIL-15R-M161 and huIL-15R-M162 antibodies are generous gifts from Amgen (Thousand Oaks, CA; agreement number 200402180).
This work was supported by grants from Agence Française de Biomedicine (Paris, France), Association pour la Recherche sur le Cancer (ARC, Villejuif, France; no. 3143), NRB-Vaincre le Cancer (Villejuif, France), Associazione Italiana per la Ricerca sul Cancro (Rome, Italy), and Italian Ministry of Health (Milan, Italy). S.N. was the recipient of a fellowship from ARC.
Authorship
Contribution: J.G.-M. and F.M. performed research, analyzed data, and wrote the paper; S.N. and A.D. performed research and analyzed data; and B.A. and C.B. designed research, analyzed data, and wrote the paper.
Conflict-of-interest disclosure: The authors declare no competing financial interests.
Correspondence: Bruno Azzarone, Inserm UMR 542, Bâtiment Lavoisier Hôpital Paul Brousse, 14 Avenue Paul Vaillant Couturier 94807 Cedex Villejuif, France; e-mail: bazzarone@hotmail.com; and Caroline Besson, Service d'Hématologie et Immunologie Biologiques, Cytogénétique F-94270, Hôpital Bicêtre, Assistance Publique-Hôpitaux de Paris, Le Kremlin-Bicêtre, France; e-mail: caroline.besson@bct.aphp.fr.
References
Author notes
*J.G.-M., F.M., B.A., and C.B. contributed equally to this paper.

This feature is available to Subscribers Only
Sign In or Create an Account Close Modal