

Abstract
Clonality assays, based on X-chromosome inactivation, discriminate active from inactive alleles. Skewing of X-chromosome allelic usage, based on preferential methylation of one of the HUMARA alleles, was reported as evidence of clonal hematopoiesis in approximately 30% of elderly women. Using a quantitative, transcriptionally based clonality assay, we reported X-chromosome–transcribed allelic ratio in blood cells of healthy women consistent with random X-inactivation of 8 embryonic hematopoietic stem cells. Furthermore, we did not detect clonal hematopoiesis in more than 200 healthy nonelderly women. In view of the susceptibility of aging hematopoietic stem cells to epigenetic dysregulation, we reinvestigated the issue of clonality in elderly women. Forty healthy women (ages 65-92 years; mean, 81.3 years) were tested by a novel, quantitative polymerase chain reaction (qPCR) transcriptional clonality assay. We did not detect clonal hematopoiesis in any of the tested subjects. We also tested DNA from the same granulocyte samples using the methylation-based HUMARA assay, and confirmed previous reports of approximately 30% extensively skewed or monoallelic methylation, in agreement with likely age-related deregulated methylation of the HUMARA gene locus. We conclude that the transcriptionally based X-chromosome clonality assays are suitable for evaluation of clonal hematopoiesis in elderly women.
Introduction
Clonality studies can establish the single-cell origin of tumors and thus differentiate clonal malignant and premalignant processes from reactive polyclonal processes. Detection of clonal cells may be based on direct tracking of cell lineage–specific sequences or disease-specific somatic mutations identifying the clonal population. Examples include immunoglobin gene rearrangement in B cells or the 9q+;22q− translocation in chronic myelogenous leukemia. Alternatively, clonal populations can be detected through indirect measures such as the expression of surrogate genes as in the case of X-chromosome inactivation
Indirect methods rely on the principle of X-chromosome inactivation, which is unique in mammals. Most genes in diploid organisms are expressed from both alleles. However, a subset may be transcribed preferentially from a single allele. Sex chromosome gene dosage equivalence between XY males and XX women was the first described example of an epigenetic process and monoallelic expression.1 X-chromosome inactivation is a process by which one of the 2 X chromosomes (or more accurately, most of the genes on that X chromosome) in each cell is inactivated during early female embryonic development. The subsequent progeny of each cell maintains the same inactivated X-chromosome pattern resulting in a normal female that is a mosaic of cells; all the coexisting cells will have either a paternally or maternally derived active X chromosome. Consequently, establishing clonality requires identification of X-chromosome polymorphisms. Detection of human polymorphic X-chromosome genes, subjected to inactivation, was first described by Beutler et al,1 and was based on electrophoretic distinction of G6PD isoenzyme products in African women. The application of G6PD isoenzyme expression for detection of clonality was first reported in myomas by Linder and Gartler,2 and then for malignant tumors by Beutler et al.3 Vogelstein et al4 later proposed detection of clonality by discrimination of the methylation state of DNA (Figure 1), extending its applicability to most women regardless of their ethnic origin. Subsequently, other approaches to identification of the active X chromosome were developed based on detecting transcribed alleles bearing synonymous, or noncoding, single nucleotide polymorphisms (Figure 1), that is, transcriptional clonality assays.5,6

Schematic diagram of X-chromosome clonality determination used here and in HUMARA assay. X-chromosome inactivation occurs early during embryogenesis. Hence, women are a mosaic of paternal or maternal active X chromosome (Step 1). Inactive X chromosome is represented by filled red circles. For the transcriptional clonality assay, a specific exonic polymorphism is selected and genotyped (Step 2a). Allele-specific expression is determined by real-time PCR using reverse-transcribed mRNA as described in “Novel transcriptional clonality assay” (Steps 3a and 4a). Resulting amplification curve is used to estimate the ΔCt and corresponding frequencies of each allele (Step 5a). In contrast, analysis at the HUMARA locus, shown methylated in the promoter region by filled red circles (Step 2b), is initiated by restriction digestion (scissors) of genomic DNA using a methylation-sensitive endonuclease (Step 3b). After restriction digestion, PCR amplification with primers flanking both the 5′ restriction digestion site and the 3′ end of the CAG tandem repeat sequence is performed (Step 4b). Hence, only intact, methylated, inactive X-chromosome DNA is amplified. Allele-specific PCR products can be distinguished from each other based on the number of tandem CAG repeats using agarose gel electrophoresis (Step 5b).
Schematic diagram of X-chromosome clonality determination used here and in HUMARA assay. X-chromosome inactivation occurs early during embryogenesis. Hence, women are a mosaic of paternal or maternal active X chromosome (Step 1). Inactive X chromosome is represented by filled red circles. For the transcriptional clonality assay, a specific exonic polymorphism is selected and genotyped (Step 2a). Allele-specific expression is determined by real-time PCR using reverse-transcribed mRNA as described in “Novel transcriptional clonality assay” (Steps 3a and 4a). Resulting amplification curve is used to estimate the ΔCt and corresponding frequencies of each allele (Step 5a). In contrast, analysis at the HUMARA locus, shown methylated in the promoter region by filled red circles (Step 2b), is initiated by restriction digestion (scissors) of genomic DNA using a methylation-sensitive endonuclease (Step 3b). After restriction digestion, PCR amplification with primers flanking both the 5′ restriction digestion site and the 3′ end of the CAG tandem repeat sequence is performed (Step 4b). Hence, only intact, methylated, inactive X-chromosome DNA is amplified. Allele-specific PCR products can be distinguished from each other based on the number of tandem CAG repeats using agarose gel electrophoresis (Step 5b).
The Lyon-Beutler hypothesis of random X-chromosome inactivation provided the basis for assessing hierarchy and clonality of hematopoiesis.1,7-9 According to this hypothesis, the ratio of cells with inactive maternal to paternal X chromosome should follow a Poisson distribution with a mean around 0.5. The caveat, however, is that the number of pluripotent stem cells present at the time of inactivation is small.10-12 Hence, based on statistical probability, a skewed ratio between cells with either inactive maternal or paternal X chromosome will be noted in some women. Skewed X-inactivation patterns may occur as a result of a primary stochastic process, or because of secondary cell selection in women heterozygous for certain X-linked genetic diseases.13,14 Examples of imbalanced gene expression include random monoallelic (occurring on either autosome or sex chromosome, first foreseen in 1963,15 and recently found to be more widespread than previously thought16 ) and imprinting reviewed in Nussenzveig and Prchal.17 In mice, genetically determined imbalance of X-chromosome gene expression based on differences of the X-chromosome inactivation locus Xci18 has been demonstrated; however, a recent study in humans found this phenomenon to be infrequent since it was not detected in more than 500 healthy female mother-neonate pairs.19
Extreme skewing of X-chromosome allelic usage by methylation-based clonality assay has been reported in approximately 30% of healthy elderly women,20-23 and has been attributed to the development of clonality and oligoclonality as a consequence of hematopoietic stem cell senescence. Thus, it was recommended that the X-chromosome–based clonality assays preclude their use in elderly women.20-23 In contrast, using a quantitative transcriptionally based clonality assay, we have previously established that significant skewing of the ratios of X-chromosome–transcribed alleles is a common occurrence in healthy women based on our studies demonstrating that 8 progenitors of pluripotent hematopoietic stem cells are present at the time of random X-chromosome inactivation in the female embryo.10 The conclusion that 8 progenitors of pluripotent hematopoietic stem cells are present at the time of embryonic random X-chromosome inactivation was corroborated by others using a different approach.11,12 The probability that 7 of 8 progenitors of pluripotent hematopoietic stem cells would inactivate the same X chromosome during embryonic development, resulting in a skewed allelic ratio of 7:1 and pseudoclonality, is .0078.10 Based on this observation and those of others,11,12 extreme skewing of X-chromosome allelic usage (allele frequency greater than 80%) is regarded as indicator of clonality. Although we previously reported preferential allelic usage of one of the X chromosomes (selection) in women heterozygous for certain X-linked diseases,13,14 we have not observed clonal X-chromosome allelic expression in studies involving more than 200 healthy women, indicating this is a rare phenomenon in the general population.10 However, we did not study women older than 65 years.20-23 To address this issue, we developed a novel quantitative reverse-transcription allele-specific suppressive PCR (qRT-ASS-PCR), which is based on a unique primer design,24 to reinvestigate clonality in elderly women. We report here the absence of clonal or oligoclonal hematopoiesis in a group of 37 informative healthy elderly women between the ages of 65 and 92 years.
Methods
Study subjects
This study included 4 groups of prospectively recruited subjects: (1) healthy elderly women (> 65 years of age)—these subjects did not have any active medical problems and were carefully screened for a history of anemia, autoimmune diseases, and malignant disorders; (2) younger healthy women (< 40 years of age)—age control group for the elderly subjects; (3) women with clonal myeloproliferative disorders—these subjects had well-characterized myeloproliferative disorders as per World Health Organization criteria25 and included polycythemia vera, essential thrombocytosis, and primary myelofibrosis; these served as positive (disease) control for our novel clonality assay; and (4) women with nonclonal blood disorders (including secondary thrombocytosis and leukocytosis); these subjects were used as negative controls for our novel clonality assay. After informed consent was obtained in accordance with the Declaration of Helsinki, 5 mL peripheral blood was collected by venipuncture. Granulocyte, platelet, and mononuclear cell fractions were isolated by Histopaque (1.077 g/mL) density gradient based on published protocols.9 This study received institutional review board approval from the University of Utah.
Genomic DNA extraction and genotyping of single nucleotide exonic polymorphisms
Genomic DNA (gDNA) was isolated from granulocytes using the Puregene DNA purification kit (Gentra, Minneapolis, MN). Genotyping of single nucleotide exonic polymorphisms from 5 X-chromosome genes (BTK: C/T, dbSNP: 1135363; FHL1: G/A, dbSNP: 9018; IDS: C/T, dbSNP: 1141608; G6PD: C/T, dbSNP: 2230037; MPP1: G/T, dbSNP: 1126762)26 was determined using TaqMan allele-discrimination assays on an Applied Biosystems 7500 Sequence Detection System (Applied Biosystems, Foster City, CA). Briefly, reactions (15 μL) consisted of 1 to 20 ng purified gDNA and 0.75 μL TaqMan SNP Genotyping Assay mix (Applied Biosystems); all other conditions were as described by the manufacturer.
Novel transcriptional clonality assay
Total RNA was isolated from platelets, granulocytes, and T cells using Tri-Reagent (Molecular Research Center, Cincinnati, OH), and used for assessment of clonality. Total RNA (50 ng) was reverse transcribed using SuperScript III First-Strand Synthesis SuperMix for qRT-PCR (Invitrogen, Carlsbad, CA). Quantitative allele-specific suppressive PCR was performed on a sequence detection system 7500 platform (Applied Biosystems), using a modification of previously described method.24 Typical reactions (15 μL) consisted of 1× TaqMan Universal PCR master mix (Applied Biosystem); 300 nM allele-specific and universal gene–specific primers (Table S1, available on the Blood website; see the Supplemental Materials link at the top of the online article); 125 nM FAM-labeled gene-specific MGBNFQ probe (Applied Biosystems); (Table S1); and first-strand cDNA. Allele-specific primers were designed using the software program Oligo 6.7 (Molecular Biology Insights, Cascade, CO).
Phenotypic determination of HCI ratios by HUMARA methylation assay
HUMARA assays were performed as previously described.19 Briefly, DNA after digestion with RsaI and HpaII (digested samples) or without RsaI and HpaII (undigested samples) was amplified using 2 primers (Table S1) flanking the STR in the HUMARA gene. One primer was labeled at the 5′ end with fluorescein. The PCR products were analyzed and quantified using an ABI PRISM 3130 Automatic Genetic Analyzer (Applied Biosystems).
Active/inactive X-chromosome allele frequency calculations
Allele frequency of expressed exonic SNPs was calculated as described by Nussenzveig et al.24 Briefly, the difference in cycle threshold (ΔCt) between the 2 allele-specific PCR reactions is a measure of the proportion or frequency of the expressed allele assuming an initial replication efficiency of 100%. If the amplification efficiencies of the 2 allele-specific reactions differ slightly, this can be corrected by measuring the ΔCt on a DNA sample known to be heterozygous for the mutation of interest. The ΔCt in the heterozygous sample should be 0; any deviation from zero can be subtracted from all ΔCt measurements to compensate for differing amplification efficiencies and is represented by HC (heterozygote correction factor). Therefore, HCΔCt represents the heterozygote corrected difference in cycle threshold between the 2 allele-specific PCR reactions, and is computed as described in Equations 1 to 3. Equation 1: ΔCt = Ct-allele1 − Ct-allele2. Equation 2: HCΔCt = ΔCt − (HC Ct-allele1 − HC Ct-allele2). Results obtained in Equations 1 and 2 are used to find the frequency of allele1 in Equation 3: frequency allele1 = 1/(EHCΔCt + 1), where E represents the efficiency of PCR amplification for allele1 and can be deduced by the slope of serially diluted sample.
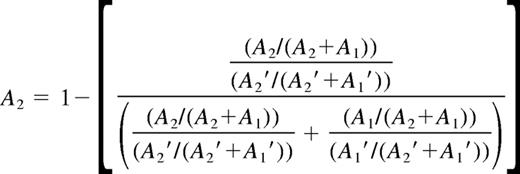
The ratio of the active/inactive X chromosome assessed by HUMARA assay was determined as described by Bolduc et al.19 Briefly, the direction of methylation skewing was determined based on the resulting frequency of allele A2 (harbors the greatest number of CAG repeats). In view of preferential amplification of the smaller allele (A1) during PCR, the fraction of HpaII-digested (A1 and A2) alleles was corrected by the fraction of undigested (A1′ and A2′) alleles. These calculations are presented in Equation 4:
Statistical analysis1
The data for the analysis were arranged by pairing of the most predominant allele between markers within a cell lineage (individuals informative for more than one marker), and by pairing of the most predominant allele of identical markers and between cell lineages. All statistics were generated using SAS software, version 9.1 of the SAS system for Windows (SAS Institute, Cary, NC).
Results
Demographics and genotyping of X-chromosome exonic single nucleotide polymorphisms in our cohort of healthy women
Genomic DNA was isolated from the peripheral blood granulocytes of 45 healthy women. Forty of these women were elderly (age in years: range, 65-92; mean, 81.3; median, 82; coded as GC; Table 1) and 5 were young women (age in years: range, 30-40; mean, 33.4; median, 33; coded as YC; Table 1). All 45 women were genotyped to determine zygosity of the 5 X-chromosome exonic polymorphisms (Table 1). Forty-two women were informative for 1 or more tested markers (Table 1). Three women (GC18, GC23, and GC36) were homozygous (noninformative) for all tested X-chromosome polymorphic genes (Table 1). The overall heterozygosity of the polymorphic X-chromosome genes was determined to be 46%, 46%, 19%, 30%, and 5%, for FHL1, IDS, MPP1, BTK, and G6PD, respectively; these data are in agreement with previously reported studies using large ethnically diverse populations.10,26-31
Age and genotypes of X-chromosome exonic single nucleotide polymorphisms from our cohort of 45 healthy women (40 elderly and 5 young)
| Volunteer subjects | Age, y | Exonic X-chromosome genetic polymorphisms tested | ||||
|---|---|---|---|---|---|---|
| MPP1 | FHL1 | IDS | G6PD | BTK | ||
| GC1 | 82 | G/T | G/G | C/C | T/T | C/C |
| GC2 | 83 | G/G | G/A | C/C | C/C | T/T |
| GC3 | 89 | T/T | G/A | C/C | C/C | C/C |
| GC4 | 93 | G/G | G/A | T/T | C/C | C/T |
| GC5 | 66 | G/G | G/A | C/T | C/C | C/C |
| GC6 | 67 | G/G | G/G | C/T | C/C | C/C |
| GC7 | 65 | G/G | G/G | C/T | C/C | C/C |
| GC8 | 69 | T/T | G/A | C/C | T/T | C/T |
| GC9 | 76 | G/G | G/A | T/T | C/C | C/C |
| GC10 | 82 | G/T | A/A | T/T | C/C | T/T |
| GC11 | 68 | G/G | G/G | C/T | C/C | C/T |
| GC12 | 75 | G/T | A/A | C/T | C/C | C/C |
| GC13 | 73 | G/G | G/A | C/T | C/C | C/C |
| GC14 | 77 | G/T | G/A | C/T | C/C | T/T |
| GC15 | 85 | T/T | G/A | C/T | C/C | C/C |
| GC16 | 78 | G/T | G/A | C/C | C/C | C/T |
| GC17 | 88 | T/T | A/A | C/C | C/C | C/T |
| GC18 | 88 | G/G | G/G | C/C | C/C | C/C |
| GC19 | 91 | T/T | G/A | C/C | T/T | T/T |
| GC20 | 77 | G/G | A/A | C/T | C/C | C/T |
| GC21 | 82 | G/G | G/G | C/T | C/C | C/C |
| GC22 | 90 | T/T | G/A | C/C | C/C | C/T |
| GC23 | 77 | G/G | G/G | T/T | C/C | C/C |
| GC24 | 86 | T/T | G/A | C/C | C/C | C/C |
| GC25 | 85 | G/G | G/A | C/C | C/C | C/T |
| GC26 | 91 | G/G | G/G | T/T | C/C | C/T |
| GC27 | 84 | T/T | G/G | C/T | C/C | C/C |
| GC28 | 77 | G/G | G/A | C/C | C/C | T/T |
| GC29 | 87 | T/T | A/A | C/T | C/C | C/C |
| GC30 | 87 | T/T | G/A | C/C | C/C | C/T |
| GC31 | 76 | G/G | G/A | C/T | C/C | C/C |
| GC32 | 91 | G/G | G/A | C/C | C/C | C/C |
| GC33 | 79 | T/T | G/G | C/T | C/C | C/C |
| GC34 | 92 | T/T | A/A | C/T | C/C | C/T |
| GC35 | 92 | T/T | G/A | C/T | C/C | C/C |
| GC36 | 68 | G/G | G/G | C/C | C/C | C/C |
| GC37 | 74 | G/T | G/G | C/T | C/T | T/T |
| GC38 | 89 | G/T | G/G | C/C | C/T | C/C |
| GC39 | 92 | G/G | G/G | C/C | C/T | C/C |
| GC40 | 92 | G/T | G/A | C/T | C/C | C/C |
| YC1 | 40 | G/T | G/G | C/T | T/T | T/T |
| YC2 | 32 | G/G | G/A | C/T | C/C | C/T |
| YC3 | 33 | T/T | G/G | C/T | C/C | C/C |
| YC4 | 37 | G/T | G/G | C/C | C/C | C/C |
| YC5 | 25 | T/T | G/A | C/T | C/C | C/C |
GC indicates healthy women 65 years or older; and YC, healthy control women 40 years or younger. Italics indicate heterozygous informative subjects.
Determination of allele-specific primer specificity and sensitivity
The difference in ΔCt between the 2 allele-specific PCR reactions is used to estimate allele frequency, assuming initial amplification efficiency is 100%. The mathematic formulas used to calculate allele frequencies have been reported elsewhere.24,32 In these calculations, the initial 2-fold/cycle is used as a value of 100% amplification efficiency. Therefore, it can be inferred that the ΔCt between allele-specific reactions reflects fold difference in allele frequencies. Because initial PCR amplification proceeds at a 2-fold geometric rate, then the fold difference between allele frequencies can be estimated by calculating 2ΔCt. To determine the specificity and quantitative sensitivity of the allele-specific primers, total RNA from platelets of homozygous women was isolated with the intention of ascertaining the ΔCt values for the 2 possible genotypes known for each one of the markers. The discrimination of the X-chromosome allelic usage ratio exceeded ΔCt greater than 13 cycles (Table S2) for all X-chromosome polymorphisms used.
Allelic expression ratios of the 5 X-chromosome exonic SNPs in elderly women
Clonality assay for informative markers was performed using RNA from freshly isolated platelets and granulocytes. Based on published data using the HUMARA assay in elderly women, we expected to find 12 of 40 elderly women to have skewed allelic usage. Neither clonal X-chromosome monoallelic expression nor extreme skewing was noted in any of the study subjects (Table 2). Moreover, in all of the individuals examined, the X-chromosome allelic expression ratio of the 5 markers tested was less than 75% of the predominant allele, well within the limits of variation that were established in previous studies (Table 2).10-12 Spearman correlation coefficients were calculated to assess the linear relationship between 2 markers in platelets or granulocytes, or for the same marker between platelet and granulocyte lineages. Statistically significant correlations were observed, with P value less than .001, for analysis of 2 different markers and a single hematopoietic lineage (Figure 2A,B), as well as for analysis of a single marker on 2 different hematopoietic lineages (Figure 2C). Moreover, general linear models were calculated to test the effects of lineage, marker, and age on allele frequency. Models assessing interaction effects were also computed. Follow-up analysis was performed considering a categoric divide in age between those younger than 40 years and those 65 years or older. Results of these models comparing our elderly and young cohorts of healthy women are presented in Table 3.
X-chromosome exonic polymorphism genotypes and their transcribed allelic frequencies in informative healthy women from platelets and granulocytes
| Samples | Genotyped X-chromosome polymorphisms determined to be heterozygous | Allelic frequencies of expressed exonic polymorphisms in platelets | Allelic frequencies of expressed exonic polymorphisms granulocytes | HUMARA assay | |||||||||||||
|---|---|---|---|---|---|---|---|---|---|---|---|---|---|---|---|---|---|
| MPP1 | FHL1 | IDS | G6PD | BTK | MPP1 G/T | FHL1 G/A | IDS C/T | G6PD C/T | BTK C/T | MPP1 G/T | FHL1 G/A | IDS C/T | G6PD C/T | BTK C/T | Genotype | Allele ratios | |
| GC1 | + | 54/46 | 58/42 | 252/278 | 9/91 | ||||||||||||
| GC2 | + | 61/39 | 60/40 | - | - | ||||||||||||
| GC3 | + | 63/37 | 63/37 | 264/264 | - | ||||||||||||
| GC4 | + | + | 56/44 | 58/42 | 53/47 | 55/45 | - | - | |||||||||
| GC5 | + | + | 53/47 | 53/47 | 61/39 | 60/40 | 278/289 | 57/43 | |||||||||
| GC6 | + | 40/60 | 41/59 | - | - | ||||||||||||
| GC7 | + | 63/37 | 60/40 | 270/281 | 6/94 | ||||||||||||
| GC8 | + | + | 34/66 | 67/33 | 36/64 | 68/32 | 260/272 | 68/32 | |||||||||
| GC9 | + | 61/39 | 66/34 | 272/278 | 70/30 | ||||||||||||
| GC10 | + | 74/26 | 73/27 | 275/289 | 55/45 | ||||||||||||
| GC11 | + | + | 34/66 | 32/68 | 36/64 | 30/70 | 267/281 | 86/14 | |||||||||
| GC12 | + | + | 65/35 | 35/65 | 59/41 | 39/61 | 267/278 | 92/8 | |||||||||
| GC13 | + | + | 42/58 | 41/59 | 44/56 | 48/52 | 270/275 | 33/67 | |||||||||
| GC14 | + | + | + | 59/41 | 43/57 | 52/48 | 53/47 | 41/59 | 52/48 | 264/270 | 68/32 | ||||||
| GC15 | + | + | 43/57 | 54/46 | 42/58 | 52/48 | - | - | |||||||||
| GC16 | + | + | + | 73/27 | 30/70 | 31/69 | 72/28 | 35/65 | 30/70 | - | - | ||||||
| GC17 | + | 53/47 | 54/46 | 267/272 | 69/31 | ||||||||||||
| GC18 | 267/278 | 94/6 | |||||||||||||||
| GC19 | + | 27/73 | 30/70 | 258/264 | 9/91 | ||||||||||||
| GC20 | + | + | 70/30 | 32/68 | 68/32 | 34/66 | 272/289 | 77/23 | |||||||||
| GC21 | + | 48/52 | 46/54 | 267/275 | 91/9 | ||||||||||||
| GC22 | + | + | 30/70 | 31/69 | 40/60 | 33/67 | 272/281 | 7/93 | |||||||||
| GC23 | 289/298 | 69/31 | |||||||||||||||
| GC24 | + | 65/35 | 66/34 | 267/281 | 55/45 | ||||||||||||
| GC25 | + | + | 65/35 | 55/45 | 57/43 | 54/46 | 270/272 | 36/64 | |||||||||
| GC26 | + | 70/30 | 68/32 | 270/270 | - | ||||||||||||
| GC27 | + | 30/70 | 37/63 | 267/270 | 47/53 | ||||||||||||
| GC28 | + | 75/25 | 73/27 | 272/275 | I | ||||||||||||
| GC29 | + | 61/39 | 65/35 | 275/284 | 60/40 | ||||||||||||
| GC30 | + | + | 41/59 | 57/43 | 46/54 | 58/42 | 275/281 | 47/53 | |||||||||
| GC31 | + | + | 71/29 | 68/32 | 68/32 | 72/28 | 272/272 | - | |||||||||
| GC32 | + | 56/44 | 63/37 | 278/284 | 20/80 | ||||||||||||
| GC33 | + | 60/40 | 64/36 | 275/281 | 40/60 | ||||||||||||
| GC34 | + | + | 56/44 | 62/38 | 60/40 | 64/36 | 275/284 | 90/10 | |||||||||
| GC35 | + | + | 57/43 | 54/46 | 50/50 | 58/42 | 267/278 | 73/27 | |||||||||
| GC37 | + | + | + | 23/77 | 36/64 | 61/39 | 28/72 | 38/62 | 58/42 | ND | |||||||
| GC38 | + | + | 48/52 | 26/74 | 51/49 | 30/70 | ND | ||||||||||
| GC39 | + | 60/40 | 58/42 | ND | |||||||||||||
| GC40 | + | + | + | 64/36 | 30/70 | 65/35 | 66/34 | 25/75 | 70/30 | ND | |||||||
| YC1 | + | + | 40/60 | 43/57 | 43/57 | 44/56 | ND | ||||||||||
| YC2 | + | + | + | 63/37 | 35/65 | 38/62 | 64/36 | 34/66 | 37/63 | ND | |||||||
| YC3 | + | 43/57 | 45/55 | ND | |||||||||||||
| YC4 | + | 39/61 | 41/59 | ND | |||||||||||||
| YC5 | + | + | 45/55 | 51/49 | 47/53 | 53/47 | ND | ||||||||||
Thirty-seven of 40 elderly women (GC) were healthy; 4 of 5 young women (YC) were healthy. The normal range for allelic frequencies was 21% to 80%, determined from more than 200 healthy women.5 Bold type indicates patients with skewed allelic methylation by HUMARA assay; blank cells indicate not determined.

Linear regression analysis of the correlation between allelic expression ratios for 2 markers. PLT indicates platelets; GNC, granulocytes. Comparison between allelic expression ratios in the same individual, either between markers within the same lineage (A,B) or between lineages (C). Individuals informative for more than one marker were used for comparison of the expression ratios in platelets (A) or granulocytes (B). An identical analysis was performed for comparison of a single marker between platelet and granulocyte lineages, within the same individual (C). Excellent correlations were found between compared values obtained in platelets and granulocytes, with P value less than .001.
Linear regression analysis of the correlation between allelic expression ratios for 2 markers. PLT indicates platelets; GNC, granulocytes. Comparison between allelic expression ratios in the same individual, either between markers within the same lineage (A,B) or between lineages (C). Individuals informative for more than one marker were used for comparison of the expression ratios in platelets (A) or granulocytes (B). An identical analysis was performed for comparison of a single marker between platelet and granulocyte lineages, within the same individual (C). Excellent correlations were found between compared values obtained in platelets and granulocytes, with P value less than .001.
Statistical analysis and comparison of transcribed exonic SNPs between elderly and young cohorts of healthy women as a function of age, marker, and cell lineage
| Mean | Median | SD | P | |
|---|---|---|---|---|
| MPP1, n = 7 | ||||
| Age, y | 82.6 | 82.0 | 6.9 | <.001 |
| PLT allele frequency | 64.1 | 65.0 | 10.9 | >.05 (NS) |
| GNC allele frequency | 62.7 | 59.0 | 9.7 | >.05 (NS) |
| FHL1, n = 19 | ||||
| Age, y | 81.4 | 82.0 | 7.6 | <.001 |
| PLT allele frequency | 62.8 | 61.0 | 6.6 | >.05 (NS) |
| GNC allele frequency | 61.4 | 61.0 | 6.0 | >.05 (NS) |
| IDS, n = 17 | ||||
| Age, y | 78.7 | 77.0 | 9.1 | <.001 |
| PLT allele frequency | 60.4 | 60.0 | 6.2 | >.05 (NS) |
| GNC allele frequency | 60.4 | 60.0 | 5.6 | >.05 (NS) |
| G6PD, n = 2 | ||||
| Age, y | 92.0 | 92.0 | 0.0 | - |
| PLT allele frequency | 65.0 | 61.0 | 7.8 | >.05 (NS) |
| GNC allele frequency | 62.0 | 58.0 | 6.9 | >.05 (NS) |
| BTK, n = 11 | ||||
| Age, y | 81.8 | 82.0 | 8.8 | <.001 |
| PLT allele frequency | 63.3 | 67.0 | 6.4 | >.05 (NS) |
| GNC allele frequency | 63.1 | 66.0 | 6.5 | >.05 (NS) |
| Overall GC, n = 56 | ||||
| Age, y* | 81.4 | 82.0 | 8.2 | <.001 |
| PLT allele frequency | 62.5 | 61.0 | 7.1 | >.05 (NS) |
| GNC allele frequency | 61.7 | 61.0 | 6.5 | >.05 (NS) |
| Overall YC, n = 9 | ||||
| Age, y* | 33.4 | 33.0 | 5.7 | N/A |
| PLT allele frequency | 59.0 | 60.0 | 4.4 | N/A |
| GNC allele frequency | 58.4 | 57.0 | 4.9 | N/A |
n represents number of expressed ratios used for calculations that includes individuals who are informative for more than one marker; NS indicates not statistically significant.
Age is not included.
Comparison between methylation-based HUMARA assay and our novel quantitative clonality assay in elderly women
Based on reported HUMARA data, approximately 30% of elderly women were found to have skewed X-chromosome allelic usage (most prevalent allele frequency greater than 80%). We performed clonality testing by HUMARA assay in all those elderly subjects whenever sufficient genomic DNA was available (30 of 40 elderly women). One of 30 could not be determined due to overlapped PCR stutter peaks; 3 were noninformative (homozygous) based on results from HpaII-undigested DNA; 9 had skewed (> 80%) HUMARA-based X-chromosome allelic usage; and the remaining 17 elderly women had normal HUMARA-based X-chromosome allelic usage (Table 3). Presence of skewed allelic methylation ratios in 9 (35%) of 26 informative elderly women by this assay in our cohort is in agreement with previously reported literature. In contrast, as already shown, we did not observe skewed or clonal hematopoiesis in any of these same individuals using our novel quantitative transcriptional clonality assay. Formal statistical analysis, using an exact binomial test, further emphasized the discrepancy between results obtained using our novel transcriptional clonality assay and analysis of methylation at the HUMARA locus (P < .001; exact 95% CI, 0-0.1).
Validation of quantitative clonality assay in patients with clonal hematologic disorders
We obtained genomic DNA from peripheral blood granulocytes of 15 women with well-characterized myeloproliferative disorders and known somatic mutation markers (Table 4). Of these 15 women, 8 patients had polycythemia vera, 4 had essential thrombocythemia, 1 had primary myelofibrosis, and 2 had primary myelofibrosis in transformation to acute myeloid leukemia. In addition, 7 women with nonclonal hematologic disorders were tested: secondary thrombocytosis (2 patients), secondary erythrocytosis (4 patients), and secondary leukocytosis (1 patient). Using our novel quantitative transcriptional clonality assay, all patients with a myeloproliferative disorder were clonal, whereas none of the patients with secondary conditions were clonal (Table 4).
Validation of quantitative clonality assay in patients with hematologic disorders
| Patient | Diagnosis | Age, y | Somatic mutations (allele frequency) | Allelic frequencies of expressed exonic polymorphism in platelets | |||||
|---|---|---|---|---|---|---|---|---|---|
| JAK2V617F | cMPLW515L | MPP1 | FHL1 | IDS | BTK | G6PD | |||
| P1 | ET | 55 | 2.2 | 53.5 | 88/12 | ||||
| P2 | ET | 57 | 24.3 | 0 | 1/99 | ||||
| P3 | ET | 57 | 19.2 | 0 | 98/2 | 4/96 | |||
| P4 | ET | 60 | 44 | 0 | 9/91 | 96/4 | |||
| P5 | PMF | 66 | 53 | 0 | 3/97 | ||||
| P6 | PMF with AML | 41 | 0 | 0 | 2/98 | 2/98 | |||
| P7 | PMF with AML | 51 | 6.2 | 0 | 100/0 | 100/0 | |||
| P8 | PV | 8 | 20 | 0 | 96/4 | 100/0 | 94/6 | ||
| P9 | PV | 49 | 75.8 | 0 | 100/0 | 95/5 | |||
| P10 | PV | 50 | 15.4 | 0 | 100/0 | 3/97 | |||
| P11 | PV | 61 | 97 | 0 | 98/2 | 100/0 | 2/98 | ||
| P12 | PV | 74 | 44.5 | 0 | 1/99 | ||||
| P13 | PV | 74 | 94.3 | 0 | 98/2 | ||||
| P14 | PV | 80 | 65.6 | 0 | 100/0 | 0/100 | |||
| P15 | PV | 90 | 40.2 | - | 99/1 | ||||
| P16 | Sec erythro | 37 | 0 | 0 | 53/47 | ||||
| P17 | Sec erythro | 42 | 0 | 0 | 42/58 | 50/50 | |||
| P18 | Sec erythro | 47 | 0 | 0 | 58/42 | ||||
| P19 | Sec erythro | 47 | 0 | 0 | 35/65 | 52/48 | |||
| P20 | Sec leuko | 78 | 0 | 0 | 70/30 | ||||
| P21 | Sec thrombo | 37 | 0 | 0 | 70/30 | 60/40 | |||
| P22 | Sec thrombo | 46 | 0 | 0 | 30/70 | ||||
ET indicates essential thrombocythemia PMF, primary myelofibrosis; AML, acute myeloid leukemia; PV, polycythemia vera; Sec, secondary; erythro, erythrocytosis; leuko, leukocytosis; and thrombo, thrombocytosis. Blank cells indicate not informative and thus not determined.
Discussion
Detection of clonality based on discrimination of the state of DNA methylation4 greatly extended the applicability of X-chromosome inactivation studies to a broader population. The initial assays for assessment of clonality using X-chromosome inactivation principle were hampered by relatively low allelic frequencies of polymorphic markers used.3-6,33 However, this shortcoming was overcome by the description of the highly polymorphic CAG repeat in the human androgen-receptor gene (HUMARA assay) that also correlated with X-chromosome inactivation,34 rendering the majority of women informative for X-chromosome inactivation assays. Several studies involving genetically identical organisms have uncovered profound phenotypical variation. This disparity is at times compounded by exposure to differing environmental conditions.35,36 Reports of cloned animals with different coat patterns and behavioral characteristics indicate that the environment plays a significant role in establishing these traits.37 Changes in DNA methylation at CpG islands, which may be associated with transcriptional silencing, have been linked to an organism's response to environmental factors.38 For example, studies of DNA methylation patterns in monozygotic twins found that although they are epigenetically identical at a young age, as they get older, differences in the content and distribution of methylcytosine and associated gene expression diverged.39 Furthermore, significant differences in expression phenotypes between twins are observed at specific chromosomal locations.40 These locations are characterized by having a low gene density, and usually contain genes that are involved in cellular response to external signals.40 Analysis of 1.5 Mb genomic DNA flanking the HUMARA, MPP1, FHL1, IDS, G6PD, and BTK genes resulted in gene densities of 3, 59, 30, 20, 54, and 36 genes, respectively, a factor that may influence data obtained by HUMARA technique compared with the analyses of X-chromosome polymorphic genes used here. Further, interpretation of the methylation results can be confounded by several factors that can occur during the assay, such as incomplete digestion by the methylation-sensitive enzyme. Quantitation of allelic methylation ratios is further confounded by difficulty in estimation of the area underneath an allele peak (especially when alleles are separated by only 3 bp) due to PCR stutter as a consequence of amplification of small tandem repeats (STRs). Moreover, HUMARA allelic products of different sizes are amplified with different efficiencies by PCR. In addition, methylation of genes has been shown to vary over progressive cellular divisions, and can be influenced by environmental factors such as drugs, nutrition, and in vitro manipulation of cells during diagnostic testing. Lastly, methylation of inactive genes is not uniform throughout the inactive X chromosome since many inactivated genes can be either methylated or hypomethylated.28,41
Age-dependent skewing in the ratio of allelic methylation at the X-chromosome–linked HUMARA locus has been reported previously.20-23 Likewise, analysis of our cohort of elderly women, using the methylation-based HUMARA assay, is consistent with age-dependent skewing at this locus, and preferential methylation of one allele. Stochastic models of age-dependent skewing at the HUMARA locus based on contraction of the hematopoietic stem cell pool and clonal dominance were hypothesized.22,23 However, recent observations demonstrate a functional deficit in yet-increased numbers of hematopoietic stem cells with aging.42,43 Moreover, reports of accumulating DNA damage44 and loss of epigenetic regulation45 in quiescent aging hematopoietic stem cells may explain this age-dependent skewing. The molecular mechanism and functional relevance of age-dependent skewed methylation at the HUMARA locus remain unanswered, and will have to be addressed in future studies.
To address the issue of possible clonal evolution of hematopoiesis with aging, it was necessary to accurately quantify expressed X-chromosome allelic ratios without introducing a bias resulting in preferential detection of one of the polymorphic alleles. Previously, we used a quantitative and reproducible transcriptional clonality assay based on the ligase detection.6,10,31 However, this method required use of large quantities of radiolabeled nucleotide with high specific activity. Further, ligated products had to be separated on a polyacrylamide gel, and radioactive bands accurately enumerated by use of a PhosphoImager (Molecular Dynamics, Sunnyvale, CA). This laborious and hazardous method was subsequently replaced by a simpler, semiquantitative single-stranded conformational polymorphism method (SSCP).26 Because some X-chromosome genes are only partially or not at all inactivated,41 we had to prove that all the genes we studied here are subject to X-chromosome inactivation and are polymorphic in all major US ethnic groups, and this was indeed previously documented for the analyses of X-chromosome exonic polymorphisms used here, that is FHL1, IDS, MPP1, BTK, and G6PD.10,26-31 These markers now provide excellent coverage of all major US ethnic groups. The quantitative clonality method described here discriminates with high specificity single nucleotide polymorphisms and allows accurate estimation of the proportion of active X-chromosome transcripts in a tissue. This permits not only determination of clonal cells comprising the majority of circulating cells, but also detection of subclones among circulating polyclonal cells by comparing allelic usage ratios of platelets and granulocytes to the circulating long-lived T lymphocytes.6,10,31
We show that all informative elderly women (Table 2) exhibit similar ratio of transcribed X-chromosome allelic usage compared with younger women. In addition, both groups of healthy elderly and young women differ by a single statistically significant variable, age. Finally, our data demonstrate that in the absence of comorbid conditions, most healthy individuals do not exhibit clonality and oligoclonality of hematopoiesis with aging.
An Inside Blood analysis of this article appears at the front of this issue.
The online version of this article contains a data supplement.
The publication costs of this article were defrayed in part by page charge payment. Therefore, and solely to indicate this fact, this article is hereby marked “advertisement” in accordance with 18 USC section 1734.
Acknowledgments
The authors acknowledge helpful comments of George Chen and Alexander Gimelbrant.
This work was supported by 1P01CA108671-O1A2 (National Cancer Institute, Bethesda, MD) awarded to the Myeloproliferative Disorders Consortium (PI Ron Hoffman) project no. 1 (PI J.T.P.) and R01HL50077-14 National Heart, Lung, and Blood Institute, (PI J.T.P., Molecular Biology of Primary Polycythemia.
National Institutes of Health
Authorship
Contribution: S.I.S., N.A., and R.H.N. designed the study, performed research, analyzed data, and wrote the paper; N.A. and G.R. accrued study subjects and obtained their consent, and reviewed the paper; A.W. performed statistical analysis and reviewed the paper; A.A. accrued study subjects, participated in study design, and reviewed the paper; and J.T.P. designed the study, analyzed data, and wrote the paper.
Conflict-of-interest disclosure: The authors declare no competing financial interests.
Correspondence: J. T. Prchal, University of Utah, School of Medicine, Hematology Division, SOM 5C210, 30 N 1900 E, Salt Lake City, UT 84132; e-mail: josef.prchal@hsc.utah.edu.
