Abstract
Background B-cell chronic lymphocytic leukemia (B-CLL) is a well-defined clinical entity with heterogeneous molecular and cytogenetic features. Chromosome aberrations could be associated to specific CLL clinical features and outcomes and their impact on clonal evolution should have been addressed by using temporal analysis. In order to demonstrate the role of temporal analysis in CLL we conducted a comprehensive karyotypic survey of a large number of CLL cases with already known genetic aberrations to fully describe their meaning in terms of biological evolution.
Methods A total of 1749 karyotypes were retrieved from the Mitelman Database of Chromosome Aberrations in Cancer. A matrix depicting the 360-band human chromosome ideogram was created. Regions that were either lost or gained in more than 3% of the cases were retained and identified as recurrent imbalances. Early and late imbalances were defined according to the appearance on the complex karyotypes. Descriptive statistics were used to summarize the genetic abnormalities.
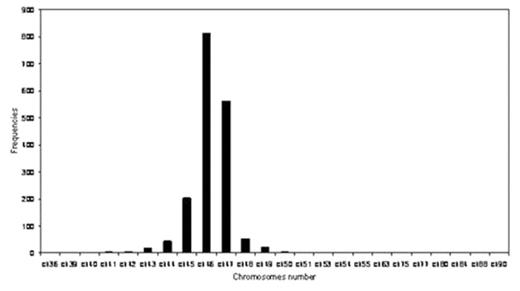
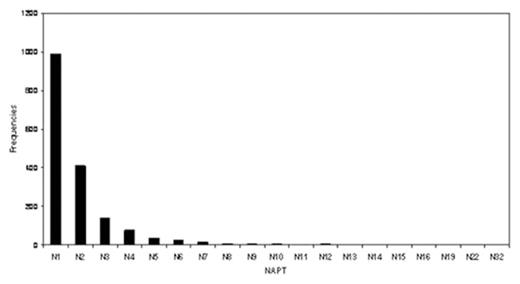
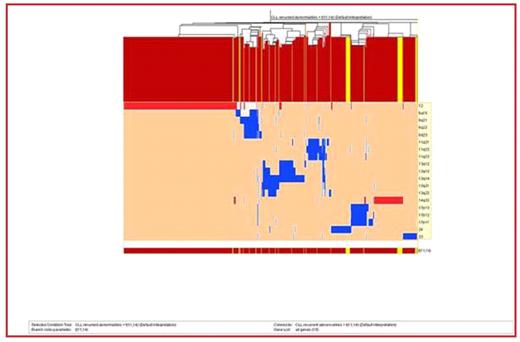
Results The median chromosome number and the median number of abnormalities per tumor (NAPT) were 46 and 1 respectively. (Figure 1 A and 1B) The most common abnormality seen was trisomy 12 which occurred in 29% (508 cases) followed by 13q14del (10.34%), 13q13del (6.63%) and add14q32 (6.63%). The temporal analysis revealed +12, 13q-, −17, 17p-, −Y and −X to be early imbalances (TO<5), followed predominately by a late loss with TO=5–10.5 (11q-). Hierarchical clustering suggested there are different groups including:
trisomy 12,
13q-,
11q-, and
6q-, which at least in this clustering analysis appeared to be mutually exclusive.
In summary, we can conclude that overall CLL is a neoplasia that shows remarkable chromosome stability even when only abnormal karyotypes are evaluated. Interestingly, clustering analysis suggests there are non-overlapping, unique subsets of CLL cases where trisomy 12 is the most common and along with 13q-emerged as early events on CLL clonal evolution.
Chromosomes distribution in chronic Lymphocytes Leukemia karyotypes
Chronic Lymphocytes Leukemia and Number of Abnormalities Per Tumor (NAPT) distribution
Chronic Lymphocytes Leukemia and Number of Abnormalities Per Tumor (NAPT) distribution
Figure
Disclosures: No relevant conflicts of interest to declare.
Author notes
Corresponding author


This feature is available to Subscribers Only
Sign In or Create an Account Close Modal