Abstract
Background: Long-term survival in NK-AML is influenced by different clinical and molecular markers. Whereas the presence of a NPM-1 mutation is associated with a positive prognostic effect on long-term outcome, the presence of a FLT3-ITD mutation has a negative impact on survival. Interestingly, a significant interaction between NPM-1 and FLT3-ITD mutations has been shown. The positive prognostic impact on clinical outcome was evident predominantly in patients with NK-AML carrying NPM1 gene mutations when FLT3-internal tandem duplications (ITD) were absent. In contrast, the survival in all other groups of NPM-1 and FLT3-ITD combinations was not different so far. A clinical parameter with negative impact on all outcome parameters (OS, EFS, RFS, CR) is patient age at diagnosis. Certainly the worse prognosis in elderly patients is due to adverse patient characteristics and comorbidities. Nevertheless also disease-associated parameters reveal differences between older and younger patients with AML. Therefore we investigated the frequencies of NPM-1/FLT3-ITD mutations in different age groups.
Patients and methods: Analyses were based on 803 patients with NK-AML included in the AMLCG (German AML Cooperative Group) 2000 trial until 01/2006. Patient age ranged from 17 to 85 years (median: 60 yrs). Information about the mutation status of NPM-1 and FLT3-ITD mutations at diagnosis was available in 689 patients. Patients were divided into six age groups (1: 17–30yrs; 2: 31–40yrs; 3: 41–50yrs; 4: 51–60yrs; 5: 61–70yrs; 6: 71–85yrs). The incidence of the molecular markers NPM-1 and FLT3-ITD as well as the four NPM-1 and FLT3-ITD combinations were calculated in cross tables (Pearson’s Chi Square test) in the different age groups.
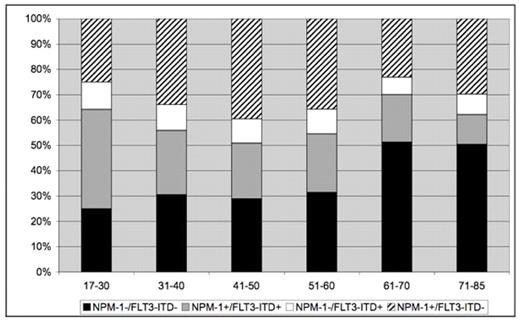
Results: In 689 patients with available mutations status we found a significant decrease in the frequency of the two molecular markers with higher age. Whereas the incidence of NPM-1 mutation decreased abruptly in patients >60 yrs [Group 1: 18/28 (64.3%), 2: 35/59 (59.3%), 3: 70/114 (61.4%), 4: 84/143 (58.7%), 5: 98/234 (41.9%), 6: 46/111 (41.4%); p<0.0001], the incidence of a FLT3-ITD decreased continuously with increasing age [Group 1: 14/28 (50.0%), 2: 21/59 (35.6%), 3: 36/114 (31.6%), 4: 47/143 (32.9%), 5: 60/234 (25.6%), 6: 22/111 (19.8%); p=0.013)]. Combining both markers we found a significant relative increase of NPM-1−/FLT3-ITD− patients (p<0.0001) with a sharp cut at 60 years whereas the NPM-1+/FLT3-ITD+ group diminished continuously (p=0.020). The proportion of the positive prognostic group of NPM-1+/FLT3-ITD− patients showed an increase between 40–60 years and a decrease afterwards (p=0.024) (see table 1 and figure 1).
Conclusions: Our data show in a large cohort of 689 patients with NK-AML that the presence of mutations of the molecular markers NPM-1 and FLT3-ITD significantly decreases with age. Consequently the proportion of NPM-1−/FLT3-ITD− patients increases over time. This observation sheds light on the disease biology in older patients with AML.
Table 1: Distribution of the NPM-1, FLT3-ITD and the 4 NPM-1/FLT3-ITD subgroups in different age groups
| age groups . | NPM-1 + % . | FLT3-ITD+ (%) . | NPM-1−/FLT3-ITD−(%) . | NPM-1+/FLT3-ITD+ (%) . | NPM-1−/FLT3-ITD+ (%) . | NPM-1+/FLT3-ITD− (%) . |
|---|---|---|---|---|---|---|
| 17–30 | 64.3 | 50.0 | 25.0 | 39.3 | 10.7 | 25.0 |
| 31–40 | 59.3 | 35.6 | 30.5 | 25.4 | 10.2 | 33.9 |
| 41–50 | 61.4 | 31.6 | 28.9 | 21.9 | 9.6 | 39.5 |
| 51–60 | 58.7 | 32.9 | 31.5 | 23.1 | 9.8 | 35.7 |
| 61–70 | 41.9 | 25.6 | 51.3 | 18.8 | 6.8 | 23.1 |
| 71–85 | 41 4 | 19.8 | 50.5 | 11.7 | 8.1 | 29.7 |
| all age groups (%) | 50.9 | 29.0 | 40.5 | 20.5 | 8.5 | 30.5 |
| p-value | < 0.0001*** | 0.013* | < 0.0001*** | 0.020* | 0.886 | 0.024* |
Proportions of the four NPM-1/FLT3-ITD subgroups in different age groups
Disclosures: No relevant conflicts of interest to declare.
Author notes
Corresponding author


This feature is available to Subscribers Only
Sign In or Create an Account Close Modal