Abstract
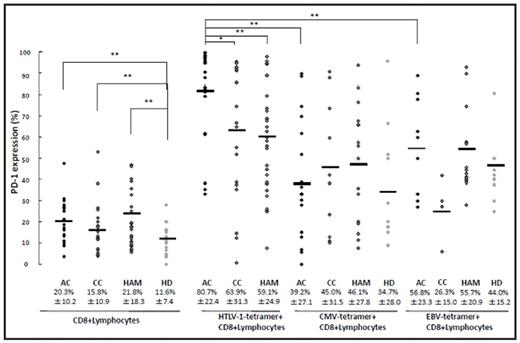
Human T-cell leukemia virus-1 (HTLV-1) is the first human retrovirus that has infected approximately 10–20 million people worldwide and causes adult T cell leukemia/lymphoma (ATLL) and HTLV-1-associated myelopathy/tropical spastic paraparesis (HAM/TSP) after long-term chronic infection. The immune response to HTLV-1 is typically enhanced in HAM/TSP, while impaired cell-mediated immunity has been identified as a causative basis of immunodeficiency in ATLL. The negative immuno-regulatory program death-1 (PD-1) signaling is involved in auto-immunity, allergy, sites of immune privilege, and antitumor immunity. We have previously reported decreased frequency and function of HTLV-1 Tax-specific CD8+ T-cell in ATLL patients due to insufficient cytolytic effector molecules, as well as upregulated PD-1 expression on HTLV-1-specific CTLs from asymptomatic carriers (ACs) and ATLL patients. That PD-1 expression was significantly higher on HTLV-1 specific CD8+ T-cells, as well as CMV− and EBV-specific CTLs in ATLL patients compared to ACs, suggested that PD-1 signaling plays a role in fostering persistent HTLV-1 infections, facilitating immune evasion by ATLL cells, which may further ATLL development (ASH annual meeting 2006, 2007). However, there is no report on the repertoir and PD-1 expression of HTLV-1-specific CTL in carriers with hyper immune states such as collagen disease or HAM/TSP. Therefore, to characterize HTLV-1-specific CTL in asymptomatic HTLV-1 carriers (ACs), carriers with collagen disease (CCs) and HAM/TSP patients, we examined the frequency, diversity and PD-1 expression of HTLV-1-specific CTL in 23 ACs, 33 carrier with collagen vascular disease, 40 HAM/TSP patients and 18 healthy donors (HDs) using 16 distinct HTLV-1 Tax/Env HLA-A*0201 and HLA-A*2402 tetramers. The difference in frequency of HTLV-1 Tax-specific CTL positivity was not statistically significant between CCs, HAM/TSP or ACs. In contrast, HTLV-1 Env-specific CTL were significantly more frequent in autoimmune disorders and HAM/TSP than those in ACs (Table 1). On the other hand, percentages of CD8+ lymphocytes from these carriers expressing PD-1 were significantly higher than that from HDs. Futhermore, the rates of PD-1 expression on CMV- or EBV-specific CTL in CCs, HAM/TSP and ACs were similar although PD-1 expression was significantly down-regulated on HTLV-1-specific CTL in CCs and HAM/TSP compaired to ACs (Figure1, p<0.05 and p<0.01, respectively). Few lymphocytes from these carriers were positive for the PD-L1 ligand, while PD-L1 expression was observed on lymphocytes cultured for 12 hours from ACs (5 of 6), but less from CCs and HAM/TSP (1 of 6 and 0 of 4, respectively). The diversity, frequency and repertoir of HTLV-1-specific CD8+ T cell clones, especially HTLV-1 Env CTLs, may be related to the hyper immune response in CCs and HAM/TSP. The down-regulation of PD-1 on HTLV-1 Tax-specific CTL and loss of PD-L1 expression in CCs and HAM/TSP may explain the apparent hyper immune response against HTLV-1 Tax protein.
Table 1. HTLV-1/HLA tetramers positive subjects
| HLA allele . | Tetramers . | AC . | CC . | HAM/TSP . |
|---|---|---|---|---|
| The number of subjects positive for tetramers; the percentages of HTLV-1/HLA tetramer+ CD8+ T cells in the CD8+ lymphocytes > 0.1% are counted as subjects positives for tetramer, *, P < 0.01, significant differences from AC by χ2 test. | ||||
| A*02 | Tax | 100% (8/8) | 75% (9/12) | 90% (9/10) |
| A*02 | Env | 0% (0/8) | 25% (3/12) | 10% (1/10) |
| A*24 | Tax | 94% (17/18) | 88% (21/24) | 100% (15/15) |
| A*24 | Env | 6% (1/18) | 63% (15/24)* | 40% (6/15)* |
| Tax CTL | 96% (22/23) | 82% (27/33) | 100% (18/18) | |
| Eav CTL | 4% (1/23) | 48% (16/33)* | 50% (9/18)* | |
PD-1 expression on virus-specific CD8+ T lymphocytes in ACs, carriers with collagen disease (CCs) and HAM/TSP. Percentage of PD-1 expression on CD8+ lymphocytes and HTLV-1-, CMV-, EBV-specific CD8+ lymphocytes in AC, CC, HAM/TSP and healthy donors (HDs). Horizontal bars indicate the mean percentage of PD-1-positive cells. The number below each subject is the mean±SD. *P<0.001; **P<0.01 (Significant differences by Mann-Whitney U test).
PD-1 expression on virus-specific CD8+ T lymphocytes in ACs, carriers with collagen disease (CCs) and HAM/TSP. Percentage of PD-1 expression on CD8+ lymphocytes and HTLV-1-, CMV-, EBV-specific CD8+ lymphocytes in AC, CC, HAM/TSP and healthy donors (HDs). Horizontal bars indicate the mean percentage of PD-1-positive cells. The number below each subject is the mean±SD. *P<0.001; **P<0.01 (Significant differences by Mann-Whitney U test).
Disclosures: No relevant conflicts of interest to declare.
Author notes
Corresponding author


This feature is available to Subscribers Only
Sign In or Create an Account Close Modal