Abstract
It is thought that 2 x 10⁶/kg is the minimum CD34+ cell dose needed for autotransplantation, while the ideal dose is generally accepted to be 5 x 10⁶/kg. Whether infusing cell doses higher than 5 x 10⁶/kg offers additional benefit is unknown. The relationship between time to standard engraftment endpoints (0.5 x 10⁹/L Neutrophils – ANC 0.5, 1 x 10⁹/L neutrophils – ANC 1.0, 20 x 109/L platelets – PLT 20, and 50 x 109/L platelets – PLT 50) and the CD34+ cell doses infused was explored in 754 autografts performed for malignant diseases in adult patients: 32 leukemia, 195 lymphoma, 514 myeloma, 13 other. The conditioning regimens used were standard (high-dose melphalan, BEAM, busulfan-cyclophosphamide, or busulfan-etoposide in >90%). All patients received G-CSF after stem cell infusion: from day 0 in <10% and from day +5 in >90%. Cell dose calculations were based upon ideal body weight. Table 1 shows the distribution of the CD34+ cell ranges infused.
Table 1: CD34+ cell numbers infused (106/kg IBW)
| CD34+ cell dose . | n . | CD34+ cell dose . | n . |
|---|---|---|---|
| ≤3 | 42 | >3 | 712 |
| ≤4 | 109 | >4 | 645 |
| ≤5 | 260 | >5 | 494 |
| ≤6 | 434 | >6 | 320 |
| ≤7 | 534 | >7 | 220 |
| ≤8 | 586 | >8 | 168 |
| ≤9 | 619 | >9 | 135 |
| ≤10 | 646 | >10 | 108 |
| ≤15 | 714 | >15 | 40 |
| CD34+ cell dose . | n . | CD34+ cell dose . | n . |
|---|---|---|---|
| ≤3 | 42 | >3 | 712 |
| ≤4 | 109 | >4 | 645 |
| ≤5 | 260 | >5 | 494 |
| ≤6 | 434 | >6 | 320 |
| ≤7 | 534 | >7 | 220 |
| ≤8 | 586 | >8 | 168 |
| ≤9 | 619 | >9 | 135 |
| ≤10 | 646 | >10 | 108 |
| ≤15 | 714 | >15 | 40 |
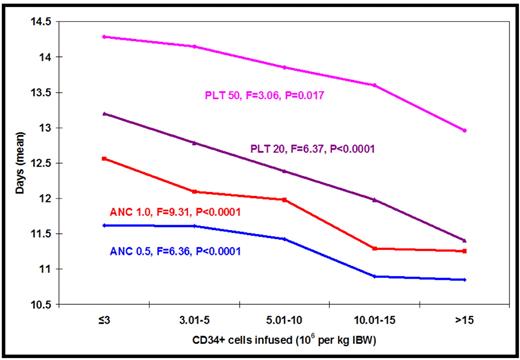
Figure 1 shows the mean days to achieving the 4 engraftment endpoints under study by the number of CD34+ cells infused. It is clear that increasing CD34+ cell doses hasten platelet recovery significantly through the entire range of CD34+ cell dose ranges studied. Increasing CD34+ cell doses appear to hasten neutrophil recovery too, but the benefit seems to level off beyond 10 x 106 CD34+ cells per kg. The effect of a CD34+ cell dose of ≤2 x 10⁶/kg was not analyzed because only 7 patients received this small quantity of cells.
The effect of different CD34+ cell dose ranges on various engraftment endpoints
The effect of different CD34+ cell dose ranges on various engraftment endpoints
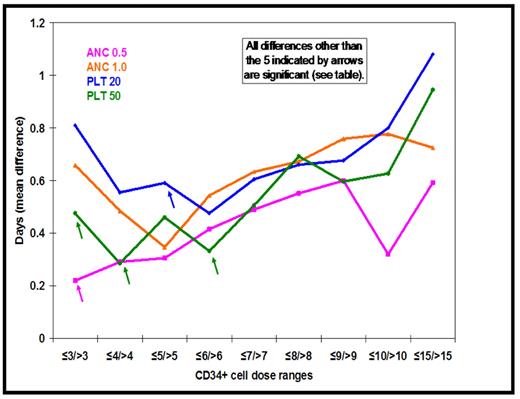
The relationship between CD34+ cell doses and engraftment holds true even when the data are analyzed in a dichotomous fashion as shown in Figure 2.
| CD34+ cell dose bands . | ANC 0.5 . | ANC 1.0 . | PLT 20 . | PLT 50 . |
|---|---|---|---|---|
| ≤3/>3 | 0.28 | 0.003 | 0.083 | 0.43 |
| ≤4/>4 | 0.029 | 0.0007 | 0.027 | 0.39 |
| ≤5/>5 | 0.002 | 0.001 | 0.0004 | 0.031 |
| ≤6/>6 | <0.0001 | <0.0001 | 0.002 | 0.076 |
| ≤7/>7 | <0.0001 | <0.0001 | 0.0002 | 0.009 |
| ≤8/>8 | <0.0001 | <0.0001 | 0.0002 | 0.006 |
| ≤9/>9 | <0.0001 | <0.0001 | 0.0004 | 0.005 |
| ≤10/>10 | <0.0001 | <0.0001 | <0.0001 | 0.006 |
| ≤15/>15 | 0.005 | 0.001 | 0.003 | 0.004 |
Table 2 shows the significance of the differences illustrated in Figure 2.
Table 2: Significance of differences in time to engraftment
These data suggest that increasing CD34+ cell numbers hasten hematologic recovery – even beyond a cell dose of 15 x 106/kg. It remains to be seen if more rapid engraftment resulting from infusion of higher number of CD34+ cells results in practical benefits such as more robust/durable engraftment, decreased toxicity, and improved survival.
Disclosures: No relevant conflicts of interest to declare.
Author notes
Corresponding author


This feature is available to Subscribers Only
Sign In or Create an Account Close Modal