Abstract
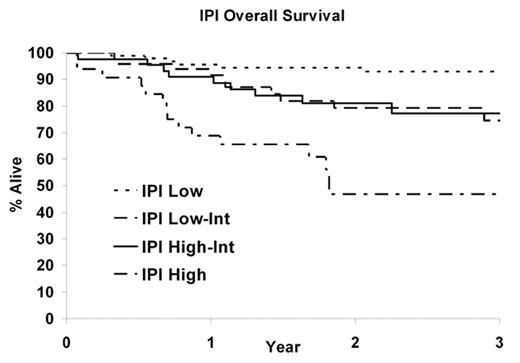
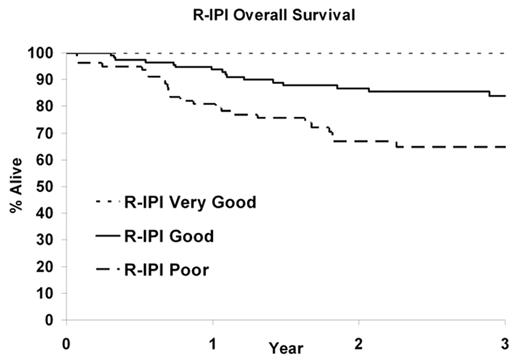
The International Prognostic Factor Index (IPI) predicts survival in DLBCL in patients treated with chemotherapy. The Revised IPI (R-IPI) has been reported to be a simpler and more accurate predictor of outcome in patients treated with immunochemotherapy (rituximab and anthracycline-based chemotherapy). We evaluated the predictive value of the IPI and the R-IPI in an observational cohort of unselected patients treated with R-CHOP. Consecutive, newly diagnosed patients age 18 years and older with DLBCL were prospectively offered enrollment into our Lymphoma SPORE Registry. Pathology was centrally reviewed, and composite lymphomas and history of concurrent or prior cancers were excluded. All patients were actively followed for progression free progression (PFS) and overall survival (OS). Here we report on patients enrolled from 9/2002 – 6/2006. 229 patients with a median age of 62 years (range 20–93) were evaluated. 56% were >60 years of age, 16% had a performance score ≥2, 54% had an elevated LDH, 19% had >1 extranodal site, and 51% were stage III/IV. During follow-up, there were 63 progressions (28%) and 45 deaths (20%), and the median follow-up time for living patients was 34 months (range 6–61 months). As shown in the table and figure, the IPI and R-IPI were predictive for both PFS and OS (all p<0.001). The predictive ability of the IPI as measured by 3-year concordance index was stronger for the IPI (0.71) compared to the R-IPI (0.67) and the bootstrap 95% confidence interval for the difference (0.01, 0.08) indicates that this difference was statistically significant. While all factors in the IPI were statistically significant (p<0.05) predictors of OS individually, when included in a multivariate model, an elevated LDH (HR=1.5; p = 0.32) and >1 extranodal sites (HR=1.0; p = 0.96) were no longer significant; similar results were obtained for PFS. The IPI remains a strong predictor of PFS and OS in the immunochemotherapy era.
| Group . | % Pats . | 3 Y PFS . | HR . | 95% CI . | 3 Y OS . | HR . | 95% CI . |
|---|---|---|---|---|---|---|---|
| Standard IPI . | . | . | . | . | . | . | . |
| Low (0,1) | 41% | 87% | 1.0 | ref | 93% | 1.0 | ref |
| Low-Int (2) | 22% | 62% | 3.1 | (1.4, 6.8) | 74% | 4.2 | (1.6, 11.1) |
| High-Int (3) | 21% | 60% | 3.1 | (1.4, 6.8) | 77% | 3.4 | (1.2, 9.7) |
| High (4,5) | 15% | 39% | 7.2 | (3.4, 15.2) | 47% | 10.2 | (4.0, 26.5) |
| R-IPI | |||||||
| Very good (0) | 11% | 96% | 1.0 | ref | 100% | 1.0 | ref |
| Good (1,2) | 53% | 74% | 6.2 | (0.8, 46.0) | 84% | - | - |
| Poor (3–5) | 36% | 52% | 13.5 | (1.8, 98.9) | 65% | - | - |
Author notes
Disclosure: No relevant conflicts of interest to declare


This feature is available to Subscribers Only
Sign In or Create an Account Close Modal