To the editor:
The biological heterogeneity of myeloma can be largely explained by genetic subtypes characterized by primary translocations, or trisomies of chromosomes 3, 5, 7, 9, 11, 15, 19, and 21. In newly diagnosed patients, it is well established that these genetic subtypes have different survival rates.1 However, the prevalence and survival of the main genetic subtypes in relapse patients is unknown.
We studied the prevalence and survival according to the TC (the translocation and cyclin D) classification,2 which corresponds to the main genetic subtypes, in patients with relapsed myeloma entered into single-agent bortezomib trials (bortezomib cohort3 ). For comparison, we analyzed a large gene expression data set of newly diagnosed patients treated with total therapy II from the University of Arkansas for Medical Science (UAMS cohort).4 Gene expression profiling (GEP) was performed using the U133A and B chip (bortezomib cohort) and U133plus chip (UAMS cohorts) (Affymetrix, Santa Clara, CA). Raw gene expression data were log transformed, median centered, and analyzed using Genespring 7.0 (Agilent Technologies, Palo Alto, CA). Relevant gene expression data were extracted, TC classification was performed, and a proliferation index (PI) based on the expression of 7 genes (TYMS, TOP2A, CCNB1, KIAA0101, CKS1B, UBE2C, TRIP13) was calculated.2
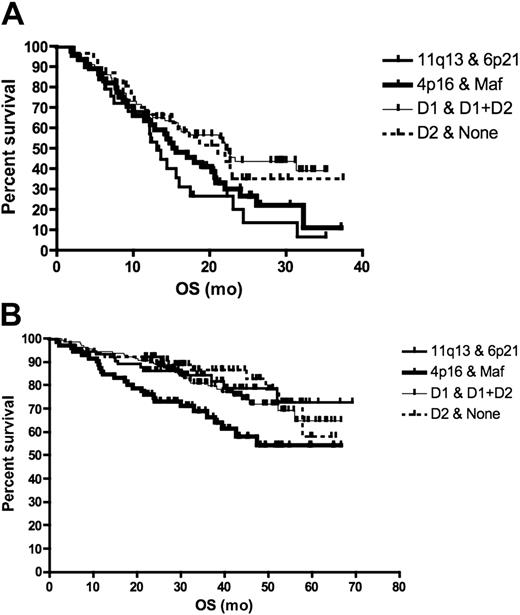
The prevalence of the different TC classes in relapse patients was very similar to newly diagnosed patients (chi-square P = .25). Relapsed patients (bortezomib cohort) with t(11;14) had the worst survival when compared with patients with t(4;14), maf translocation, and hyperdiploidy who had similar survival (survival of t(11;14) versus others, log-rank P = .036) (Figure 1A). In contrast, newly diagnosed patients (UAMS cohort) with t(4;14) and maf translocations had the worst prognosis; t(11;14) and hyperdiploid patients had the best prognosis (log-rank P = .02) (Figure 1B). Of interest, a greater proportion of patients with relapsed than newly diagnosed t(11;14) has PI more than 2 (9% vs 0%, chi-square P = .04). In contrast, there is no difference between the PI of newly diagnosed and relapsed hyperdiploid multiple myeloma (MM) patients (TC D1, 1% vs 2%, P = .19), consistent with a more indolent nature of relapse in this genetic subtype.
Survival according to TC class in relapsed and newly diagnosed patients. For this analysis, we grouped the maf and 4p16 classes (corresponding to poor prognosis genetic subtypes t(4;14) and t(14;16)) together, the D1 and D1 + D2 classes (corresponding mainly to hyperdiploid myeloma) together and the D2 + none classes together. (A) The survival of patients entered into single-agent bortezomib studies, calculated from day of commencing treatment to death, was presented as a Kaplan-Meier survival curve. Patients with 11q13 and 6p21 TC class (corresponding to t(11;14) and t(6;14), n = 29) had the worst prognosis compared with the maf and 4p16 group (n = 45), D1 and (D1 + D2) group (n = 78), and D2 + none group (n = 31) (median survival 13.1 months vs 15.6, 22.2, and 21.1 months, respectively; log-rank P = .036). On pair-wise comparison, only the survival of 11q13 was different from the other subtypes (log-rank P = .036). (B) For patients treated with total therapy II, survival was calculated from commencement of treatment until death. Patients in the 4p16 and maf group (n = 71) had the worst prognosis compared with 11q13 and 6p21 (n = 73), D1 and D1 + D2 (n = 141), and D2 + none group (n = 65) (median survival not reached for all at a median follow-up of 3.5 years; log-rank P = .02).
Survival according to TC class in relapsed and newly diagnosed patients. For this analysis, we grouped the maf and 4p16 classes (corresponding to poor prognosis genetic subtypes t(4;14) and t(14;16)) together, the D1 and D1 + D2 classes (corresponding mainly to hyperdiploid myeloma) together and the D2 + none classes together. (A) The survival of patients entered into single-agent bortezomib studies, calculated from day of commencing treatment to death, was presented as a Kaplan-Meier survival curve. Patients with 11q13 and 6p21 TC class (corresponding to t(11;14) and t(6;14), n = 29) had the worst prognosis compared with the maf and 4p16 group (n = 45), D1 and (D1 + D2) group (n = 78), and D2 + none group (n = 31) (median survival 13.1 months vs 15.6, 22.2, and 21.1 months, respectively; log-rank P = .036). On pair-wise comparison, only the survival of 11q13 was different from the other subtypes (log-rank P = .036). (B) For patients treated with total therapy II, survival was calculated from commencement of treatment until death. Patients in the 4p16 and maf group (n = 71) had the worst prognosis compared with 11q13 and 6p21 (n = 73), D1 and D1 + D2 (n = 141), and D2 + none group (n = 65) (median survival not reached for all at a median follow-up of 3.5 years; log-rank P = .02).
Our observations suggest that although the composition of the various genetic subtypes at diagnosis and relapse appear similar, the prognosis of some subtypes (especially t(11;14)) can be markedly different at relapse when modulated by secondary events (eg, increased proliferation), whereas others (such as hyperdiploid MM) appear to behave similarly at diagnosis and relapse. Our observation also has important therapeutic implications as it suggests relapsed t(11;14) should be treated aggressively and drug combinations or addition of new agents may be more appropriate for these patients. On the other hand, bortezomib seemed to be an effective therapy in relapsed t(4;14) patients, improving the prognosis of these patients to that of genetic subgroups with good prognosis. Our observations highlight the fact that different treatment strategies may be needed for newly diagnosed and relapsed patients even within the same genetic subtypes.
Authorship
Conflict-of-interest disclosure: G.M. and B.B. are employees of Millenium Pharmaceuticals, Inc.
Correspondence: Leif Bergsagel, MD, Mayo Clinic, 13400 E Shea Blvd, Scottsdale, AZ 85259; e-mail: bergsagel.leif@mayo.edu.


This feature is available to Subscribers Only
Sign In or Create an Account Close Modal