

Abstract
Monocytes and macrophages may either promote or down-regulate inflammatory reactions depending on their state of activation. The effects of glucocorticoids (GCs), the most widely used immunosuppressive drugs, on monocytes are currently not well defined. By analyzing the GC-induced expression pattern in human monocytes by microarray technology, we identified for the first time GC-dependent regulation of 133 genes, including anti-inflammatory molecules such as adenosine A3 receptor, CD1d, and IL-1 receptor II. The results were independently confirmed by real-time polymerase chain reaction (PCR) and flow cytometry. Functional clustering of GC-regulated genes indicated induction of monocytic properties such as phagocytosis and motility as well as repression of adhesion, apoptosis, and oxidative burst. These predictions were confirmed by independent functional assays. GCs up-regulate fMLP receptors and specifically promote chemotaxis to this chemoattractant. Furthermore, GCs promote survival of an anti-inflammatory monocytic phenotype in inflammatory reactions, probably by inhibition of apoptosis because of oxidative stress. GCs limit tissue damage because of induction of antioxidative properties and high capacity for phagocytosis of proinflammatory agents. Thus, GC treatment did not cause a global suppression of monocytic effector functions but results in differentiation of a specific anti-inflammatory phenotype which seems to be actively involved in resolution of inflammatory reactions.
Introduction
Glucocorticoids (GCs) are still the most widely used immunosuppressive agents for the treatment of inflammatory disorders and autoimmune diseases.1 However, patients treated for prolonged periods of time with GCs experience deleterious side effects which limit their use in many clinical conditions. Thus, a better understanding of the molecular mechanisms of GC action on immune cells is crucial for the development of more specific anti-inflammatory strategies.
GCs affect nearly every cell of the immune system, but there is growing evidence for cell type–specific mechanisms.2 Development of DNA microarray technologies has provided an opportunity to analyze the effects of GCs on genomewide gene expression in immune cells.3 Although there is at least one description of GC-regulated gene expression patterns in a lymphocyte-enriched cell population,4 there are no comprehensive studies describing genomic GC actions in cells of the innate immune system.
Monocytes represent a central part of innate immunity. They can differentiate into macrophages and dendritic cells and are crucial for nearly every step of an immune reaction, including the initiation of an adaptive immune response, clearance of infectious agents, as well as resolution of inflammation.5-7 Monocytes and macrophages are not a homogeneous cell population, but rather they encompass distinct phenotypes which exhibit a wide range of proinflammatory and anti-inflammatory activities. Proinflammatory and anti-inflammatory properties of macrophages depend mainly on their stage of differentiation as well as on distinct mechanisms of activation.5,6,8 The classical activation of macrophages is achieved by stimulation with IFNγ, followed by exposure to a microbial trigger such as LPS, resulting in a proinflammatory phenotype. Alternatively, activated macrophages are generated by exposure to IL-4 or IL-13. In contrast to classically activated macrophages, these alternatively activated macrophages are involved in antiparasite responses, tissue repair, and allergic reactions. Under distinct conditions, monocytes and macrophages release mediators such as TGFβ and IL-10 which are important for resolution of inflammatory reactions.7,9 There is growing evidence that GCs are involved in this process of macrophage differentiation; however, the cellular mechanisms of this process is not yet known.5,6 We therefore analyzed the GC-induced expression pattern in monocytes using Affymetrix microarrays which represent about 13 000 genes. Using sophisticated statistical analysis and independent functional assays, we show that GC treatment of monocytes not simply suppresses proinflammatory properties but rather induces a distinct functional phenotype which seems to be actively involved in resolution of inflammatory reactions.
Materials and methods
Human cells
Approval was obtained from the ethics committee of the Medical Faculty of Münster for these studies. Informed consent was provided according to the Declaration of Helsinki. Peripheral blood monocytes were obtained from 4 healthy individual donors by leukapheresis and isolated to greater than 90% purity as previously described.10 Cells were cultivated in Teflon bags and allowed to rest for 24 hours prior to stimulation.
Flow cytometry
For detection of cell-surface molecules, flow cytometry was performed as described earlier,11 using mouse monoclonal antibodies against CD11a (Immunotools, Hamburg, Germany), CD163,10 CD36, or fMLP (N-formyl Met-Leu-Phe) receptor (Becton Dickinson, Heidelberg, Germany). An intracellular flow cytometry staining procedure was used for detection of SAP30 (Upstate USA, Chicago, IL) using BD Cytofix/Cytoperm Plus Kit (Becton Dickinson).
DNA microarray hybridization
Monocytes were exposed to 10 nM fluticasone propionate (a generous gift from Glaxo Wellcome, Greenford, United Kingdom) for 16 hours or left untreated. RNA preparation, sample preparation, and hybridization to Affymetrix (Santa Clara, CA) Human Genome 133 A Gene Chip arrays for microarray analysis were performed as described previously.11
Statistical analysis of microarray data
For analysis of data from individual donors, raw data of GC-treated samples were processed by MicroArray Suite (MAS) Software (Affymetrix) using data from corresponding control samples as baseline. Signals were scaled to a target intensity of 500 and log-transformed. Detection and change calls were assigned as described previously.11-13
For more sophisticated statistical analysis, genes with a consistent change call in at least 3 of 4 experiments were retained and further analyzed using Expressionist Suite software (GeneData, Basel, Switzerland) as essentially described earlier.11 Being aware of the low significance at low-intensity levels, we filtered for genes with an expression over background in at least 75% of the respective experimental group (GC-treated versus untreated monocytes). We retained only genes with a fold-change of at least 2.0 or no more than −2.0 and a P value of less than .05 (paired t test). Indicated gene symbols were derived from the NCBI (National Center for Biotechnology Information) GenBank database.14
Quantitative real-time PCR
Expression of selected genes was confirmed by real-time reverse transcription–polymerase chain reaction (RT-PCR) as described previously.11,15 The primers used for PCR analysis were as follows: IL1R2 forward, 5′-ATGACACCCACATAGAGAGCGC-3′; IL1R2 reverse, 5′-GTGCAAATCCTCTCTTGTGACAG-3′; Z39Ig forward, 5′-ACCACTGACATGGATGGCTACC-3′; Z39Ig reverse, 5′-GGTAAAAACCACCATACAGCACAAG-3′; SAP30 forward, 5′-TGGAGGTGATTCACCTGTTCAAG-3′; SAP30 reverse, 5′-TTAAGTCCTGGTCTGGTTGGTAGC-3′; HMGB2 forward, 5′-ATAAACCAGTTCACGCCGGAG-3′; HMGB2 reverse, 5′-CCATGTTGACAGATCCGCG-3′; FPR forward, 5′-GAACTACCCAGAGCAAGACCACAG-3′; FPR reverse, 5′-TACAGCAGGTGTCCCTCCAGAG-3′; IL21R forward, 5′-GGCCGACGACATTTTCAGTG-3′; IL21R reverse, 5′-GGAGATATTATACTGTCCTGAGAAGGTCAC-3′; LTB forward, 5′-CCAGAAACAGATCTCAGCCCC-3′; LTB reverse, 5′-AACGCCTGTTCCTTCGTCG-3′; CD36 forward, 5′-CCAGGTATTGCAGTTCTTTTCTTCTG-3′; CD36 reverse, 5′-TTCAACTGGAGAGGCAAAGGC-3′; CCL5 forward, 5′-CTGTCATCCTCATTGCTACTGCC-3′; CCL5 reverse, 5′-TTGGAGCACTTGCCACTGG-3′; CXCL10 forward, 5′-GCAAGCCAATTTTGTCCACG-3′; CXCL10 reverse, 5′-ACATTTCCTTGCTAACTGCTTTCAG-3′; CXCL9 forward, 5′-GAAAGACCTTAAACAATTTGCCCC-3′; CXCL9 reverse, 5′-TCCTTCACATCTGCTGAATCTGG-3′; CX3CR1 forward, 5′-TGACTGGCAGATCCAGAGGTTC-3′; CX3CR1 reverse, 5′-GTCCCCAATATAACAGGCCTCAG-3′; GAPDH forward, 5′-TGCACCACCAACTGCTTAGC-3′; GAPDH reverse, 5′-GGCATGGACTGTGGTCATGAG-3′; RPL forward, 5′-AGGTATGCTGCCCCACAAAAC-3′; RPL reverse, 5′-TGTAGGCTTCAGACGCACGAC-3′; B2M forward, 5′-TGAGTATGCCTGCCGTGTGA-3′; B2M reverse, 5′-AAATGCGGCATCTTCAAACCT-3′. The relative expression was calculated as 2−ΔCtspecific gene / 2−ΔCtmean (housekeeping genes), using glyceraldehyde phosphate dehydrogenase (GAPDH), ribosomal protein L13a (RPL), and β2-microglobulin (B2M) as endogenous housekeeping control genes.
Functional clustering
To analyze the microarray data in the context of biological functions, we used information available from the Gene Ontology (GO) consortium (www.geneontology.org).16,17,64,65 The GO terms represent a defined vocabulary describing the biological process, cellular components, and molecular functions of genes in a hierarchical-directed acyclic graph structure. Statistical analysis was performed using GenMAPP software.16,17 For each of the existing GO terms the cumulative number of genes meeting our criteria (eg, up- or down-regulated) and of all genes represented on the microarray was calculated. The Z score is calculated for every GO term by subtracting the expected number of genes meeting the criterion from the actual number, and division of this value by the standard deviation of the actual number of genes:
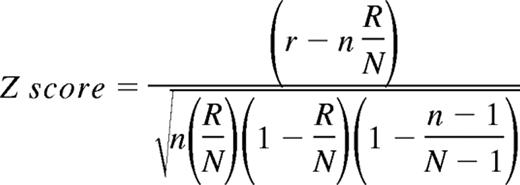
with N as the total number of genes measured, R as the total number of genes meeting the criterion, n as the total number of genes in the specific GO term, and r as the number of genes meeting the criterion in the specific GO term. A positive Z score indicates that there are more genes meeting the criterion in the specific GO term than expected by chance. The Z score is transferred to P values under the assumption of a hypergeometric distribution.
Because only a small percentage of information available in literature is annotated in the GO classification, we additionally performed a detailed literature search for regulated genes and created a spreadsheet with gene to biological function relations. When 3 or more genes were functionally related, we developed a search string describing this function and used it to search the NCBI Gene database which contains functional information as short peer-reviewed synopses. The quality of the search string was tested by its ability to identify correct records among a set of 100 arbitrary control genes and then applied to regulated genes and to all genes measured by microarray analysis. The frequency of records matching the search string was calculated, and statistical testing using the χ-square test was performed.
Measurement of cell apoptosis
Apoptosis was induced by treatment of monocytes with 200 nM staurosporine (STS; Alexis, San Diego, CA) for 6 hours. Apoptosis was visualized by staining with annexin V–FITC and Nicoletti assay as described previously.18,19
Cellular production of reactive oxygen species (ROS) during apoptosis, especially H2O2, was analyzed using oxidation-specific fluorescent probe dihydrorhodamine 123 (DHR123; Molecular Probes via MoBiTec, Goettingen, Germany) as described elsewhere.20 Briefly, untreated and STS-treated cells were cultured for indicated time periods at 37°C. Fifteen minutes before staining DHR123 (10 μM) was added to the culture. After washing in PBS cells were analyzed by flow cytometry.
Fluorimetric measurement of intracellular glutathione levels was performed using glutathione detection kit (Chemicon International, Temecula, CA) according to the manufacturer's instruction. Cells (5 × 10⁶) were cultured for the indicated time periods in the presence of STS or were left untreated. At different time points cells were harvested and stored at −80°C until use.
Analysis of phagocytosis, migration, adherence, and oxidative burst
For detection of phagocytic capacity, cells were incubated with 1:5 (cells/Leishmania) of CFDA (carboxyfluorescein-diacetate)–labeled Leishmania major parasites21 or 1:10 (cells/beads) of FITC (fluorescein-5-isothiocyanate)–labeled Latex beads (Molecular Probes via MoBiTec) for 4 hours. The rate of phagocytosis was determined by flow cytometry as described previously.21
For determination of cell adhesion, monocytes (1 × 10⁵) were stimulated with 10 nM fluticasone propionate for 24 hours or left untreated. Subsequently, cells were seeded into untreated plastic tissue culture dishes and incubated for 4 hours. Nonadhering cells were removed by washing, and the remaining cells were detached by incubation with 5 mM EDTA for 30 minutes at 37°C, washed, and counted using a cell counter (Beckmann Coulter, Fullerton, CA). The complete detachment of cells was controlled microscopically.
Monocyte migration assays in transwell plates were performed as described previously using fMLP or LTB4 (leukotriene B4) as chemoattractants.22 Cells were allowed to migrate for 4 hours.
To investigate the induction of oxidative burst, cells were incubated with or without PMA (phorbol myristate acetate, 50 nM) in addition to 10 nM fluticasone propionate. The extracellular chemiluminescence response was measured in the presence of isoluminol (50 μM) as described previously.23
Results
GC-regulated gene expression in human monocytes
Monocytes from individual donors were exposed to 10 nM fluticasone propionate for 16 hours or left untreated in 4 independent sets of experiments to analyze changes in gene expression patterns induced by GCs. Efficiency of GC stimulation was confirmed by flow cytometry for CD163, a previously described marker for GC-treated human monocytes.24 Using high-density microarrays with more than 22 000 oligonucleotide sets, the expression levels of at least 13 000 independent transcripts were obtained. We filtered the expression data by strict statistical criteria and found that 102 genes were significantly up-regulated, whereas 45 were down-regulated (Tables 1and 2 and Tables S1 and S2, which are available on the Blood website; see the Supplemental Tables link at the top of the online article).
Genes up-regulated by GC treatment
| Gene symbol | Description (NCBI gene) | N-fold | P |
|---|---|---|---|
| Antioxidative | |||
| SLC1A3 | Solute carrier family 1 (glial high-affinity glutamate transporter), member 3 | 6.8† | <.001 |
| SESN1* | Sestrin 1 | 4.9 | .002 |
| ADORA3* | Adenosine A3 receptor | 4.3 | .009 |
| GCLC | Glutamate-cysteine ligase, catalytic subunit | 2.6 | .012 |
| GLO1 | Glyoxalase I | 2.3 | .026 |
| AKR1B1* | Aldo-keto reductase family 1, member B1 (aldose reductase) | 2.3 | .026 |
| Migration/chemotaxis | |||
| FPR1 | Formyl peptide receptor 1 | 3.0 | .004 |
| KIAA0551 | Traf2 and NCK interacting kinase | 2.9 | .024 |
| AQP9 | Aquaporin-9 | 2.5† | .012 |
| MTSS1 | Metastasis suppressor 1 | 2.4 | <.001 |
| Phagocytosis | |||
| MERTK | c-mer proto-oncogene tyrosine kinase | 4.9 | .004 |
| FLJ10462 | Hypothetical protein FLJ10462 (WIPI49) | 4.5† | .003 |
| MFGE8 | Milk fat globule-EGF factor 8 protein | 4.0† | .008 |
| C1QA | Complement component 1, q subcomponent, alpha polypeptide | 2.5 | .012 |
| MRC1 | Mannose receptor, C type 1 | 2.4 | .027 |
| FGR | Gardner-Rasheed feline sarcoma viral (v-fgr) oncogene homolog | 2.3 | .039 |
| Genes with known anti-inflammatory functions | |||
| CD1D* | CD1D antigen, d polypeptide | 2.7 | .001 |
| LILRB1* | Leukocyte immunoglobulin-like receptor, subfamily B (with TM and ITIM domains), member 1 | 2.3 | .046 |
| IL1R2* | Interleukin 1 receptor, type II | 28.4† | .009 |
| CD163* | CD163 antigen | 4.5 | .001 |
| DSIPI* | Delta sleep inducing peptide, immunoreactor | 4.1† | .009 |
| FCAR* | Fc fragment of IgA, receptor for | 3.4† | .012 |
| IL10* | Interleukin 10 | 2.3 | .019 |
Genes with known anti-inflammatory functions.
Facultative value, the signal in control cells was below the detection limit (detection P < .05; Affymetrix MAS 5.1).
Genes down-regulated by GC treatment
| Gene symbol | Description (NCBI Gene) | N-fold | P |
|---|---|---|---|
| T-cell chemotaxis | |||
| CXCL11* | Chemokine (C-X-C motif) ligand 11 | −4.9 | .017 |
| CXCL10* | Chemokine (C-X-C motif) ligand 10 | −3.3 | .017 |
| CCL5 | Chemokine (C-C motif) ligand 5 | −2.5 | .016 |
| CXCL9* | Chemokine (C-X-C motif) ligand 9 | −2.0 | .030 |
| Adhesion | |||
| FCN1 | Ficolin (collagen/fibrinogen domain containing) 1 | −2.5 | .021 |
| ITGAL | Integrin, alpha L (antigen CD11A (p180), lymphocyte function-associated antigen 1; alpha polypeptide) | −2.5 | .029 |
| CD36 | CD36 antigen (collagen type I receptor, thrombospondin receptor) | −2.2 | .017 |
| LST1* | Leukocyte specific transcript 1 | −2.0 | .009 |
| OLR1 | Oxidized low density lipoprotein (lectin-like) receptor 1 | −2.0 | .017 |
| Apoptosis | |||
| STAT1* | Signal transducer and activator of transcription 1, 91 kDa | −3.4 | .023 |
| DNASE1L3 | Deoxyribonuclease I-like 3 | −2.6 | .019 |
| TNFSF10 | Tumor necrosis factor (ligand) superfamily, member 10 | −2.2 | .038 |
| PEA15 | Phosphoprotein enriched in astrocytes 15 (antiapoptosis) | −2.1 | .005 |
| CST7 | Cystatin F (leukocystatin) | −2.1† | .029 |
| Oxidative functions | |||
| PTGS1 | Prostaglandin-endoperoxide synthase 1 (prostaglandin G/H synthase and cyclooxygenase) | −2.9 | .006 |
| SCO2 | SCO cytochrome oxidase deficient homolog 2 (yeast) | −2.4 | .018 |
| CYBB | Cytochrome b-245, beta polypeptide (chronic granulomatous disease), component NAPDH oxidase | −2.0 | .023 |
| Genes up-regulated by IFNγ | |||
| GBP1* | Guanylate binding protein 1, interferon-inducible, 67 kDa | −2.6 | .012 |
| IFITM1* | Interferon induced transmembrane protein 1 (9–27) | −2.1 | .040 |
| WARS* | Tryptophanyl-tRNA synthetase | −2.1 | .017 |
Genes up-regulated by IFNγ.
Facultative value, the signal in GC-treated cells was below the detection limit (detection P < .05, Affymetrix MAS 5.1).
Induction of 7 (C1QA, DSIPI, MRC1, THBS1, IL10, IL1R2, CD163) and inhibition of another 7 (FCERI, CXCL11, CCL5, CXCL, STAT1, CYBB, CD36) genes by GC in monocytes or closely related cell types has been described previously. Thus, we verified regulation of important GC target genes in naive monocytes, including those analyzed in most detail, such as CD163 and IL10.24,25 However, the majority of genes identified here (101) have not been associated with response to GCs in monocytes or other cell types so far.
Validation of microarray data by real-time RT-PCR and flow cytometry
By using quantitative real-time RT-PCR, we confirmed the expression patterns obtained by microarray analysis for 12 selected genes (Figure 1).Because of our strict statistical criteria for evaluation of microarray data, we achieved a high rate of verification (12 of 12) even for genes with a relatively low regulation between 2.0- and 3.0-fold (6 of 6 genes).

Real-time PCR verification of microarray data. The PCR data were normalized to the mean of 3 housekeeping genes: glyceraldehyde-3-phosphat dehydrogenase (GAPDH), ribosomal protein L13a (RPL), β2-microglobulin (B2M). Subsequently, the relative N-fold regulation and SEM compared with unstimulated monocytes (n = 3) was calculated (▒) and compared with the results obtained from the microarray analysis (n = 4) (▪). The genes analyzed were interleukin-1 receptor type II (IL1-R2), the immunoglobulin domain containing protein Z39Ig; sin3A-associated protein (SAP30); formyl peptide receptor 1 (FPR); high mobility group box 2 (HMGB2); lymphotoxin beta (LtB); the chemokine receptor CX3CR1; the chemokines CXCL10, CXCL9, and CCL5; the cell-surface protein CD36; and the interleukin 21 receptor (IL21R). Shown are the mean and standard error of the mean (SEM) of 4 individual experiments.
Real-time PCR verification of microarray data. The PCR data were normalized to the mean of 3 housekeeping genes: glyceraldehyde-3-phosphat dehydrogenase (GAPDH), ribosomal protein L13a (RPL), β2-microglobulin (B2M). Subsequently, the relative N-fold regulation and SEM compared with unstimulated monocytes (n = 3) was calculated (▒) and compared with the results obtained from the microarray analysis (n = 4) (▪). The genes analyzed were interleukin-1 receptor type II (IL1-R2), the immunoglobulin domain containing protein Z39Ig; sin3A-associated protein (SAP30); formyl peptide receptor 1 (FPR); high mobility group box 2 (HMGB2); lymphotoxin beta (LtB); the chemokine receptor CX3CR1; the chemokines CXCL10, CXCL9, and CCL5; the cell-surface protein CD36; and the interleukin 21 receptor (IL21R). Shown are the mean and standard error of the mean (SEM) of 4 individual experiments.
Next, we determined changes in expression at the protein level by flow cytometry for 4 selected genes. In agreement with the RNA data, CD163 was strongly up-regulated, whereas CD36 and CD11a were down-regulated. As an example for an intracellular molecule we confirmed expression of SAP30 by intracellular flow cytometry (Figure 2).

Confirmation of GC-regulated gene expression in monocytes by flow cytometry. Expression of selected genes found to be differentially expressed by microarray analysis was confirmed by flow cytometry. Monocytes were treated with 10 nM fluticasone for 16 hours or left untreated and were tested afterward for expression of the cell-surface molecules CD163, CD11a, and CD36 or for intracellular expression of sin3A-associated protein (SAP30). Specific profiles are shown by thick lines and isotype controls appear as spotted lines. Numbers show the quotient of specific/isotype control mean fluorescence intensity (MFI). The experiment was done 4 times with similar results, and the differences in MFI shifts between control and GC-treated cells were statistically significant for every protein analyzed (P < .05, Student t test, for CD11a, CD36, and SAP; P < .001 for CD163).
Confirmation of GC-regulated gene expression in monocytes by flow cytometry. Expression of selected genes found to be differentially expressed by microarray analysis was confirmed by flow cytometry. Monocytes were treated with 10 nM fluticasone for 16 hours or left untreated and were tested afterward for expression of the cell-surface molecules CD163, CD11a, and CD36 or for intracellular expression of sin3A-associated protein (SAP30). Specific profiles are shown by thick lines and isotype controls appear as spotted lines. Numbers show the quotient of specific/isotype control mean fluorescence intensity (MFI). The experiment was done 4 times with similar results, and the differences in MFI shifts between control and GC-treated cells were statistically significant for every protein analyzed (P < .05, Student t test, for CD11a, CD36, and SAP; P < .001 for CD163).
In silico functional analysis of regulated genes
To determine which functional clusters are overrepresented among regulated genes with a given statistical significance, we performed an automated unbiased functional clustering using GENMAPP software16 (Table 3)
Functional gene clusters overrepresented
| Z score | P | % of selection | % of all | |
|---|---|---|---|---|
| Functional gene clusters overrepresented among up-regulated genes | ||||
| Molecular function | ||||
| Receptor activity | 2.91 | .013 | 19.5 | 10.2 |
| Interleukin-1 receptor activity | 11.76 | <.001 | 3.4 | 0.1 |
| Biological process | ||||
| Immune response | 5.71 | <.001 | 20.7 | 6.1 |
| Innate immune response | 5.42 | <.001 | 9.2 | 1.7 |
| Chemotaxis | 2.48 | .04 | 3.4 | 0.9 |
| Cell communication | 2.39 | .015 | 35.6 | 24.6 |
| Intracellular signaling cascade | 2.41 | .018 | 13.8 | 7.2 |
| MAPKKK cascade | 3.99 | .006 | 3.4 | 0.5 |
| G-protein signaling, coupled to cAMP nucleotide second messenger | 3.59 | .009 | 3.4 | 0.6 |
| Negative regulation of cell proliferation | 2.95 | .016 | 4.6 | 1.2 |
| Cell activation | 3.22 | .03 | 3.4 | 0.7 |
| Lymphocyte activation | 3.64 | .017 | 3.4 | 0.6 |
| Cell motility | 2.29 | .026 | 6.9 | 2.8 |
| Anti-inflammation/immunosuppression * | 7.28 | <.001 | 6.7 | 0.74 |
| Phagocytosis* | 5.21 | <.001 | 5 | 0.69 |
| Functional gene clusters overrepresented among down-regulated genes | ||||
| Molecular function | ||||
| Receptor activity | 2.42 | .022 | 21.4 | 10.2 |
| Chemokine activity | 11.63 | <.001 | 11.9 | 0.4 |
| Biological process | ||||
| Immune response | 11.27 | <.001 | 47.6 | 6.1 |
| Humoral immune response | 3.02 | .031 | 7.1 | 1.5 |
| Innate immune response | 7.51 | <.001 | 16.7 | 1.7 |
| Negative regulation of cell proliferation | 3.57 | .013 | 7.1 | 1.2 |
| Cell communication | 2.75 | .011 | 42.9 | 24.6 |
| Cell-cell signaling | 3.63 | .005 | 16.7 | 4.8 |
| Cell adhesion | 2.88 | .011 | 14.3 | 4.8 |
| Signal transduction | 2.66 | .014 | 35.7 | 19.5 |
| Apoptosis | 2.98 | .015 | 11.9 | 3.5 |
| Cell motility | 2.61 | .034 | 9.5 | 2.8 |
| Oxidative* | 3.18 | .004 | 13.3 | 4.0 |
| IFNγ induced* | 13.04 | <.001 | 15.5 | 0.6 |
| Phagocytosis* | 4.87 | <.001 | 6.7 | 0.69 |
Additional functional clusters identified by literature database search.
There was a significant down-regulation of genes involved in the immune response, cell communication, cell activation, cell motility, cell adhesion, and cell death. The most affected molecular function was chemokine activity.
In general, the pattern was similar for up-regulated genes; however, the overrepresentation of genes associated with immune response or cell communication was less impressive, and the topics cell death and cell adhesion were not significantly overrepresented.
In addition to the GO nomenclature, we also identified functional clusters among regulated genes by detailed research of published literature by analyzing the occurrence of subject headings related to the functional cluster in the gene-centric functional database NCBI Gene.
We identified 3 additional clusters (interferon induced, phagocytosis, and oxidative or antioxidative) which were significantly more frequent in the NCBI Gene records of down-regulated genes and 2 clusters (immunosuppressive or anti-inflammatory and phagocytosis) which were more overrepresented in the records of up-regulated genes (Table 3).
Functional analysis of GC-treated monocytes
To test whether GC-induced functions identified in silico were really influenced at the functional level, we analyzed the effect of GC treatment of monocytes on adherence, cell mobility, chemotaxis, phagocytosis, oxidative burst, and apoptosis.
Adherence to plastic surfaces.
As predicted by statistical analysis, adherence of GC-treated monocytes to plastic surfaces was reduced compared with control cells (Figure 3A).Microscopy analysis revealed that GC-treated monocytes showed almost no cell spreading and remained spherical and only weakly attached to the surface (J.E., L.S., J.R., unpublished data, August 2004).

GC-treated cells show weaker adhesion as well as increased migratory and chemotactic activity. (A) Monocytes were treated with 10 nM fluticasone (GC) or left untreated (CO) for 2 days in Teflon bags and subsequently allowed to adhere to multiwell plates for 2 hours. After removing nonadherent cells by washing, remaining adherent cells were detached with EDTA and counted in a cell counter. The complete detachment of adherent cells was confirmed microscopically. The bars represent mean and SEM of 3 independent experiments. The decrease in adherence was statistically significant (*P < .05). (B) Expression of formyl peptide receptor (FPR), which was found to be differentially expressed by microarray analysis, was confirmed by flow cytometry. Monocytes were treated as described in panel A. Specific profiles of FPR expression are shown by thick lines, and isotype controls appear as spotted lines. Numbers indicate the quotient of specific/isotype control MFI and percentage of positive cells, respectively. The experiment was done 3 times with similar results. The increase in MFI was calculated to be statistically significant (P < .05, Student t test). (C) Monocytes were treated as described in panel A and placed into the upper chamber of a transwell filter. The lower chamber contained monocyte medium without or with increasing concentrations of fMLP as chemotactic stimulus. After 4 hours the number of cells which had migrated into the lower compartment was counted. The bars represent mean and SEM of 3 independent experiments. The increase in chemotactic activity was statistically significant (*P < .05, **P < .01). (D) Monocytes were treated as described in panel A and placed into the upper chamber of a transwell filter. The lower chamber contained monocyte medium with the addition of 10 nM fMLP, 100 nM LTB4, or no attractants but 10 nM fMLP in the upper chamber. After 4 hours cells that had migrated into the lower compartment were counted, and numbers are presented as the percentage of cells which migrated in the absence of any chemotactic stimulus. The bars represent mean and SEM of 3 independent experiments. The increase in chemotactic activity was calculated to be statistically significant (**P < .01).
GC-treated cells show weaker adhesion as well as increased migratory and chemotactic activity. (A) Monocytes were treated with 10 nM fluticasone (GC) or left untreated (CO) for 2 days in Teflon bags and subsequently allowed to adhere to multiwell plates for 2 hours. After removing nonadherent cells by washing, remaining adherent cells were detached with EDTA and counted in a cell counter. The complete detachment of adherent cells was confirmed microscopically. The bars represent mean and SEM of 3 independent experiments. The decrease in adherence was statistically significant (*P < .05). (B) Expression of formyl peptide receptor (FPR), which was found to be differentially expressed by microarray analysis, was confirmed by flow cytometry. Monocytes were treated as described in panel A. Specific profiles of FPR expression are shown by thick lines, and isotype controls appear as spotted lines. Numbers indicate the quotient of specific/isotype control MFI and percentage of positive cells, respectively. The experiment was done 3 times with similar results. The increase in MFI was calculated to be statistically significant (P < .05, Student t test). (C) Monocytes were treated as described in panel A and placed into the upper chamber of a transwell filter. The lower chamber contained monocyte medium without or with increasing concentrations of fMLP as chemotactic stimulus. After 4 hours the number of cells which had migrated into the lower compartment was counted. The bars represent mean and SEM of 3 independent experiments. The increase in chemotactic activity was statistically significant (*P < .05, **P < .01). (D) Monocytes were treated as described in panel A and placed into the upper chamber of a transwell filter. The lower chamber contained monocyte medium with the addition of 10 nM fMLP, 100 nM LTB4, or no attractants but 10 nM fMLP in the upper chamber. After 4 hours cells that had migrated into the lower compartment were counted, and numbers are presented as the percentage of cells which migrated in the absence of any chemotactic stimulus. The bars represent mean and SEM of 3 independent experiments. The increase in chemotactic activity was calculated to be statistically significant (**P < .01).
Migration and chemotaxis.
Microarray analysis and real-time PCR revealed up-regulation of formyl peptide receptor (FPR), the receptor for the potent chemoattractant fMLP by GC treatment. We confirmed up-regulation of FPR protein by flow cytometry (Figure 3B). We next tested whether GC treatment would affect migration and chemotaxis of monocytes in general and also specifically in response to fMLP. By using a modified Boyden chamber assay, we detected that spontaneous migration of GC-treated monocytes as well as migration toward fMLP were significantly enhanced after 4 hours (Figure 3C). The effect of fMLP was dose dependent with optimal concentrations of fMLP between 2 and 10 nM (Figure 3C). It was also specific as confirmed by the addition of 10 nM fMLP to the upper compartment of the Boyden chamber (Figure 3D). The GC-induced increase in chemotaxis was dependent on the stimulus. As such we did not observe increased migration of GC-treated cells toward LTB4 (Figure 3D).
Phagocytosis of latex beads and L major.
An association with the subject heading phagocytosis was found with both groups of up- and down-regulated genes. However, the association was stronger for up-regulated genes. We therefore tested phagocytosis of latex beads and immunophagocytosis of complement opsonized living L major parasites after treatment of monocytes with GC. We detected an approximately 2.5-fold increase in phagocytosis of latex beads by GC-treated cells (Figure 4A).Phagocytosis of L major promastigotes was also significantly enhanced (1.8-fold) in GC-treated cells compared with controls (Figure 4B).

GC-treated cells show increased phagocytotic activity and decreased oxidative burst. (A-B) Monocytes were incubated with medium as control (Co) or with 10 nM fluticasone (GC) for 2 days in inert Teflon bags, and 1 × 10⁶ cells were plated into multiwell plates and incubated with 1 × 10⁷ FITC-labeled latex beads (A) or 5 × 10⁶ opsonized and CFDA-labeld L major parasites (B) for 4 hours. The cells were harvested and subjected to flow cytometry. Uptake of labeled particles or parasites resulted in an increased mean fluorescence intensity (MFI shift) compared with cells without the addition of beads or L major. Shown are the mean MFI shifts (and SEM) of 3 independent experiments.(*P < .05, **P < .01, Student t test). (C) Monocytes were treated as described above and 1 × 10⁴ cells/200 μL was transferred to multiwell plates. Isoluminol was added to the cultures, and the oxidative burst was initiated by the addition of 10 nM PMA (t = 0 minutes). Isoluminol chemiluminescence (light units, y-axis) was measured in PMA-treated and control cells every 2 minutes after the induction of oxidative burst (x-axis) both for GC-treated (GC) and control cells (Co). Shown are the mean and SEM of quadruplets (*P < .05, **P < .01, Student t test) of 1 of 3 independent experiments with essentially similar results.
GC-treated cells show increased phagocytotic activity and decreased oxidative burst. (A-B) Monocytes were incubated with medium as control (Co) or with 10 nM fluticasone (GC) for 2 days in inert Teflon bags, and 1 × 10⁶ cells were plated into multiwell plates and incubated with 1 × 10⁷ FITC-labeled latex beads (A) or 5 × 10⁶ opsonized and CFDA-labeld L major parasites (B) for 4 hours. The cells were harvested and subjected to flow cytometry. Uptake of labeled particles or parasites resulted in an increased mean fluorescence intensity (MFI shift) compared with cells without the addition of beads or L major. Shown are the mean MFI shifts (and SEM) of 3 independent experiments.(*P < .05, **P < .01, Student t test). (C) Monocytes were treated as described above and 1 × 10⁴ cells/200 μL was transferred to multiwell plates. Isoluminol was added to the cultures, and the oxidative burst was initiated by the addition of 10 nM PMA (t = 0 minutes). Isoluminol chemiluminescence (light units, y-axis) was measured in PMA-treated and control cells every 2 minutes after the induction of oxidative burst (x-axis) both for GC-treated (GC) and control cells (Co). Shown are the mean and SEM of quadruplets (*P < .05, **P < .01, Student t test) of 1 of 3 independent experiments with essentially similar results.
Production of ROS.
Genes involved in oxidative functions were significantly overrepresented among GC down-regulated genes. In addition, 6 of the up-regulated genes were recently described as having antioxidative functions. In agreement with microarray data, spontaneous as well as PMA-induced production of reactive oxygen species was significantly reduced in GC-treated cells (Figure 4C).
Apoptosis.
For evaluation of the influence of GC on programmed cell death, we measured annexin V staining as an early marker for apoptosis as well as fragmentation of nuclei by Nicoletti assay19 as a marker for later stages of apoptosis. GC treatment did not result in spontaneous apoptosis of monocytes (Figure 5A-B).Instead, GC-treated monocytes were significantly protected from staurosporine-induced apoptosis as deduced from our functional clustering approach (Figure 5A-B). Because oxidative stress is a well-known factor involved in apoptosis, we subsequently analyzed intracellular concentration of reactive oxygen species (ROS) during staurosporine-induced apoptosis (Figure 5C). Although we detected rapid production of reactive oxygen species in control cells after induction of apoptosis with staurosporine, we found almost no activity of ROS in GC-treated cells, consistent with inhibition of staurosporine-induced apoptosis (Figure 4). Our gene expression data indicate an elevated capacity of glutathione synthesis in monocytes after GC treatment. We therefore measured changes in intracellular glutathione levels during staurosporine-induced apoptosis. In fact, the reduction of intracellular glutathione during staurosporine-induced apoptosis was significantly diminished in GC-treated cells (Figure 5D).

GC-treated monocytes are protected from apoptosis. Monocytes were treated with 10 nM fluticasone (GC) for 2 days or left untreated (Co) and subsequently challenged with 200 nM staurosporine (STS). (A) After 6 hours of STS treatment we stained for annexin V to detect one of the earliest features of apoptosis, externalization of phosphatidylserine. The proportion of annexin V–positive cells in the population of untreated (□) and STS-treated cells (▪) is shown. The bars represent mean and SEM from 5 independent experiments (**P < .01, Student t test). (B) The proportion of nuclei containing hypodiploid DNA was assessed by the Nicoletti assay after 6 hours of culture without (□) or with (▪) STS. Mean values and SEM from 5 independent experiments are shown (**P < .01, Student t test). (C) To measure changes in intracellular H2O2, control monocytes (□) and GC-treated monocytes (▪), which were treated with STS for the indicated time periods, were labeled for 15 minutes with DHR123. After washing in PBS, fluorescence was measured immediately by flow cytometry. Data are presented as an N-fold increase in fluorescence intensity between unstimulated and STS-simulated cells defined by MFI with STS stimulation/MFI without STS stimulation. Data are shown as the mean and SEM from 3 independent experiments (*P < .05, Student t test). (D) Changes in the level of intracellular glutathione during STS-induced apoptosis were measured at different time points in lysates from untreated (□) and STS-treated (▪) cells fluorimetrically using monochlorobimane. Data are expressed as the percentage of glutathione levels in untreated cells (indicated as 100%). Data are the mean and SEM from 3 independent experiments (*P < .05, Student t test).
GC-treated monocytes are protected from apoptosis. Monocytes were treated with 10 nM fluticasone (GC) for 2 days or left untreated (Co) and subsequently challenged with 200 nM staurosporine (STS). (A) After 6 hours of STS treatment we stained for annexin V to detect one of the earliest features of apoptosis, externalization of phosphatidylserine. The proportion of annexin V–positive cells in the population of untreated (□) and STS-treated cells (▪) is shown. The bars represent mean and SEM from 5 independent experiments (**P < .01, Student t test). (B) The proportion of nuclei containing hypodiploid DNA was assessed by the Nicoletti assay after 6 hours of culture without (□) or with (▪) STS. Mean values and SEM from 5 independent experiments are shown (**P < .01, Student t test). (C) To measure changes in intracellular H2O2, control monocytes (□) and GC-treated monocytes (▪), which were treated with STS for the indicated time periods, were labeled for 15 minutes with DHR123. After washing in PBS, fluorescence was measured immediately by flow cytometry. Data are presented as an N-fold increase in fluorescence intensity between unstimulated and STS-simulated cells defined by MFI with STS stimulation/MFI without STS stimulation. Data are shown as the mean and SEM from 3 independent experiments (*P < .05, Student t test). (D) Changes in the level of intracellular glutathione during STS-induced apoptosis were measured at different time points in lysates from untreated (□) and STS-treated (▪) cells fluorimetrically using monochlorobimane. Data are expressed as the percentage of glutathione levels in untreated cells (indicated as 100%). Data are the mean and SEM from 3 independent experiments (*P < .05, Student t test).
Discussion
Despite clinical use during more than 50 years, the specific anti-inflammatory effects of GC on different cellular compartments of the immune system are not yet clear. During recent years development of microarray technology has provided a powerful tool to define gene expression patterns on a genomewide scale within specific cell populations. Regarding GC effects on immune cells, there are only a few studies addressing this issue, and no publication deals with cells of the innate immune system. Monocytes and macrophages are important cells of the innate immune system, exhibiting complex properties with enhancing as well as suppressive effects on inflammatory processes depending on their stage of differentiation and activation.5,6,26
In the present study we used microarray technology to define the GC-induced expression profile in monocytes. The validity of such an approach crucially depends on the use of strict statistical criteria for the definition of regulated genes and thus on sufficient technical and biological replicates. Technical replication was ensured by using Affymetrix U133Av2 oligonucleotide microarrays whereby each gene is represented by multiple perfect matched and mismatched oligonucleotides. To get reliable data about biological variation, we used monocytes from 4 individual donors and avoided pooling of experimental samples. The validity of our strict statistical criteria is confirmed by the fact that the regulation of all of 12 selected genes, including 6 genes regulated in the range from 2- to 3-fold, was verified by real-time PCR in 3 more independent experiments. For all selected genes we were also able to show corresponding changes at the protein level.
Genes known to be up-regulated by interferon-γ (IFNγ) were strongly overrepresented among GC down-regulated genes. Although some of these genes such as CXCL11 and CXCL10 are known to be regulated by GC,27,28 others such as the activator of the proteasome subunit 2 (PSME2) have not been previously described as GC regulated. GCs are known to inhibit antigen processing and presentation; the proteasome, however, is a new target of GC-mediated suppression.
Furthermore, we confirmed up-regulation of anti-inflammatory IL-10.25,29 Other molecules with anti-inflammatory functions known to be regulated by GCs were CD163, DSIP, and IL-1RII. CD163 was characterized as a GC-inducible scavenger receptor on human monocytes which is involved in clearance of proinflammatory hemoglubin-haptoglobin complexes.30 GC-induced leucin zipper (DSIP) prevents NF-κB activation.31 The soluble decoy receptor for IL-1, IL-1RII, inactivates IL-1 signals.32 Surprisingly, we did not detect regulation of annexin-133 in GC-treated monocytes, which is a molecule with well-known anti-inflammatory properties. Its expression has previously been shown to be induced very rapidly by GCs in human monocytes.34 Thus, its early induction may not fall within the time frame of GC-induced effects chosen for our microarray analysis.
The induction of other anti-inflammatory molecules such as FPR, CD1d, and LILRB1 by GC has not been described before. Beside its role in chemotaxis ligation of the fMLP receptor, FPR inhibits LPS-induced secretion of TNFα and IL-12 by monocytes.35,36 Thus, up-regulation of FPR is a new mechanism by which GCs suppress cytokine secretion of monocytes in response to bacterial stimuli. CD1d is an atypical MHCI molecule which is important for presentation of lipid antigens and stimulates inhibitory NK and invariant T cells. CD1d deficiency results in deterioration of autoimmune disease.37 LILRB1, an immunoglobulin-like receptor, is also involved in MHCI-mediated immunosuppression.38
Beside these anti-inflammatory effects, in silico analysis of genes affected by GC treatment indicated induction of specific effector functions in monocytes rather than a general suppression of inflammatory activities. We now show for the first time that GCs modulate important cellular functions such as apoptosis, adherence, cellular motility, and chemotaxis, as well as phagocytosis and reactive oxygen metabolism in monocytes.
Genes involved in cell death or apoptosis were significantly down-regulated. Among these genes were potent proapoptotic factors such as TNF-related apoptosis-inducing ligand (TRAIL), which is involved in receptor-mediated induction of apoptosis,39 and important mediators of apoptosis such as DNase. Consistently, we observed a significant reduction of staurosporine-induced apoptosis in GC-treated monocytes. Effects of GCs on staurosporine-induced apoptosis have not been described so far. Staurosporine-induced cell death is mediated by reactive oxygen species. Molecules with antioxidative functions, especially genes involved in glutathione metabolism, are up-regulated in GC-treated monocytes (see below). This fact may contribute to the observed antiapoptotic effect of GC treatment. In agreement with a role of antioxidative molecules in the GC-mediated protection from apoptosis, we observed almost no reactive oxygen species during staurosporine-induced apoptosis after GC treatment. This effect is at least partly due to the fact that GC-treated monocytes have a higher capacity to replenish loss of intracellular glutathione during staurosporine-induced apoptosis which parallels an up-regulation of key molecules in the pathway of glutathione synthesis (see below) identified in our microarray analysis.
Proapoptotic stimuli are also present in an inflammatory environment. The observed protection of GC-treated monocytes from apoptosis is in agreement with a long-lasting regulatory role of this monocyte subtype in resolution or inhibition of inflammation.
Cell-surface molecules involved in cell adhesion, such as CD11a, CD36, ficolin,40 ORL1,41 Z39Ig,42 and LST1,43 were significantly overrepresented among down-regulated genes. The down-regulation of CD36 by GC has been described earlier.44 An influence of GC treatment on the morphology of human macrophages and a reduction of adhesion signaling complexes has been reported as well.45,46 We found a significant decrease in adhesion of monocytes to plastic surfaces. We also confirmed morphological differences as reported by Giles et al45 with reduced spreading and more rounded cells after GC treatment (J.E., L.S., J.R., unpublished data, August 2004).
Molecules involved in cell motility and chemotaxis were significantly overrepresented among up- and down-regulated genes. However, down-regulated molecules, including the chemokines CXCL9, CXCL10, CXCL11, CCL5, and CCL24, were predominantly involved in chemotaxis of T cells compatible with an anti-inflammatory effect of GCs. Up-regulated molecules, however, are directly involved in cell motility of monocytes such as Traf2 and NCK interacting kinase and metastasis suppressor 1.47,48 The coordinated up-regulation of FPR and aquaporin-9 is of special interest. The FPR mediates migration toward fMLP, a strong bacterial chemotactic agent.49 Aquaporin-9 regulates water influx, which is necessary for lamellipodium formation during migration. Aquaporin-9 selectively associates with FPR in migrating granulocytes.50 Accordingly, the specific, dose-dependent migration of monocytes toward fMLP was increased in GC-treated monocytes, whereas the response toward another chemotactic stimulus (LTB4) was unaffected. However, GC treatment did not only influence chemotaxis but also significantly increased undirected cell migration (chemokinesis) which is in agreement with our observation that several genes involved in general cell mobility were up-regulated.
It is therefore tempting to speculate that in vivo GCs not only induce production of immunosuppressive substances by monocytes but also simultaneously support an increased migration of anti-inflammatory monocytes to sites of inflammation or infection.
It has been previously published that GC-treated mature macrophages exhibit a stronger ability to engulf apoptotic cells.45,46 We found up-regulation of MFGE8, MERTK, and C1QA, which are known to be involved in phagocytosis of apoptotic cells. A GC-dependent regulation has only been described for C1QA so far.51-54 We now demonstrated that phagocytosis of latex beads, complement receptor–mediated endocytosis of opsonized L major parasites as well as phagocytosis of apoptotic granulocytes (K.B., unpublished data, October 2004) is strongly increased in GC-treated monocytes. Thus, GC-treated monocytes show an enhanced activity for removal of inflammation-inducing material.
It is well known that the generation of reactive oxygen species by macrophages is reduced after GC treatment. Accordingly, a spontaneous and PMA-induced oxidative burst of GC-treated monocytes was reduced in our experiments (Figure 4C). We could confirm down-regulation of CYBB (GP91-Phox) as described earlier.55 We now identified SCO2, a protein involved in assembly of cytochrome c oxidase,56 as a new target of GC action. Consistently, we also demonstrated up-regulation of molecules involved in antioxidative functions by GCs, especially in glutathione metabolism, which is shown here for the first time. Glutathione inactivates ROS and protects cells from oxidative stress. The rate-limiting enzyme of glutathione synthesis, glutamate-cysteine ligase, was up-regulated in our experiments in parallel with SLC1A3, the plasma membrane glutamate transporter.57 Increased glutathione synthesis may also be involved in protection from apoptosis (see above), because a reduction of cellular glutathione levels has been described as an early event in apoptosis.58,59 Other GC-induced molecules with antioxidative functions newly identified in this study were AKR1B1, an aldose reductase with anti-inflammatory functions,60 sestrin1 (SESN1), an enzyme which regenerates periredoxins and inhibits H2O2-induced cell damage,61 and adenosine A3 receptor (ADORA3), which is known to inhibit oxidative burst after ligand binding.62,63 Therefore GC-treated monocytes may be actively involved in neutralization of reactive metabolites and thus in the resolution of inflammation.
The more pronounced induction than repression of transcription by GCs and the enhancement of important physiological cell functions such as migration, chemotaxis, and phagocytosis strongly indicate that GCs do not simply suppress monocytic functions but rather induce a specific phenotype of monocytes with characteristic cellular activities. Despite expression of the scavenger receptor CD163 effects of GCs on gene expression by monocytes are completely distinct from those induced by the deactivating cytokine IL-10.29 There are some similarities between GC-induced monocytes and macrophages alternatively activated by IL-4 such as expression of CD36, CD163, IL-10, and IL-1RII. In contrast to alternatively activated macrophages, however, we did not detect up-regulation of antigen presenting or costimulatory molecules such as MHCII or CD80/86 after GC treatment.
Taken together, our gene expression analysis challenges the concept that the main molecular mechanism of GC-induced immunosuppression (at least in monocytes) is transrepression of gene transcription. In contrast, GC-activated monocytes show rather increased gene transcription, including many anti-inflammatory mediators. GCs promote survival of this anti-inflammatory phenotype which may specifically accumulate at sites of inflammatory processes because of higher migration to chemotactic stimuli. GC-treated monocytes are able to limit tissue damage because of antioxidative properties and high capacity for phagocytosis of proinflammatory stimuli (ie, microbial agents, particles, and cellular debris). Our data indicate that specific modulation of these monocytic effector mechanisms may offer novel targets for future anti-inflammatory strategies.
Authorship
Contribution: J.E. designed and performed the research and wrote the paper; L.S., K.B., K.T., and W.N. performed the research; M.E. analyzed the data; U.N. collected the data; C.S. designed the research; C.S. designed and performed the research; J.R. designed the research and wrote the paper.
Conflict-of-interest disclosure: The authors declare no competing financial interests.
Correspondence: Johannes Roth, Institute of Experimental Dermatology, University of Muenster, Roentgenstr. 21, D-48149 Muenster, Germany; rothj@uni-muenster.de.
The online version of this article contains a data supplement.
An Inside Blood analysis of this article appears at the front of this issue.
The publication costs of this article were defrayed in part by page charge payment. Therefore, and solely to indicate this fact, this article is hereby marked “advertisement” in accordance with 18 USC section 1734.
We thank H. Berheide, E. Nattkemper, and M. Saers for excellent technical assistance.
This work was supported by grants from the Interdisciplinary Centre for Clinical Research (project Ro2/012/06) of the University of Muenster and from the Deutsche Forschungsgemeinschaft (DFG SU 195/3-1).

This feature is available to Subscribers Only
Sign In or Create an Account Close Modal