Abstract
The erythroid response to acute anemia relies on the rapid expansion in the spleen of a specialized population of erythroid progenitors termed stress BFU-E. This expansion requires BMP4/Madh5-dependent signaling in vivo; however, in vitro, BMP4 alone cannot recapitulate the expansion of stress BFU-E observed in vivo, which suggests that other signals are required. In this report we show that mutation of the Kit receptor results in a severe defect in the expansion of stress BFU-E, indicating a role for the Kit/SCF signaling pathway in stress erythropoiesis. In vitro analysis showed that BMP4 and SCF are necessary for the expansion of stress BFU-E, but only when spleen cells were cultured in BMP4 + SCF at low-oxygen concentrations did we recapitulate the expansion of stress BFU-E observed in vivo. Culturing spleen cells in BMP4, SCF under hypoxic conditions resulted in the preferential expansion of erythroid progenitors characterized by the expression of Kit, CD71, and TER119. This expression pattern is also seen in stress erythroid progenitors isolated from patients with sickle cell anemia and patients with β-thalassemia. Taken together these data demonstrate that SCF and hypoxia synergize with BMP4 to promote the expansion and differentiation of stress BFU-E during the recovery from acute anemia.
Introduction
Acute anemia induces a systemic response that involves the induction of erythropoietin (Epo) expression in the kidney and the rapid mobilization and differentiation of erythroid progenitors. Previous work from our laboratory led to the development of a new model for the recovery from acute anemia where BMP4 expression in the spleen drives the expansion of a specialized population of stress erythroid progenitors, which we termed stress BFU-E.1 Our analysis of flexed-tail (f) mutant mice, which exhibit a defect in BMP4-dependent signaling, demonstrated that BMP4 is required for the recovery from acute anemia.1 BMP4 is required only transiently and acts on an earlier progenitor, the BMP4 responsive (BMP4R) cell, causing it to differentiate into a stress BFU-E. BMP4R cells are contained in the spleen megakaryocyte erythroid progenitor (MEP) population but are not observed in bone marrow MEPs. We define a stress BFU-E as a progenitor that rapidly forms a large burst colony in 5 days when cultured in media containing only Epo. If stress BFU-Es are cultured for 7 days as steady state bone marrow BFU-Es are, they produce significantly larger colonies.1
We showed that treatment of spleen cells with BMP4 in vitro resulted in the expansion of stress BFU-Es, which demonstrated that BMP4R cells are resident in the spleens of normal mice. However, culturing spleen cells in media containing BMP4 failed to recapitulate the 45-fold increase in stress BFU-Es observed in vivo during the recovery from acute anemia. This observation suggests that additional signals present in the spleen microenvironment were also required for the expansion of stress BFU-Es.
Stem cell factor (SCF) is known to play a key role in the development and expansion of erythroid progenitors.2–4 SCF is encoded by the murine Steel (Sl) locus5–7 and its receptor; Kit is encoded by the murine dominant white spotting (W) locus.8,9 Both of these strains exhibit a severe macrocytic anemia caused by a defect in the development of late erythroid progenitors, erythroid colony-forming units (CFU-Es).10 However, similar to the f/f mice, W and Sl mutant mice also exhibit a delayed recovery from PHZ-induced acute anemia,11,12 characterized by a delay in the expansion of erythroblasts in the spleen.12 In addition, SCF has been shown to greatly expand the progeny of BFU-Es cultured from human and murine fetal liver and bone marrow.13–15 Taken together, these data suggest that SCF/Kit signaling may play a role in the expansion of spleen stress BFU-Es, which express Kit on their surface.
Acute anemia also leads to tissue hypoxia, which may provide a potential second signal. Similar to SCF, hypoxia has been shown to increase the size and number of BFU-Es cultured from human bone marrow and cord blood and murine fetal liver and bone marrow.16–19 Hypoxia can affect a variety of cellular processes, including gene expression through the action of HIF, the hypoxia inducible transcription factor complex.20–22 HIF regulates the expression of Epo in the kidney during the recovery from acute anemia.23 We have shown that hypoxia induces BMP4 expression in spleen stromal cells and have identified a putative HIF-binding site in the 3′ end of the BMP4 gene.1 Hypoxia can also regulate the stability of proteins through the oxygen-dependent degradation of proteins.21,24 This process is mediated by a ubiquitin ligase complex that contains the von Hippel-Lindau (VHL) protein.21,25 Mutations in VHL are observed in patients with Chuvash polycythemia, which is characterized by high serum Epo concentrations and increased sensitivity of BFU-Es to Epo.26,27 These observations suggest that hypoxia may regulate the expression of key signaling molecules and could potentially alter the responses of erythroid progenitors to Epo.
Based on these data we propose that SCF and hypoxia work in concert with BMP4 to drive the expansion of stress BFU-Es in the spleen during the recovery from acute anemia. In this report, we show that W mutant mice exhibit a severe delay in the expansion of stress BFU-Es and they lack BMP4R cells in their spleens. In addition, we show that in vitro BMP4, SCF, and hypoxia are necessary and sufficient to recapitulate the magnitude of the expansion of stress BFU-E observed in vivo. Our data show that hypoxia alters the response of progenitor cells to BMP4 and SCF. In addition, we show that culturing spleen progenitors in BMP4, SCF at low-oxygen concentration results in the preferential expansion of erythroid progenitor cells that express Kit, CD71, and TER119. This cell-surface phenotype has been shown to expand in the spleen following PHZ-induced anemia.28 In addition, similar erythroid progenitor cells (Kit+CD71+Glycophorin A+ [GlyA+]) have been observed in the peripheral blood of patients with sickle cell anemia and patients with β-thalassemia. These data suggest a role for the BMP4-dependent stress erythropoiesis pathway in human stress erythropoiesis.
Materials and methods
Mice
WBB6F1/J, WBB6F1/J-W/WV, and C57BL/6J-WV/+ mice were obtained from Jackson Laboratory (Bar Harbor, ME). C57BL/6 mice were bred in our animal facility. All mice were approximately 6 to 8 weeks old; controls were age matched. Acute anemia was induced by injection of phenylhydrazine (PHZ) as previously described1 except that WBB6F1-W/Wv nice were given a 50% dose (50 mg/kg per mouse) of PHZ so that their anemia would be comparable to controls. All experiments were approved by the IACUC at the Pennsylvania State University.
Colony assays for BFU-E
Splenocytes and bone marrow cells were isolated from control, Wv/+, and W/Wv mice. Nucleated bone marrow cells (1 × 10⁵/mL) and nucleated splenocytes (2 × 10⁶/mL) were plated in methylcellulose media (StemCell Technologies, Vancouver, BC) containing 3 U/mL Epo. BFU-Es were scored as described after 5 days of incubation.1 For SCF and BMP4 preincubation experiments, splenocytes were harvested from C57BL/6 mice and incubated in IMDM + 5% FCS with and without 50 ng/mL SCF (US Biological, Swampscott, MA) and/or 15 ng/mL BMP4 (R&D Systems, Minneapolis, MN) for 24 hours. Cells were then washed twice, resuspended in IMDM + 5% FCS, and plated in Methocult (M3334; Stem Cell Technologies, Vancouver, BC) with and without 50 ng/mL SCF and/or 15 ng/mL BMP4. BFU-Es were scored as described.1
Hypoxia experiments
Splenocytes were cultured in methylcellulose media as described in “Colony assays for BFU-E” except that the plates were incubated at 2% O2 for the indicated times in a modular incubator chamber (Billups-Rothenberg, Del Mar, CA) as previously described.29
Analysis of BMP4 expression in the spleen
Total RNA was isolated from splenocytes, homogenized in TRIzol (Invitrogen, Carlsbad, CA), and reverse transcribed into cDNA. polymerase chain reaction (PCR) for BMP4 was performed using the primers 5′-CCTGGTAACCGAATGCTGAT-3′ and 5′-TTTATACGGTGGAAGCCCTG-3′.
Liquid culture of spleen cells and analysis of erythroid progenitors was by flow cytometry
Details of the cell culture conditions are provided in the Supplemental Materials (available on the Blood website; see the Supplemental Materials link at the top of the online article).
Data analysis
Mean differences between groups were examined by Student t test (2-tailed). Statistical significance was taken at values of *P less than.05, **P less than .01, and ***P less than .005. The regression analysis was calculated by Minitab software version 14 (Minitab, State College, PA).
Image acquisition and processing
BFU-E colonies were visualized by a Nikon Eclipse TE300 inverted microscope (Nikon, Melville, NY) equipped with 10×/0.25 NA dry, Plan Fluor ELWD 20×/0.45 NA dry, 40×/0.60 NA dry, and 60×/0.70 NA oil-immersion objective lenses (Nikon). Standard magnification was 40×/0.60 NA. Images were captured using an Optronics digital camera (Optronics, Goleta, CA) and MagnaFire 2.1C software, and were processed with Adobe Photoshop 8.0 software (Adobe Systems, San Jose, CA).
Results
W/Wv mice exhibit a severe delay in stress BFU-E expansion and lack BMP4-responsive cells
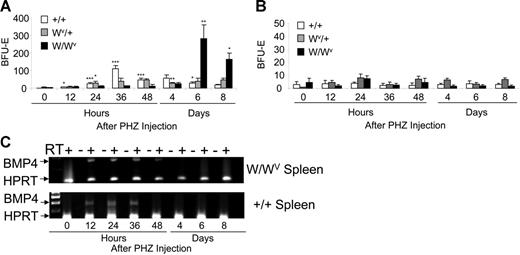
Early work showed that in addition to chronic anemia, W/Wv mice also exhibited a delayed recovery to acute erythroid stress.12 Previously, we showed that stress BFU-Es express Kit receptor on their surface, suggesting that Kit/SCF signaling may also play a role in their expansion and differentiation. To determine the role of the SCF/Kit signaling pathway in the stress BFU-E expansion in response to acute anemia, we used PHZ to induce acute anemia in W/Wv, Wv/+, and control mice. Bone marrow and spleen cells were isolated at different times during the recovery and plated in methylcellulose media containing only Epo to assay for stress BFU-Es (Figure 1A). Although control mice exhibit an expansion of stress BFU-Es at 36 hours after PHZ injection as previously reported,1 W/WV mice do not expand stress BFU-Es until day 6 after PHZ injection. However, once the stress progenitors in the W/Wv mice respond, the expansion of stress BFU-Es is 2 to 2.5 times greater than that seen in control mice. The delay in the expansion in W/WV mice is longer than that observed in f/f mice (6 days versus 4 days after PHZ injection for W/WV and f/f, respectively).1 Furthermore, these data show that untreated W/Wv mice do not exhibit increased numbers of stress BFU-Es, suggesting that, despite the severe chronic anemia of the W/Wv mice, stress BFU-Es in the spleen are not mobilized. Wv/+ mice exhibit an intermediate response. There is a modest expansion of stress BFU-Es beginning at 24 hours (P < .02) that continues through 48 hours after PHZ. The number of stress BFU-Es slightly decreases at day 4 (P < .01), but unlike control mice, where the levels continue to decrease on days 6 and 8, the Wv/+ mice maintain this level of stress BFU-Es for the rest of the recovery period (P > .10). In contrast to the spleen, the bone marrow does not exhibit any significant expansion in BFU-Es in response to PHZ (Figure 1B).
W/Wv mice exhibit a delayed expansion of stress BFU-Es in the spleen during the recovery from acute anemia. W/Wv, Wv/+, and control mice were treated with phenylhydrazine to induce acute anemia. (A) Spleen cells and (B) bone marrow cells were plated in methylcellulose media containing Epo (3 U/mL) at the indicated times after PHZ treatment, and the number of stress BFU-Es were measured. (A-B) *P < .05, **P < .01, ***P < .005 when one value was compared with the previous time point. Each time point represents the average of 3 mice each done in triplicate. (C) Reverse transcription–polymerase chain reaction (RT-PCR) analysis of BMP4 expression in the spleen of W/Wv and control mice. Error bars indicate standard deviation (SD).
W/Wv mice exhibit a delayed expansion of stress BFU-Es in the spleen during the recovery from acute anemia. W/Wv, Wv/+, and control mice were treated with phenylhydrazine to induce acute anemia. (A) Spleen cells and (B) bone marrow cells were plated in methylcellulose media containing Epo (3 U/mL) at the indicated times after PHZ treatment, and the number of stress BFU-Es were measured. (A-B) *P < .05, **P < .01, ***P < .005 when one value was compared with the previous time point. Each time point represents the average of 3 mice each done in triplicate. (C) Reverse transcription–polymerase chain reaction (RT-PCR) analysis of BMP4 expression in the spleen of W/Wv and control mice. Error bars indicate standard deviation (SD).
The expansion of stress BFU-E during the recovery from acute anemia requires the up-regulation of BMP4 expression in the spleen. Previously, we have shown that BMP4 expression is induced in the spleen at 12 hours after PHZ treatment, and the peak expression is observed at 24 hours.1 Delayed expression of BMP4 in W/Wv mice could explain the delay in the expansion of stress BFU-Es. However, when we analyzed the expression of BMP4 in the W/Wv mice, we observed that the timing and magnitude of the expression was not different from control animals (Figure 1C). These data support the idea that the defect in the W/Wv mice is a defect intrinsic to the progenitor cells. In addition, our data show that the chronic anemia of the W/Wv mice does not in itself induce the BMP4-dependent stress erythropoiesis pathway.
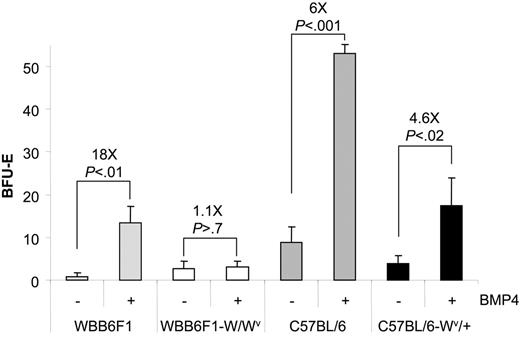
This defect in the recovery of W/Wv mice could be caused by the inability of progenitor cells to properly respond to SCF or a severe decrease in the number of progenitor cells. We addressed this question by culturing spleen cells from untreated mice in media containing BMP4, which results in the expansion of stress BFU-Es in vitro. Previously, we showed that BMP4 acts on an immature cell, the BMP4R cell, and induces it to differentiate into a stress BFU-E.1 The increase in the number of stress BFU-Es following BMP4 treatment measures the number of BMP4R cells in the spleen. The number of stress BFU-Es and the magnitude of the BMP4 response varies between inbred strains (J.M.P. and R.F.P., unpublished observations, October 2005), so we compared the ability of spleen cells from WBB6F1-W/Wv and its control WBB6F1 and C57BL/6-Wv/+ and its control C57BL/6 to respond to BMP4 and expand the number of stress BFU-Es (Figure 2). WBB6F1 control cells responded to BMP4 treatment and increased the number of stress BFU-Es approximately 18-fold. Conversely, W/Wv cells did not respond to BMP4, suggesting that they may lack BMP4R cells in their spleens. In contrast, the C57BL/6 control and C57BL/6-Wv/+ spleen cells both responded to BMP4; however, the C57BL/6-Wv/+ cells exhibited a smaller expansion of stress BFU-Es following BMP4 treatment (6-fold increase versus 4.6-fold increase). These data suggest that Wv/+ mice may have a slight decrease in the number of BMP4R cells in the spleen. Our previous analysis of BMP4R cells showed that these progenitors were present in the spleen MEP population.1 Recent analysis of W/Wv mice from our laboratory showed that they exhibited a 10-fold reduction in the number of spleen MEPs.30 However, analysis of MEPs in Wv/+ mice showed that the numbers of MEPs in the spleens of these mice are not significantly different from control mice (data not shown) Taken together, these data demonstrate that a severe defect in the SCF/Kit receptor signaling pathway, as seen in the W/Wv mice, results in a loss of BMP4R cells in the spleen, which compromises the BMP4-dependent stress erythroid pathway. In contrast, the mild perturbation in the expansion of stress BFU-Es in the Wv/+ mutant mice results from defective Kit/SCF signaling, leading to a small decrease in the numbers of BMP4R cells and a moderate effect on the expansion of stress BFU-E during the recovery period.
WBB6F1-W/Wv spleen contains few BMP4R cells. Spleen cells from WBB6F1 control, WBB6F1-W/Wv, C57BL/6 control, and C57BL/6-Wv/+ mice were plated in media containing Epo (3 U/mL) or Epo + BMP4 (15 ng/mL). The values indicated are the average of 2 mice each done in triplicate. The fold increase in stress BFU-Es when BMP4 was included in the media was calculated by dividing the number of stress BFU-E colonies observed in Epo + BMP4 by the number of stress BFU-E colonies observed in media containing only Epo. Error bars indicate SD.
WBB6F1-W/Wv spleen contains few BMP4R cells. Spleen cells from WBB6F1 control, WBB6F1-W/Wv, C57BL/6 control, and C57BL/6-Wv/+ mice were plated in media containing Epo (3 U/mL) or Epo + BMP4 (15 ng/mL). The values indicated are the average of 2 mice each done in triplicate. The fold increase in stress BFU-Es when BMP4 was included in the media was calculated by dividing the number of stress BFU-E colonies observed in Epo + BMP4 by the number of stress BFU-E colonies observed in media containing only Epo. Error bars indicate SD.
BMP4 and SCF play distinct roles in the expansion of stress BFU-Es
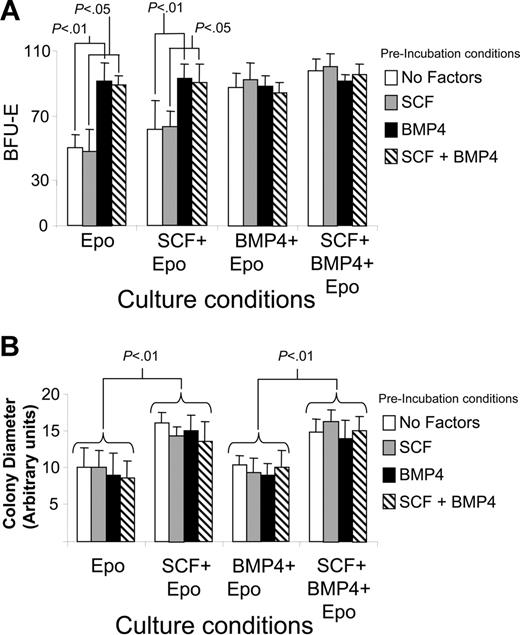
Analysis of W/Wv and f/f mice has clearly established a role for BMP4 and SCF in the expansion of stress BFU-Es during the recovery from acute anemia. Previously, we showed that BMP4 was only required transiently to induce the differentiation of stress BFU-Es. We now extend that analysis to determine the requirement for SCF/Kit receptor signaling in the development and expansion of stress BFU-Es. We preincubated spleen cells from C57BL/6 mice with SCF, BMP4, SCF + BMP4, or media alone for 24 hours. The cells were then washed and plated in methylcellulose media containing Epo, Epo + SCF, Epo + BMP4, or Epo + SCF + BMP4. Stress BFU-E colonies were counted 5 days later. Figure 3A shows that preincubation with BMP4 or the presence of BMP4 in the methylcellulose media significantly increases the number of stress BFU-Es. SCF had little effect on the number of stress BFU-E colonies regardless of whether it was present in the preincubation step or present throughout the culture time. Although SCF had no effect on the number of stress BFU-Es, it did affect the average size of the BFU-E colony (Figure 3B). When SCF was present in methylcellulose media throughout the culture time, the stress BFU-E colonies were significantly larger, and this effect was independent of BMP4. Preincubation with SCF was not sufficient to increase the size of the colonies, suggesting that SCF was required throughout the culture period. The presence of BMP4 alone in the cultures had no effect on the size of the colonies. These data demonstrate that BMP4-dependent signals increase the number of stress BFU-Es, whereas SCF/Kit-dependent signals increase the colony size.
Analysis of the role of SCF and BMP4 in increasing the number and size of stress BFU-E colonies in vitro. Spleen cells from C57BL/6 mice were preincubated in media containing no factors, SCF, BMP4, or BMP4 + SCF for 24 hours as indicated. The cells were then washed and plated in methylcellulose media containing the indicated factors for 5 days. (A) Stress BFU-Es were scored, and (B) stress BFU-E colony diameter was measured. The results presented are the average of 2 independent experiments. Error bars indicate SD.
Analysis of the role of SCF and BMP4 in increasing the number and size of stress BFU-E colonies in vitro. Spleen cells from C57BL/6 mice were preincubated in media containing no factors, SCF, BMP4, or BMP4 + SCF for 24 hours as indicated. The cells were then washed and plated in methylcellulose media containing the indicated factors for 5 days. (A) Stress BFU-Es were scored, and (B) stress BFU-E colony diameter was measured. The results presented are the average of 2 independent experiments. Error bars indicate SD.
Hypoxia works in concert with BMP4 and SCF to increase the number and size of stress BFU-Es in vitro
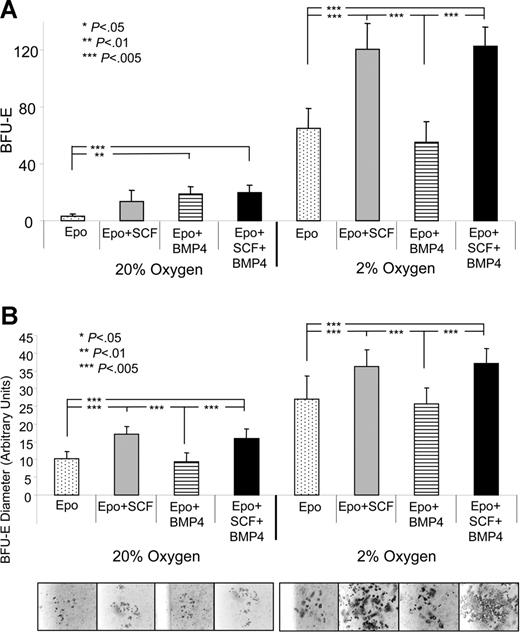
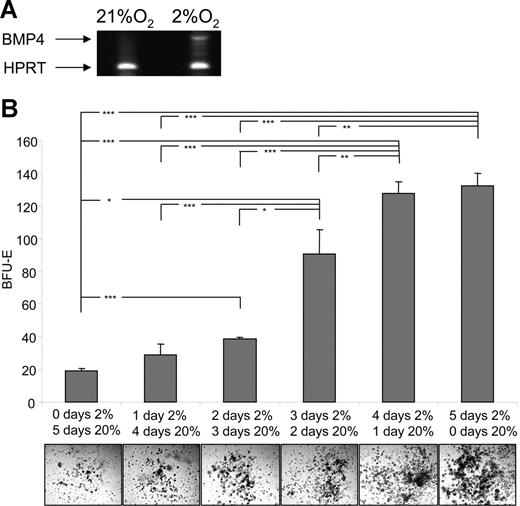
BMP4 alone or in combination with SCF induces only a moderate expansion of stress BFU-Es when compared with the 45-fold expansion observed in vivo. Clearly, another signal is required in vivo to drive the expansion of stress BFU-Es. Acute anemia results in tissue hypoxia, and hypoxia can alter cellular responses of erythroid progenitor cells. Hypoxia can induce the expression of Epo and BMP4, which directly affects the expansion and differentiation of stress BFU-Es.1,23 We tested whether hypoxia contributed to the expansion of stress BFU-Es by plating spleen cells from nonanemic mice in media containing Epo, Epo + SCF, Epo + BMP4, and Epo + SCF + BMP4 and culturing them at 20% or 2% O2. Figure 4A shows that the response of spleen cells to 2% O2 is dramatically different than at 20% O2. Overall, there is a significant increase in the number of stress BFU-Es, even when cells are plated in media containing only Epo. When cells are plated in Epo + BMP4 + SCF, we observe a 41-fold expansion of stress BFU-Es when compared with cells plated in Epo-containing media at 20% O2, which is similar to the 45-fold expansion we observe in vivo during the recovery from acute anemia. These data demonstrate that the 3 signals, BMP4, SCF, and hypoxia, can recapitulate in vitro the expansion of stress BFU-Es observed in vivo.
Hypoxia acts in concert with BMP4 and SCF to induce stress BFU-E expansion in vitro. Spleen cells were plated in methylcellulose media containing the indicated factors and grown at 20% or 2% O2. (A) Stress BFU-Es were scored after 5 days of culture. (B) The average diameter of stress BFU-E colonies was determined. Representative colonies are presented below each condition. The results presented are the average of 2 independent experiments.
Hypoxia acts in concert with BMP4 and SCF to induce stress BFU-E expansion in vitro. Spleen cells were plated in methylcellulose media containing the indicated factors and grown at 20% or 2% O2. (A) Stress BFU-Es were scored after 5 days of culture. (B) The average diameter of stress BFU-E colonies was determined. Representative colonies are presented below each condition. The results presented are the average of 2 independent experiments.
Hypoxia alters the response of stress BFU-Es to SCF. At 20% O2, SCF can only increase the size of the stress BFU-E colonies, but does not increase the number of stress BFU-Es (Figure 4B). However, at 2% O2, SCF is now able to increase the number of stress BFU-Es. Based on these data, it appears that hypoxia allows for a larger expansion of stress BFU-Es than is observed at 20% O2. These data show that hypoxia, SCF, and BMP4 act in concert to expand the number of stress BFU-Es and increase the size of the BFU-E colonies, which is consistent with our observation that the BMP4-dependent stress erythropoiesis pathway rapidly and robustly generates new erythrocytes during the recovery from acute anemia.
Hypoxia induces the expression of BMP4 in vitro and alters the response of stress BFU-E
One puzzling observation from these experiments was that BMP4 appeared to have no effect on the number of stress BFU-Es when the cells were grown at 2% O2. Previously, we observed that hypoxia can induce the expression of BMP4 in the MSS31 spleen stromal cell line, which suggested that hypoxia could also induce the expression of BMP4 in the spleen cell cultures. We analyzed the expression of BMP4 in spleen cells cultured at 20% or 2% O2 by RT-PCR (Figure 5A). Hypoxia induces the expression of BMP4 in these cultures. The absence of an effect of BMP4 on the number of stress BFU-Es is most likely due to the action of endogenously expressed BMP4. Indeed, addition of the BMP4 antagonist, Noggin, to cultures grown in media containing only Epo at 2% O2 inhibited the ability of hypoxia to increase the number of stress BFU-Es, which supports the idea that hypoxia induces the expression of endogenous BMP4 (data not shown).
Hypoxia induces BMP4 expression and alters the response of stress BFU-Es to BMP4 and SCF. (A) Spleen cells were grown for 24 hours at 20% or 2% O2. Expression of BMP4 mRNA was measured by RT-PCR. (B) Spleen cells were plated in methylcellulose media containing Epo and grown for the indicated times in 20% or 2% O2. *P < .05, **P < .01, ***P < .005 for the indicated comparisons.
Hypoxia induces BMP4 expression and alters the response of stress BFU-Es to BMP4 and SCF. (A) Spleen cells were grown for 24 hours at 20% or 2% O2. Expression of BMP4 mRNA was measured by RT-PCR. (B) Spleen cells were plated in methylcellulose media containing Epo and grown for the indicated times in 20% or 2% O2. *P < .05, **P < .01, ***P < .005 for the indicated comparisons.
Our analysis of BMP4 and SCF showed that BMP4 was required only transiently to increase the number of stress BFU-Es,1 whereas transient exposure to SCF did not increase the number of stress BFU-Es (Figure 3). However, the question remained whether hypoxic conditions were required for entire culture time. Spleen cells were plated in media containing Epo only and grown at 20% or 2% O2 for different amounts of time. Figure 5B shows that increasing the culture time at low O2 resulted in a linear increase in the number of stress BFU-Es (Figure S1). In addition, the size of the colonies also increased with the extended culture under hypoxic conditions.
In vitro culture of spleen progenitors in BMP4, SCF at 2% O2 results in the expansion and terminal differentiation of stress erythroid progenitors
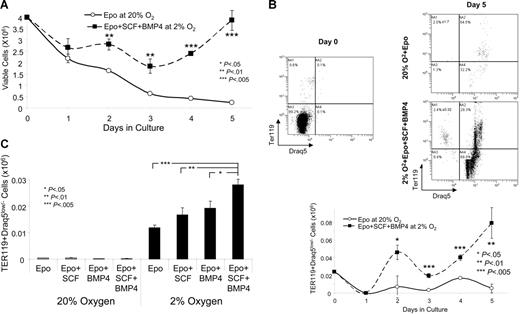
The increase in BFU-E size observed when spleen cells were cultured in BMP4 and SCF at 2% O2 was estimated by measuring the diameter of the colonies. To more accurately determine the increase in burst size, we cultured spleen cells in the same media without methylcellulose and measured the development of reticulocytes and erythrocytes by flow cytometry. Previous work has shown that reticulocytes and erythrocytes can be measured by staining with the late erythroid marker TER119 and the nucleic acid stain, Draq5.31 Erythrocytes and reticulocytes are TER119+Draq5low/−. We cultured spleen cells in media containing Epo alone at 20% O2 or Epo + BMP4 + SCF at 2% O2 for 5 days. During the culture period the number of viable cells was determined by trypan blue staining (Figure 6A). Cells grown in Epo alone at 20% O2 steadily decreased in number such that by 5 days the number of viable cells was less than 10% of the starting number. In contrast, the cells grown in Epo + BMP4 + SCF at 2% O2 decreased in number until day 3 of culture, after which they proliferated, and by day 5 the number of viable cells was similar to the number of cells originally placed in culture. From day 2 through day 5 the cultures grown in the 3 signals contained significantly more cells than the cells grown in Epo alone. We measured the number of TER119+Draq5low/− cells in the cultures at day 5 of culture (Figure 6B). The cells grown in BMP4 + SCF at 2% O2 produced significantly more terminally differentiated erythroid cells. We measured the production of TER119+Draq5low/− cells each day during the culture period. The production of TER119+Draq5low/− cells exhibited biphasic kinetics. An initial peak of terminally differentiated cells was observed at day 2 of culture and a second peak at day 4 to 5. The initial peak may correspond to progeny of CFU-Es, whereas the second peak may correspond to stress BFU-Es. The cells grown in the 3 signals exhibited significantly more terminally differentiated cells at day 2 of culture. At day 5, when the number of TER119+Draq5low/− cells were decreasing in cultures grown in Epo alone, the cells grown in BMP4 + SCF at 2% O2 continued to produce increasing numbers of TER119+Draq5low/− cells.
BMP4 + SCF + hypoxia promotes the terminal differentiation (TER119+Draq5low/−) spleen stress erythroid progenitors in vitro. Spleen cells were cultured in Epo at 20% O2 or Epo + BMP4 + SCF at 2% O2 (A-B) or in the indicated conditions (C) in liquid culture. (A). Viable cells were determined by trypan blue staining on the indicated days of culture. (B). Cells were stained on days 0 and 5 of culture for TER119 and Draq5. The top panel shows representative flow diagrams and the bottom panel shows the total number of Ter119+Draq5low/− cells in the culture at days 0 to 5. (C). Cells were grown in the indicated conditions, and the total number of Ter119+Draq5low/− cells in the culture is shown at day 4. The flow diagrams for this graph are presented in Figure S2. These data are representative of 3 independent experiments.
BMP4 + SCF + hypoxia promotes the terminal differentiation (TER119+Draq5low/−) spleen stress erythroid progenitors in vitro. Spleen cells were cultured in Epo at 20% O2 or Epo + BMP4 + SCF at 2% O2 (A-B) or in the indicated conditions (C) in liquid culture. (A). Viable cells were determined by trypan blue staining on the indicated days of culture. (B). Cells were stained on days 0 and 5 of culture for TER119 and Draq5. The top panel shows representative flow diagrams and the bottom panel shows the total number of Ter119+Draq5low/− cells in the culture at days 0 to 5. (C). Cells were grown in the indicated conditions, and the total number of Ter119+Draq5low/− cells in the culture is shown at day 4. The flow diagrams for this graph are presented in Figure S2. These data are representative of 3 independent experiments.
We extended this analysis by culturing spleen cells in the 8 conditions used in the BFU-E assays: Epo, Epo + SCF, Epo + BMP4, and Epo + SCF + BMP4 at either 20%O2 or 2% O2. We measured TER119+Draq5low/− cells after 4 days in culture. Figure 6C (and Figure S2) shows that hypoxia significantly increases the production of terminally differentiated erythroid cells, and the presence of all 3 signals, BMP4, SCF, and hypoxia, results in the greatest production of erythrocytes and reticulocytes. These data differ somewhat from the BFU-E data in that spleen cells grown in Epo + SCF at 2% O2 did not produce the same number of TER119+Draq5low/− cells as Epo + BMP4 + SCF at 2% O2. This difference may be because the colony size measured in Figure 3 takes into account all benzidine-positive cells which would include both terminally differentiated cells and late-stage nucleated erythroid progenitors. Despite this difference, these data show that BMP4, SCF, and hypoxia significantly increase the production of terminally differentiated erythroid cells.
BMP4, SCF, and hypoxia promote the preferential expansion of Kit+CD71+TER119+ stress erythroid progenitors
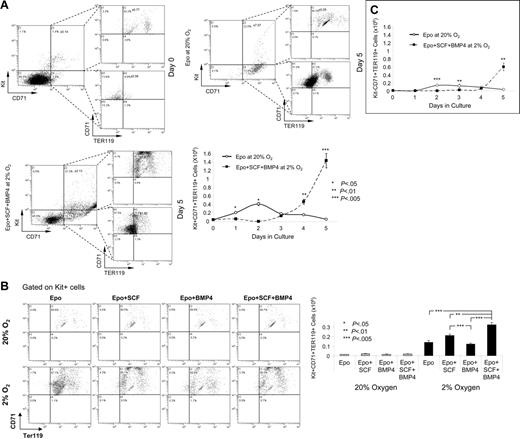
Previous work has established a paradigm for the differentiation of bone marrow erythroid progenitors based on their expression of Kit, CD71, and TER119.32–34 Early progenitor cells are characterized as Kit+CD71loTER119−. As these cells progress through maturation, they lose the expression of Kit, up-regulate CD71, and turn on TER119. Later during terminal stages CD71 is turned off, and only TER119 expression remains. Using these 3 markers, we analyzed the different populations of progenitor cells when spleen cells were grown in media containing only Epo at 20% O2 or Epo + BMP4 + SCF at 2% O2. After 5 days in culture, the major cell population that expanded in the cultures grown with all 3 signals was not a late-stage progenitor, but rather a population that expressed all 3 markers, Kit+CD71+TER119+ (Figure 7A; Figure S3). In the cultures with only Epo in the media, there was small expansion of these cells at day 2, but this population rapidly decreases after that time point. Progenitor cells that express both immature (Kit) and mature cell (TER119) markers have been observed before in conjunction with stress erythropoiesis. Rb−/− mice have a block in stress erythropoiesis resulting in increased numbers of these cells.35 Bauer et al28 showed that mice mutant for the glucocorticoid receptor exhibited a defect in the recovery from PHZ-induced anemia. Those researchers suggested that the defect was due to the inability of the mutant mice to expand a population of progenitors that expressed CD34, Kit, and TER119. Preliminary experiments suggest that the Kit+CD71+TER119+ cells are also CD34+ (O.F.H. and R.F.P, unpublished observations, November 2006), which suggests that BMP4, SCF, and hypoxia regulate the expansion of the glucocorticoid receptor–dependent population.
BMP4, SCF, and hypoxia preferentially expand Kit+CD71+TER119+ stress erythroid progenitors. (A) Flow cytometry analysis of Kit, CD71, and TER119 expression of spleen cells cultured in media containing Epo at 20% O2 or Epo + BMP4 + SCF at 2% O2. Top panel shows expression at day 0 and day 5 of culture. Bottom panel shows the total number of Kit+CD71+TER119+ cells on each day of the 5-day culture period. The flow diagrams for this analysis are presented in Figure S3. (B). The top panel shows the flow diagrams gated on Kit+ cells showing the expression of CD71 and Ter119. Bottom panel shows the total number of Kit+CD71+TER119+ cells at day 4 of culture in the indicated conditions. (C) Total number of Kit−CD71+TER119+ cells generated on each day when spleen cells were cultured in Epo at 20% O2 or Epo + BMP4 + SCF at 2% O2 for 5 days. The flow diagrams for these data are presented in Figure S4B. These data are representative of 3 independent experiments.
BMP4, SCF, and hypoxia preferentially expand Kit+CD71+TER119+ stress erythroid progenitors. (A) Flow cytometry analysis of Kit, CD71, and TER119 expression of spleen cells cultured in media containing Epo at 20% O2 or Epo + BMP4 + SCF at 2% O2. Top panel shows expression at day 0 and day 5 of culture. Bottom panel shows the total number of Kit+CD71+TER119+ cells on each day of the 5-day culture period. The flow diagrams for this analysis are presented in Figure S3. (B). The top panel shows the flow diagrams gated on Kit+ cells showing the expression of CD71 and Ter119. Bottom panel shows the total number of Kit+CD71+TER119+ cells at day 4 of culture in the indicated conditions. (C) Total number of Kit−CD71+TER119+ cells generated on each day when spleen cells were cultured in Epo at 20% O2 or Epo + BMP4 + SCF at 2% O2 for 5 days. The flow diagrams for these data are presented in Figure S4B. These data are representative of 3 independent experiments.
We also investigated the effects of the 8 different combinations of BMP4, SCF, and hypoxia on the expansion of Kit+CD71+TER119+ cells (Figure 7B). When cells were grown at 20% O2, significantly fewer triple-positive cells were observed. However, BMP4 and SCF had a slight but significant effect on the expansion of these cells. The situation was dramatically different when cells were grown at 2% O2. The Kit+CD71+TER119+ cells were significantly expanded. The greatest expansion was observed in cells grown in Epo + BMP4 + SCF, with significant expansion also seen with cells grown in Epo + SCF. These data resemble the BFU-E data presented in Figure 3, which supports a model whereby Kit+CD71+TER119+ cells represent stress BFU-Es or their immediate progeny.
The analysis of bone marrow cells has established a hierarchy in the expression of Kit, CD71, and TER119 such that different stages of erythroid maturation can be identified based on the expression of these markers. Our analysis of the spleen stress erythroid progenitors showed that when cells were grown in media containing Epo + BMP4 + SCF at 2% O2, the majority of the cells were Kit+CD71+TER119+; however, at day 5 significant amounts of Kit−CD71+TER119+ cells were observed (Figure 7C). These data suggest that spleen erythroid progenitors transit through similar late maturation stages as observed with bone marrow erythroid progenitors. We did not observe an increase in Kit+CD71+TER119− cells prior to the appearance of the Kit−CD71+TER119+ cells as is observed in bone marrow erythroid progenitors, which suggests that Kit+CD71+TER119+ cells enter the differentiation pathway at a late stage. This model supports the idea that the BMP4-dependent stress erythropoiesis pathway rapidly produces large numbers of erythrocytes in response to acute need.
Discussion
Our previous work showed that BMP4-dependent signaling was required for the expansion of a specialized population of stress erythroid progenitors that we termed stress BFU-Es.1 This work showed that in vitro BMP4 could increase the number of stress BFU-Es, but the magnitude of the response to BMP4 was far less than that observed in vivo. Our data here demonstrate that 2 other signals are required for the maximal expansion of stress BFU-Es during the recovery from acute anemia: SCF and hypoxia. Early work showed that W/Wv mice were unable to rapidly recover from PHZ-induced acute anemia. Our data show that the defect in these mice is an absence of BMP4R cells in the spleen and a severe delay in the expansion of stress BFU-Es. Once the W/Wv mice do respond, they exhibit a 2- to 2.5-fold greater expansion than observed in control mice. Preliminary data from our laboratory have suggested that bone marrow progenitors migrate to the spleen to replenish the BMP4R cells following recovery from acute anemia (J.M.P. and R.F.P., unpublished observations, October 2005). The absence of BMP4R cells in the spleens of W/Wv mice, therefore, might require the migration of new progenitors from the bone marrow, which would delay the expansion of stress BFU-Es. The expansion of stress BFU-Es despite the severe defect in the Kit/SCF signaling pathway is similar to the near normal production of platelets in Mpl−/− mice during the recovery from thrombocytopenia induced by 5-fluorouracil; however, in this situation other signaling pathways are thought to bypass the need for Tpo/Mpl-dependent signals.36 It is unclear whether another signaling pathway can bypass SCF/Kit receptor signaling during the recovery from acute anemia, and further experiments will be needed to address this question.
BMP4 and SCF exert distinct effects on stress erythroid progenitors. Previously, we showed that BMP4 is required only transiently and increases the number of stress BFU-Es by promoting the differentiation of BMP4R cells to stress BFU-Es. BMP4, on the one hand, had no effect on the size of the bursts. SCF, on the other hand, has distinct effects depending on whether cells are cultured at 20% or 2% O2. At high O2 concentration, SCF increased the size of the bursts but had no effect on the number of stress BFU-Es, whereas under hypoxic conditions SCF was able to increase the number of stress BFU-Es as well as increase their size. In addition, SCF increases the sensitivity of stress BFU-Es to Epo, which may play a role early or possibly late in the response when serum Epo levels are not as high (Figure S4). Hypoxia was able to enhance the response of stress BFU-Es to both SCF and BMP4. The combination of these 3 signals in vitro was able to recapitulate the expansion of stress BFU-Es observed in vivo. The ability of hypoxia to regulate not only the expression of BMP41 but also the response of progenitor cells to SCF and BMP4 provides a powerful mechanism to restrict the BMP4-dependent stress erythropoiesis pathway to times of acute anemia.
BMP4, SCF, and hypoxia promote the expansion of Kit+CD71+TER119+ progenitor cells. These cells are present at low levels, approximately 1%, in the spleens of untreated mice, but they are preferentially expanded in culture with the 3 signals. The combination of immature (Kit) and mature (TER119) progenitor cell markers is not observed in bone marrow erythroid progenitors. However, this combination has been observed in stress erythropoiesis. Bauer et al28 showed that mice mutant for the glucocorticoid receptor exhibited a defective recovery from PHZ-induced anemia. These mice failed to expand a population of progenitors that expressed CD34, Kit, and TER119.28 Our preliminary analysis of the Kit+CD71+TER119+ cells showed that they were also CD34+, which suggests that glucocorticoids may also contribute to the signals provided by BMP4, SCF, and hypoxia during the recovery from acute anemia. Putative stress erythroid progenitor cells in humans also express a combination of immature and mature cell markers. CD34+Kit+GlyA+ cells from the bone marrow and peripheral blood of patients with sickle cell anemia and patients with β-thalassemia exhibit properties distinct from steady state bone marrow erythroid progenitors.37,38 Analysis of this population from patients with sickle cell showed that these cells readily generate HbF-expressing erythrocytes. Given their coexpression of immature and mature cells markers, it has been suggested that these cells differentiate more rapidly than steady state bone marrow progenitors. Our data also support a model whereby Kit+CD71+TER119+ cells appear to skip steps in the differentiation pathway. In our liquid culture assays, we do not observe an increase in Kit+CD71+TER119− cells prior to the appearance of Kit−CD71+TER119+ cells. Preliminary experiments show that Kit+CD71+TER119+ cells sorted from cultures, then reseeded into media containing Epo + BMP4 + SCF at 2% O2, give rise to Kit−CD71+TER119+ cells, which suggests that these progenitor cells directly generate the Kit−CD71+TER119+ cells. Furthermore, these progenitors appear to have a large proliferative potential because we have observed that cultures of Kit+CD71+Ter119+ cells will continue to generate Kit−CD71+Ter119+ cells for at least 16 days in culture (O.F.H. and R.F.P., unpublished observations, November 2006). The similarities in the expansion of Kit+CD71+TER119+ cells and stress BFU-Es when spleen cells are cultured in BMP4, SCF, and hypoxia also suggests that these cells may represent stress BFU-Es. However, the relationship between Kit+CD71+Ter119+ cells and stress BFU-Es is not clear and will require further analysis. In addition, it will be necessary to examine these progenitors to determine whether they possess properties similar to the stress erythroid progenitors observed in patients with sickle cell anemia and whether BMP4, SCF, and hypoxia can stimulate the expansion of human CD34+Kit+GlyA+ stress erythroid progenitors.
Authorship
Contribution: J.P. and O.F.H. participated in the design of the experiments, performed the experiments, and assisted in writing the manuscript; and R.F.P. designed experiments, participated in the data analysis, and wrote the manuscript.
Conflict-of-interest disclosure: The authors declare no competing financial interests.
J.P. and O.F.H. contributed equally to this work.
Correspondence: Robert F. Paulson, 115 Henning Bldg, The Pennsylvania State University, University Park, PA 16802; e-mail: rfp5@psu.edu.
The online version of this article contains a data supplement.
The publication costs of this article were defrayed in part by page charge payment. Therefore, and solely to indicate this fact, this article is hereby marked “advertisement” in accordance with 18 USC section 1734.
We thank Shailaja Hegde for excellent technical support, Marie Csete for advice on low-oxygen cultures, Pam Correll for reading the manuscript, members of the Paulson laboratory for helpful suggestions, and the Center for Quantitative Cell Analysis for advice on flow cytometry.
This work was supported by the National Institutes of Health (grant RO1 HL70720) (R.F.P.).

This feature is available to Subscribers Only
Sign In or Create an Account Close Modal