Abstract
Objective: To assess the impact of short term indoor firing ranges lead exposure and its relationship to iron, ferritin, lead, zinc protoporphyrin and hemoglobin concentration among young adults.
Methods: We report of a clinical observation that was carried out in 30 young and healthy soldiers serving in the Israel Defense Forces (IDF) Counter Terrorist Unit (CTU). Blood samples were drawn for Lead (Pb), Zinc Protoporphyrin (ZPP),Iron, Hemoglobin (Hb) and ferritin prior to and after a 6 weeks period of intensive shooting practice in indoor firing ranges.
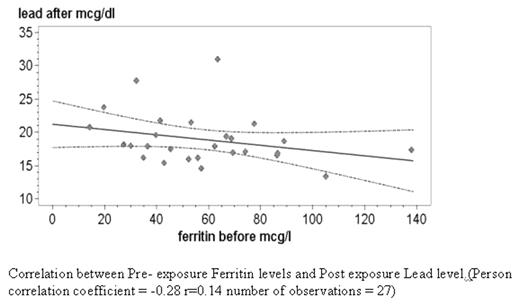
Results: A mean Blood lead level increase (p< 0.0001) with a mean Iron (p<0.0005) and mean ferritin (p<0.0625) decrease simultaneously after 6 weeks period of Lead dusts exposure were demonstrated. We found a trend for inverse correlation between pre-exposure low ferritin levels and post exposure high blood lead levels.
Conclusion: We found decreased iron and ferritin levels after short term lead exposure among young adults. This can be explained by competition of iron and lead absorption viatransporters like DMT1 suggesting that lead poisoning can cause iron depletion and that iron depletion can aggravate lead poisoning. This synergistic effect should come to every physicians mind especially when treating patients with a potential risk for each problem separately.
Lead (Pb), Zinc Protoporphryn (ZPP), Hemoglobin (Hb), Iron and Ferritin among the CTU soldiers before and after the indoor firing ranges lead exposer
| variable . | N . | Pre-exposure . | N . | Post-exposure . | Difference . | *P value . |
|---|---|---|---|---|---|---|
| Pb (mcg/dl) | 29 | 10.3±2.3 | 30 | 18.9±3.6 | 8.8±2.6 | 0.0001 |
| ZPP(mcg/dl) | 29 | 42±7.5 | 30 | 42.9±8.1 | 0.03±6.5 | NS |
| Hb (g/dl) | 30 | 15±0.7 | 30 | 14.8±0.9 | 0.2±0.2 | NS |
| MCV (fl) | 30 | 88.7±2.5 | 30 | 89±2.7 | 0.3±0.2 | NS |
| Iron (mcg/dl) | 29 | 108.5±43.6 | 30 | 77.4±24.4 | −30.4±41.2 | 0.0005 |
| Ferritin (mcg/l) | 27 | 58.1±27.7 | 16 | 51±19.9 | −6.1±10.7 | 0.0625 |
Correlation between Pre-exposure Ferritin levels and Post exposure Lead level.(Person correlation coefficient = −0.28 r=0.14 number of observations = 27)
Correlation between Pre-exposure Ferritin levels and Post exposure Lead level.(Person correlation coefficient = −0.28 r=0.14 number of observations = 27)
Disclosure: No relevant conflicts of interest to declare.
Author notes
Corresponding author


This feature is available to Subscribers Only
Sign In or Create an Account Close Modal