Abstract
ITP is characterized by accelerated platelet destruction and also decreased platelet production. The inability to reliably quantify both platelet antibodies and platelet turnover has made it difficult to assess mechanisms of therapeutic effect with certainty. Two widely used therapies, IVIG and IV anti-D, are believed to primarily increase platelets by blocking Fcγ mediated platelet destruction; a similar effect in the marrow may also alter platelet production. Treatments for ITP are expanding as two thrombopoeitic agents (AMG 531 and Eltrombopag) complete phase 3 trials and a specific FcγRIII blocking agent (GMA161) is in phase I.
One measure of thrombopoiesis is to use RNA-binding fluorochromes to identify RNA present in newly made, ‘reticulated’ platelets using flow cytometers. The Sysmex XE-2100 enables rapid and fully automated quantification of the absolute immature platelet fraction (IPF), equivalent to enumerating reticulated platelets. This study uses the IPF to assess acute response to treatment in 16 patients with ITP, providing insight into mechanisms of effect (table 1).
IPF & Platelet Acute Response to Treatment
| Patient . | Treatment . | Initial Plts . | Max Post-Treatment Plts . | Increase (Plts) . | Initial IPF . | Max Post-Treatment IPF . | Increase (IPF) . |
|---|---|---|---|---|---|---|---|
| E/P BSM = Eltrombopag vs placebo blind RCT study medication. Plts = platelet count | |||||||
| 1 | IVIG | 1 | 121 | 120 | 0.7 | 33.5 | 32.8 |
| 2 | IVIG | 1 | 210 | 209 | 0.4 | 12 | 11.6 |
| 3 | IVIG | 10 | 157 | 147 | 1.7 | 8 | 6.3 |
| 4 | IVIG | 15 | 58 | 43 | 2.1 | 2.3 | 0.2 |
| 5 | IVIG | 7 | 171 | 164 | 1.5 | 6 | 4.5 |
| 6 | IVIG | 21 | 136 | 115 | 1.4 | 3.1 | 1.7 |
| 7 | IVIG + Anti-D | 3 | 160 | 157 | 1.8 | 17.3 | 15.5 |
| 8 | Anti-D | 7 | 335 | 328 | 2.8 | 8.4 | 5.6 |
| 9 | Anti-D | 9 | 79 | 70 | 2 | 5.5 | 3.5 |
| 10 | Anti-D | 1 | 11 | 10 | 0 | 3.9 | 3.9 |
| 11 | Anti-D | 13 | 167 | 154 | 2 | 5 | 3 |
| 12 | GMA | 14 | 108 | 94 | 3.4 | 13 | 9.6 |
| 13 | GMA | 7 | 45 | 38 | 1.2 | 5.1 | 3.9 |
| 14 | Rituxan | 24 | 187 | 163 | 6.6 | 14.4 | 7.8 |
| 15 | E/P BSM | 13 | 113 | 100 | 7.4 | 66.4 | 59 |
| 16 | E/P BSM | 16 | 558 | 542 | 5.9 | 29.4 | 23.5 |
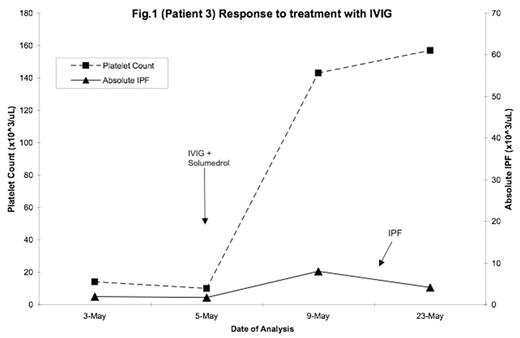
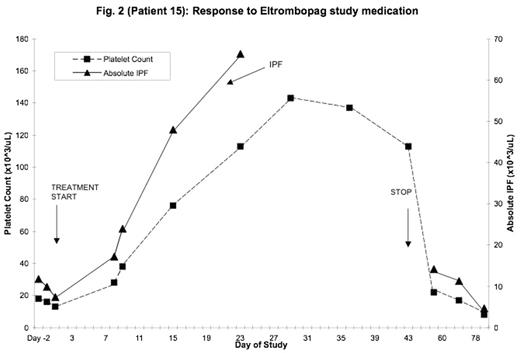
In 4/6 patients treated with IVIG (example fig. 1), 4/4 patients treated with anti-D, and 2/2 GMA-treated patients, the IPF did not change appreciably while the platelet counts dramatically increased, substantiating the Fc inhibition mechanism of effect. In 3 patients with large platelet increases (120–209K) in response to IVIG or IVIG plus anti-D, the IPF also substantially increased, demonstrating that IVIG +/− anti-D may increase platelet production in certain cases. All had low pre-treatment IPF and platelet counts, suggesting antibody-mediated inhibition of platelet production. The two patients on the Eltrombopag/placebo blind RCT (example fig. 2) had 2 of the 3 largest increases in IPF, 23.5 and 59 × 10^3/uL.
Using IPF to estimate platelet production provides novel insight into pathophysiology and mechanisms of effect of treatments in ITP. The dramatic increase in the absolute IPF seen with the thrombopoietic agent helps validate the clinical utility of this tool and allows discrimination of ITP patient heterogeneity.
Disclosures: Study drugs off label for ITP will be included: GMA161, Eltrombopagolamine.; Clinical research support to Cornell.
Author notes
Corresponding author


This feature is available to Subscribers Only
Sign In or Create an Account Close Modal