Abstract
Thrombopoietin (TPO), the major growth factor for cells of the megakaryocytic lineage, is removed from circulation by binding to c-mpl receptors present on platelets and megakaryocytes. We studied patients with acute lymphoblastic leukemia (ALL) or acute myeloblastic leukemia (AML) and used TPO-induced c-fos protein up-regulation as a marker of c-mpl functionality and observed that c-mpl-presenting blast cells were present in 62% (37 of 60) of patients with ALL but that c-mpl was nonfunctional in 0 of 28 patients and that they were present in 56% (22 of 39) of patients with AML and were functional in 43% (12 of 28). Adequate increases in serum TPO level in response to thrombocytopenia were seen in patients with ALL and with c-mpl-deficient (c-mpl-) AML. In contrast, in patients with c-mpl-proficient (c-mpl+) AML, TPO levels were found to be inappropriately low but increased to expected values during induction chemotherapy as blasts disappeared. In vitro significant TPO-associated blast cell proliferation or decreased apoptosis was observed only in patients with c-mpl+ AML compared with ALL or c-mpl- AML and was highly correlated with low in vivo TPO levels (P < .001). These data suggest that, in patients with AML, inadequate TPO levels are secondary to TPO clearing by functional c-mpl receptor myeloid blast cells and that TPO may serve as an in vivo myeloid leukemic growth factor in a significant number of patients. (Blood. 2006; 107:2525-2530)
Introduction
Thrombopoietin (TPO) serum levels are controlled by a regulatory loop consisting of TPO consumption by target cells, platelets, and megakaryocytes (MGKs) through TPO c-mpl receptor-mediated absorption.1 Thus, serum TPO level correlates inversely with platelet count in patients with hypoplastic thrombocytopenia, including chemotherapy-induced thrombocytopenia,2-4 aplastic anemia,5-7 myelodysplastic syndromes (MDS), and congenital amegakaryocytosis,8 whereas no correlation is observed in patients with hyperdestructive thrombocytopenia5 ; c-mpl has been observed on the surfaces of myeloid and lymphoid human blast cancer cells.9-14 TPO in vitro induces cell cycle activation in human acute myeloblastic leukemia (AML) blast cells,9,10,12,13 protects these cells from programmed cell death,13 and, in TPO nonresponding cells, is synergistic with other growth factors to support the growth of leukemic myeloid blast cells.9,12
Until now, no study has evaluated the relationship between serum TPO levels and the presence of c-mpl functional receptor on leukemic blast cells. However, through the evaluation of endogenous TPO level in patients with MDS and refractory anemia, it was found that though TPO level correlates inversely with platelet count in patients with refractory anemia, such correlation was not observed in patients with refractory anemia with excess blasts. This suggested that regulatory pathways other than thrombocytopenia, such as blast-expressing c-mpl, might operate in MDS.15
In this study, we evaluated at the time of diagnosis serum TPO levels and functional c-mpl blast cell counts in patients with acute lymphoblastic leukemia (ALL) and AML. On leukemic lymphoblasts, c-mpl was tested and found nonfunctional in all patients. In contrast, in myeloblasts, the presence of c-mpl was associated with blast capacity to respond in vitro to TPO by increased proliferation or decreased apoptosis. Inappropriately low TPO levels, observed only in patients with thrombocytopenic c-mpl-functional AML, increased to expected values during induction chemotherapy as blast cells disappeared. Thus, patients with AML with thrombocytopenia and inappropriately low TPO levels at AML diagnosis are likely to have c-mpl functional leukemic myeloblast cells that use endogen TPO as a growth factor.
Patients, materials, and methods
Patients
Serum samples were obtained from patients with a diagnosis of ALL (n = 42), AML (n = 38), or aplastic anemia (n = 13). Leukemic bone marrow cells were obtained from patients at the time of diagnosis with de novo ALL (n = 60) or AML (n = 39). In 4 AML patients, serial TPO during induction chemotherapy was measured at diagnosis (3 patients) or at relapse (1 patient). The research ethics committee of the Hôpital des Enfants approved this study. Informed consent was provided according to the Declaration of Helsinki.
Measurement of TPO levels in serum
Serum TPO levels were determined using ELISA (Quantikine; R&D Systems, Abingdon, United Kingdom) and were reported after logarithmic transformation according to platelet counts. The detection limit of the assay was 15 pg/mL. Platelet counts were determined at the same time using an automated hematology analyzer (Advia 120; Bayer Diagnostics, Tarrytown, NY).
Detection of TPO receptors expressed on leukemic cells
Membrane TPO-R expression on blast cells was determined by flow cytometry detection of the biotin-labeled TPO bound to TPO receptors (fluorokine biotinylated human TPO; R&D Systems). Biotin-TPO bound to receptors was revealed by streptavidin-FITC. Biotin-labeled irrelevant protein (soybean trypsin inhibitor) was used as negative control. Specificity of the labeling was confirmed by displacing biotin-TPO with 100-fold excess unlabeled TPO (R&D Systems) or by adding a blocking anti-TPO antibody. The amount of TPO receptor was estimated using the Kolmogorov-Smirnov test.16 Leukemic cell lines known to be c-mpl receptor positive (HEL) or negative (Raji, Molt4) were used as controls.17
Flow cytometry detection of c-fos protein expression
In 28 patients with ALL and 28 with AML (2 RAEBt, 3 M0, 2 M1, 10 M2, 1 M3, 5 M4, 1 M5A, 2 M6, 2 M7), relative levels of the nuclear oncoprotein c-fos in blast cells exposed in vitro to 200 ng/mL TPO were determined using flow cytometry assay, a reliable method for quantitative assessment of the relative levels of transcription factors even when low numbers of cells are available.18-20 Flow cytometry assay also allows selective analysis of cells of interest, that is, blast cells with no interference of differentiated cells or platelets. Negative controls consisted of secondary antibody labeling alone. As with the methodology used in cell immunophenotyping, a threshold line was determined for each patient in the negative control sample such that 99% of unstained cells were detected under this line. The subset of fluorescent cells over the threshold line was considered to represent cells expressing c-fos. c-fos increases in response to TPO were calculated as a percentage of c-fos-positive cells after TPO stimulation minus the percentage of c-fos-positive cells in the unstimulated sample. Anti-c-fos monoclonal rabbit antibody (HS-125) and goat anti-rabbit IgG-FITC (sc-2012) were purchased from Santa Cruz Biotechnology (Santa Cruz, CA)
Cell cycle studies
The frequency of leukemia cells synthesizing DNA was determined by immunofluorescence staining of incorporated bromodeoxyuridine (BrdU) and flow cytometry analysis (BrdU Flow Kit; BD PharMingen, San Diego, CA). Briefly, leukemia cells were incubated in 10% FCS RPMI, with or without TPO (200 ng/mL). After 24 hours, cells were added to 1 mM BrdU and incubated overnight. BrdU-pulsed cells were fixed, permeabilized, treated for 1 hour with DNAse, and labeled by FITC-conjugated anti-BrdU antibody. Total DNA was stained with 7-AAD for 5 minutes, and cells were suspended in staining buffer and analyzed with a flow cytometer (FACScan; Becton Dickinson).
Detection of apoptosis
Apoptotic cells were detected after 48 hours of liquid suspension culture, with or without 200 ng/mL TPO, by FACScan with Annexin V and PI (Apotarget Annexin-V FITC Apoptosis kit; BioSource International, Camarillo, CA).
Statistical analysis
Differences between groups were tested using the Mann-Whitney U test, the Kruskall-Wallis test, or one way ANOVA. The relationship between TPO and platelet count was tested by linear regression after logarithmic transformation of TPO values. All statistical analyses were performed using Prism 4.00 for Windows (GraphPad Software, San Diego CA). To compare various subgroups for distribution of TPO levels according to platelet count, confidence ellipses were built using Systat 10.2 (Systat Software, Richmond, CA).
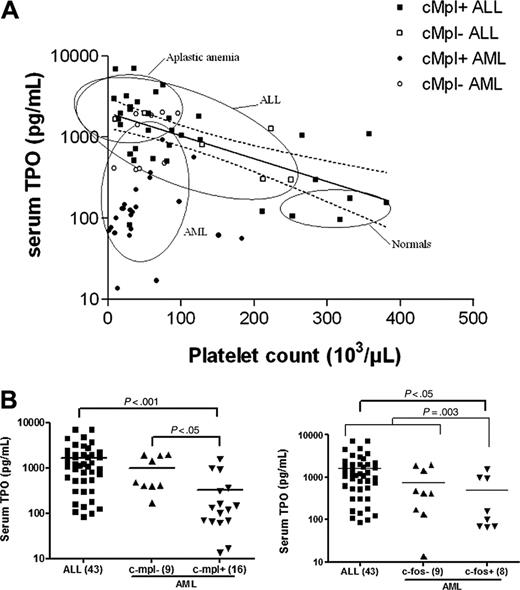
Inadequate serum TPO levels in patients with AML. (A) Relation between serum TPO levels and platelet counts in patients with ALL (squares) or AML (circles) at diagnosis. Open symbols depict patients with c-mpl- blasts, and closed symbols depict patients with c-mpl+ blasts. Ellipses represent bivariate confidence regions computed in various groups: healthy controls (n = 23) and patients with aplastic anemia (n = 13), ALL (n = 42), and AML (n = 33) at diagnosis. Solid line represents the regression line computed in ALL patients after the first 2 weeks of induction chemotherapy (n = 38). Dashed lines depict the 95% confidence limits of this regression. (B) Serum TPO levels were significantly lower in patients with c-mpl+ AML than in patients with c-mpl- AML or ALL. Similarly, TPO levels were lower in patients with AML with leukemic cells responding to TPO by an increase in c-fos expression than in patients with ALL or c-fos- AML. Statistical significance was computed using one-way ANOVA.
Inadequate serum TPO levels in patients with AML. (A) Relation between serum TPO levels and platelet counts in patients with ALL (squares) or AML (circles) at diagnosis. Open symbols depict patients with c-mpl- blasts, and closed symbols depict patients with c-mpl+ blasts. Ellipses represent bivariate confidence regions computed in various groups: healthy controls (n = 23) and patients with aplastic anemia (n = 13), ALL (n = 42), and AML (n = 33) at diagnosis. Solid line represents the regression line computed in ALL patients after the first 2 weeks of induction chemotherapy (n = 38). Dashed lines depict the 95% confidence limits of this regression. (B) Serum TPO levels were significantly lower in patients with c-mpl+ AML than in patients with c-mpl- AML or ALL. Similarly, TPO levels were lower in patients with AML with leukemic cells responding to TPO by an increase in c-fos expression than in patients with ALL or c-fos- AML. Statistical significance was computed using one-way ANOVA.
Results
Expression and functionality of c-mpl in leukemic cells and in vivo TPO levels
To evaluate whether TPO levels in response to thrombocytopenia at the time of diagnosis were appropriate in patients with ALL and AML, we first calculated the regression line of platelet count compared with log TPO level using data from 38 patients with ALL with chemotherapy-induced thrombocytopenia. As reported,3,4 an exponential increase in serum TPO level in response to thrombocytopenia was observed (log TPO = 3.3-0.0035x; P < .001), and, as expected,4-6 the confidence ellipse for patients with aplastic anemia (n = 13) was superimposed with this regression line (Figure 1A). Similar results were observed with the ellipse obtained with data from ALL patients at the time of diagnosis (n = 42), and the regression line in these patients (log TPO = 3.3-0.004x; P < .001) was not different from the regression line in controls. In contrast, the confidence ellipse for patients with AML (n = 33) was markedly different from the one observed for patients with ALL or aplastic anemia, indicating that in patients with AML, TPO levels at the time of diagnosis were inappropriately low (Figure 1A).
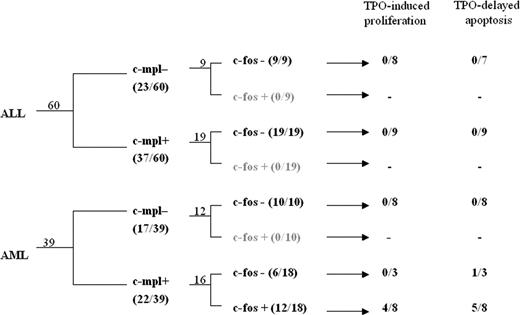
Leukemia subgroups according to c-mpl expression, TPO induced c-fos up-regulation, and TPO-associated functional tests. Flow chart indicating the numbers of patients in each subgroup according to leukemia lineage, c-mpl positivity, and responsiveness to TPO (by c-fos expression, proliferation, or decreased apoptosis).
Leukemia subgroups according to c-mpl expression, TPO induced c-fos up-regulation, and TPO-associated functional tests. Flow chart indicating the numbers of patients in each subgroup according to leukemia lineage, c-mpl positivity, and responsiveness to TPO (by c-fos expression, proliferation, or decreased apoptosis).
To evaluate whether such results might be related to the presence or absence of c-mpl expression on leukemic blast cells, flow cytometry was performed; c-mpl receptor was detected on the surfaces of leukemic cells in 62% (37 of 60) of ALL samples and 56% (22 of 39) of AML samples. When c-mpl expression data were plotted into the confidence ellipses, we observed that most of the c-mpl- and c-mpl+ ALL were included in the ALL confidence ellipse, indicating that in these patients the TPO response was adequate to the degree that thrombocytopenia was independent of c-mpl expression (Figure 1A). Within the AML population it was found that c-mpl+ AML was strictly included in the AML confidence ellipse, whereas 9 of 10 c-mpl- also fell within the overlapping confidence ellipse of ALL patients (Figure 1A), suggesting the presence of biologic differences among patients with c-mpl+ and c-mpl- AML. This was confirmed when TPO levels within these 2 AML subgroups were analyzed by one-way ANOVA. Thus, significant differences in TPO levels were found not only between patients with c-mpl+ AML (n = 16) and those with ALL (n = 43) (P < .001) but also between those with c-mpl+ AML and with c-mpl- (n = 9) AML (P < .05) (Figure 1B). To further characterize differences between patients with c-mpl+ ALL and those with c-mpl+ AML, we evaluated the ability of TPO to up-regulate in vitro c-fos protein expression, an early signaling pathway known to be activated by TPO in c-mpl-presenting cells and in c-mpl mutants deficient in Jak-Stat activation.21 We could not detect increased c-fos expression in any of the 28 patients with ALL—be it those with c-mpl+ (n = 19) or those with c-mpl- (n = 9)—exposed to TPO. Similarly, c-fos protein up-regulation could not be detected in the 10 patients with c-mpl- AML exposed to TPO. In contrast, increased c-fos protein expression was observed in 12 of 18 patients with c-mpl+ AML (P < .05) (Figure 2). No correlation was found between TPO responsiveness and (French-American-British) FAB classification. When these results were computed with TPO data (Figure 1B), significant differences in TPO levels were found between patients with c-fos+ AML (n = 8) and those with ALL (n = 43) (P < .05) and between patients with c-fos+ AML and those with c-fos leukemia (n = 52), including 43 patients with ALL and 9 with AML (P = .003). The absence of statistically significant differences in TPO levels between patients with c-fos+ AML and those with c-fos- AML (P > .05) was related primarily to the low number of patients in each subgroup.
In vitro proliferation and antiapoptotic effect of TPO
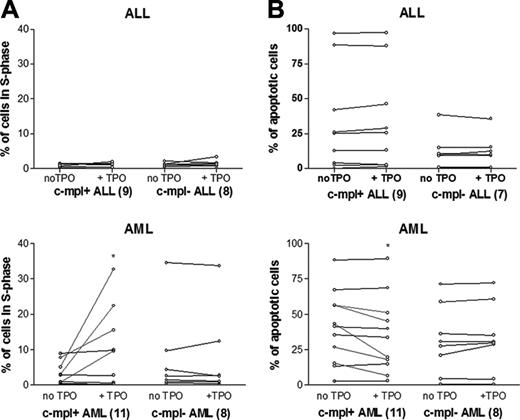
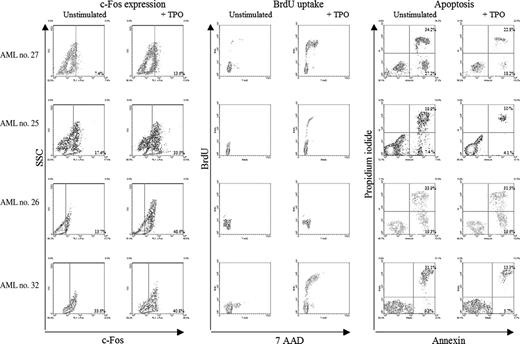
The effect of in vitro TPO-induced proliferation (Figure 3A) or apoptosis (Figure 3B) was evaluated in 19 ALL samples—11 c-mpl+ and 8 c-mpl-—and in 16 AML samples—9 c-mpl+ and 7 c-mpl-. We could not detect an effect of TPO in any of the ALL samples evaluated, either on proliferation or on apoptosis. Among the 19 AML samples, TPO was inactive in patients with c-mpl- AML (n = 8), whereas it increased proliferation (n = 4) or apoptosis (n = 4) in 6 of 11 patients with c-mpl+ AML (P < .01). Thus, TPO-associated functional tests were highly associated with the presence of the myeloid phenotype (P = .02), the presence of c-mpl on blast cells (P < .001), and c-fos up-regulation (P < .013). Figure 4 depicts c-fos expression, proliferation, and apoptosis in 4 representative patients.
TPO kinetics during induction chemotherapy
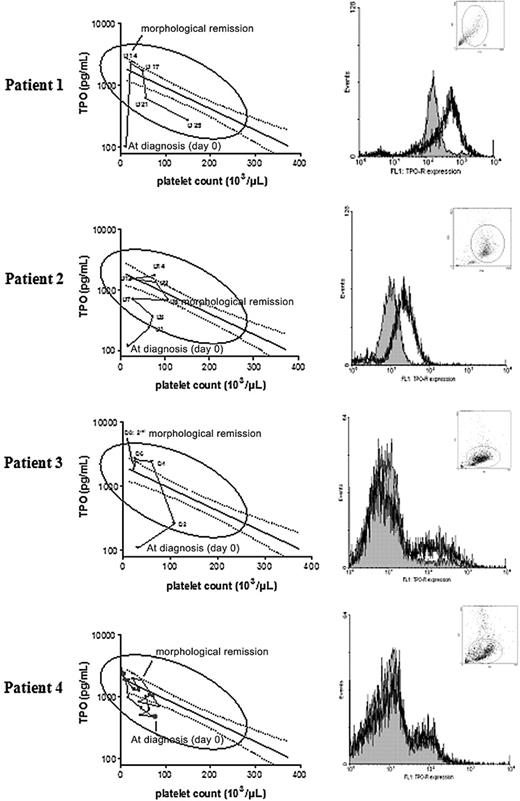
To evaluate whether the disappearance of c-mpl functional blast cells could affect TPO level, we sequentially determined TPO level and platelet count in 4 patients with AML who received induction chemotherapy. In 3 AML patients who had thrombocytopenia and c-mpl functional blast cells, TPO levels, inadequately low at diagnosis, increased to reach predicted levels as blast cells were disappearing. In the fourth AML patient with c-mpl--deficient blast cells, TPO levels, which at diagnosis were adequately increased in response to thrombocytopenia, remained elevated during chemotherapy (Figure 5).
TPO-increased proliferation and delayed apoptosis in patients with ALL and AML. (A) Incubation with TPO for 36 hours induced the proliferation of leukemia cells in 4 of 11 patients with c-mpl+ AML but in no patients with c-mpl- AML or ALL (P < .05). (B) TPO incubation for 48 hours decreased the percentage of apoptotic cells in 5 of 11 patients with c-mpl+ AML but in no patients in other subgroups (c-mpl- AML and ALL) (P < .05). The asterisks represent P < .05.
TPO-increased proliferation and delayed apoptosis in patients with ALL and AML. (A) Incubation with TPO for 36 hours induced the proliferation of leukemia cells in 4 of 11 patients with c-mpl+ AML but in no patients with c-mpl- AML or ALL (P < .05). (B) TPO incubation for 48 hours decreased the percentage of apoptotic cells in 5 of 11 patients with c-mpl+ AML but in no patients in other subgroups (c-mpl- AML and ALL) (P < .05). The asterisks represent P < .05.
c-fos expression, proliferation, and apoptosis in 4 representative patients. In 3 patients (first, second, and fourth lines), TPO (200 ng/mL) incubation induced c-fos expression, increased the percentage of cells in S phase, and decreased the number of apoptotic cells (annexin V+ cells). In one patient (third line), TPO-induced c-fos expression was not associated with increased proliferation or decreased apoptosis. Relative levels of the nuclear oncoprotein c-fos in blast cells exposed in vitro to 200 ng/mL TPO were determined using flow cytometry assay after labeling by anti-c-fos monoclonal rabbit antibody and secondary antibody goat anti-rabbit IgG-FITC. Negative controls consisted in secondary antibody labeling alone. As with the methodology used in cell immunophenotyping, a threshold line was determined for each patient on the negative control sample such that 99% of unstained cells were under this line. The subset of fluorescent cells over the threshold line was considered to represent cells expressing c-fos. The frequency of leukemia cells in S phase was determined by flow cytometry detection of incorporated BrdU after 36-hour culture, with or without TPO (200 ng/mL).
c-fos expression, proliferation, and apoptosis in 4 representative patients. In 3 patients (first, second, and fourth lines), TPO (200 ng/mL) incubation induced c-fos expression, increased the percentage of cells in S phase, and decreased the number of apoptotic cells (annexin V+ cells). In one patient (third line), TPO-induced c-fos expression was not associated with increased proliferation or decreased apoptosis. Relative levels of the nuclear oncoprotein c-fos in blast cells exposed in vitro to 200 ng/mL TPO were determined using flow cytometry assay after labeling by anti-c-fos monoclonal rabbit antibody and secondary antibody goat anti-rabbit IgG-FITC. Negative controls consisted in secondary antibody labeling alone. As with the methodology used in cell immunophenotyping, a threshold line was determined for each patient on the negative control sample such that 99% of unstained cells were under this line. The subset of fluorescent cells over the threshold line was considered to represent cells expressing c-fos. The frequency of leukemia cells in S phase was determined by flow cytometry detection of incorporated BrdU after 36-hour culture, with or without TPO (200 ng/mL).
Discussion
Constitutive TPO expression by the liver and the kidneys is counterbalanced by its absorption and degradation in platelets and MGK. Thus, TPO levels vary inversely and proportionally to change in platelet and MGK masses, with free TPO representing the available hormone for the induction of differentiation and the proliferation of the MGK lineage.1 In humans, high TPO levels are observed in patients with thrombocytopenia of central origin secondary to myeloablative treatment or MGK deficiency, whereas low TPO levels are observed in patients with increased platelet destruction thrombocytopenia.2-8
We have previously observed a significant relationship between erythropoietin (EPO) and hemoglobin levels in children with cancer, indicating that, in contrast to anemia in adult cancer patients, anemia in children with cancer is associated with decreased erythropoiesis and not with inadequate erythropoietin production.22 To evaluate the pathophysiology of thrombocytopenia associated with leukemia at diagnosis, we evaluated serum TPO levels in patients with ALL or AML. As expected, a highly significant reverse relationship between TPO levels and platelet counts was found in patients with thrombocytopenic ALL at the time of diagnosis. Surprisingly, such a relationship was not observed in a group of patients diagnosed with AML. To further characterize the different leukemia populations, we conducted flow cytometry analysis to evaluate blast cells for c-mpl expression and c-mpl functionality, as measured by the up-regulation of the c-fos protein in response to in vitro TPO exposure. With these criteria, we could further define that 62% (37 of 60) of patients with ALL had the c-mpl+ type and that 19 of 19 were c-fos-; 59% (23 of 39) of patients with AML had the c-mpl+ type, and 66% (12 of 18) of those were c-fos+. These numbers, obtained by flow cytometry studies, are compatible with previously published studies in which increased c-mpl mRNA expression was detected in 51% of 51 patients with AML,23 40% of 59 patients with AML,24 52% of 50 patients with AML,25 and 60% of 47 patients with AML.26 In these studies, no significant correlation between c-mpl expression and the FAB classification of AML was found. The fact that c-mpl was not found in ALL samples in a previous study is likely related to the small number of patients evaluated (n = 5).25 Both c-mpl- AML and c-mpl+ or c-mpl- ALL patients behaved similarly, with adequate serum TPO responses related to the degree of thrombocytopenia. In contrast, at the time of diagnosis, patients with c-mpl+ AML had inadequate TPO levels despite profound thrombocytopenia. This suggested that among patients with ALL and AML, the presence of the c-mpl protein conferred unique biologic properties when it was expressed within a myeloid background.
In vitro leukemic myeloblast cell proliferation in response to TPO has been evaluated in a number of studies with different techniques, including thymidine uptake, colorimetric tests, and flow cytometry analyses. The percentage of responding AML patients varied from 20%10 to 73%,25 with a good correlation between in vitro TPO response and c-mpl mRNA expression.9,12,25 In our study, in vitro TPO response was highly correlated with the presence of a myeloid phenotype, the presence of c-mpl on blast cells, and c-fos up-regulation. In all these studies and in our own work, responding patients had all FAB subtypes, though more frequent or greater responses were observed among those with M5/M6 and especially M7 leukemia.9,13,25 Synergistic effects of TPO with other growth factors, such as kit ligand,10 IL-3,9,12,13 SCF,9,12,13,25 GM-CSF,25 IL-6,25 and IL-11,13 have been reported. In addition, increased proliferative responses to other cytokines by TPO, despite the lack of response to TPO alone, have also been reported.9,12 In our study the effect of TPO alone was evaluated, but it is likely that we underestimated, in terms of proliferation, the number of responding samples among the c-mpl+/c-fos+ AML samples. In addition to TPO-associated proliferative effects, we also found that TPO protected myeloid blasts from apoptosis. This has been reported previously in 13 of 19 AML samples exposed in vitro to TPO in which a small but significantly lower apoptosis index was found.13
Molecular cloning of human c-mpl has identified 2 isoforms of c-mpl, c-mpl-P and c-mpl-K, which arise by alternative splicing.26 c-mpl-P is the predominant form of c-mpl in platelets. The c-mpl-P/c-mpl-K ratio is heterogeneous, is varied during megakaryocyte differentiation, and is markedly reduced in patients with thrombocytopenia absent radii syndrome.27 In AML cells, both forms are coexpressed, and, as in platelets, the expression level of the K form c-mpl is much less than that of the P form.25 In our study, c-mpl+ ALL was found to be nonresponsive to TPO. Such results might be related to modification at the level of the receptor itself or to postreceptor defects. At the receptor level, it has been suggested that the K c-mpl isoform, which presents an extensive deletion of its intracellular domain, is unable to transduce TPO signals.27 Because we did not perform reverse transcription-polymerase chain reaction (RT-PCR) studies, it would be of interest to evaluate whether the nonfunctional c-mpl in ALL is the K form of the protein or is another splice variant.26
Inadequate serum TPO levels increase during induction chemotherapy in c-mpl functional AML blast cells. Serial serum TPO levels expressed after logarithmic transformation according to platelet counts in 4 AML patients treated with induction chemotherapy (left). Solid line represents the regression line computed in ALL patients after the first 2 weeks of induction chemotherapy (n = 38). Dashed lines depict the 95% confidence limits of this regression. Flow cytometry analyses of c-mpl expression at diagnosis in blast cells of the 4 AML patients (right). Filled histograms represent negative controls.
Inadequate serum TPO levels increase during induction chemotherapy in c-mpl functional AML blast cells. Serial serum TPO levels expressed after logarithmic transformation according to platelet counts in 4 AML patients treated with induction chemotherapy (left). Solid line represents the regression line computed in ALL patients after the first 2 weeks of induction chemotherapy (n = 38). Dashed lines depict the 95% confidence limits of this regression. Flow cytometry analyses of c-mpl expression at diagnosis in blast cells of the 4 AML patients (right). Filled histograms represent negative controls.
At the postreceptor level, TPO engagement of c-mpl—a receptor lacking intrinsic tyrosine kinase activity—leads to the stimulation of multiple intracellular circuits, including the phosphorylation and activation of Jak-2 with downstream phosphorylation of its major target protein, the transcriptional activator STAT.28 Of interest, alterations of c-mpl-mediated transduction and gain-of-function mutations of Jak-2 giving hematopoietic precursor proliferative and survival advantages have been reported in patients with MDS.29-31 Thus, even though no oncogenic variants or activating mutations of the C-MPL gene have been reported in AML, it would be of interest to evaluate whether the deregulated c-mpl signaling pathway in AML patients contributes to the leukemic process.
In adults with AML, increased c-mpl mRNA expression has been reported to be an adverse prognostic factor associated with shorter complete remission duration and unfavorable cytogenetics.24,26,32,33 In addition, in patients with refractory anemia with excess blasts and in those with refractory anemia with excess blasts in transformation, c-mpl expression was correlated with poor survival because of leukemic transformation.24 Thus, it remains to be determined whether the adverse prognostic factor of c-mpl expression in these diseases is associated with the presence of a functional c-mpl receptor that uses serum endogenous TPO as a leukemic growth factor, as suggested by our study.
Prepublished online as Blood First Edition Paper, November 29, 2005; DOI 10.1182/blood-2005-06-2552.
Supported in part by grants 7.4592.02 and 7.4553.04 from “Télévie,” Belgian National Scientific Research Fund (FNRS), and by grants from the Lambeau-Marteau Foundation, the Wajnman-Mandelbaum Foundation, Een Häerz fir Kriibskrank kanner, and the Foundation “Aide aux Enfants Atteints d'un Cancer,” Luxemburg, Belgium.
The publication costs of this article were defrayed in part by page charge payment. Therefore, and solely to indicate this fact, this article is hereby marked “advertisement” in accordance with 18 U.S.C. section 1734.
We thank Dr Anne Uyttebroeck for patient samples, Dr Jasmine Parma for initial PCR assays, and Geneviève Sturbois for advice on statistical analysis.

This feature is available to Subscribers Only
Sign In or Create an Account Close Modal