Abstract
Platelet-derived growth factor D-chain (PDGF-D) is the newest member of the PDGF family of mitogens and chemoattractants expressed in a wide variety of cell types, including vascular smooth muscle cells (SMCs). The molecular mechanisms regulating PDGF-D transcription are not known. Primer extension analysis mapped a single transcriptional start site to the ccAGCGC motif with several potential Ets motifs located upstream. Ets-1, but not Ets-1 bearing only the DNA-binding domain, activates the PDGF-D promoter and mRNA expression in SMCs. Ets site D3 (–470GGAT–467) is singly required for basal and Ets-1–inducible PDGF-D promoter-dependent expression. D3 supports the interaction of endogenous and recombinant Ets-1 and Sp1. Sp1, like Ets-1, induces PDGF-D transcription and mRNA expression, which is blocked by mutant Ets-1. H2O2 stimulates Ets-1, but not Sp1, and activates D3-dependent PDGF-D transcription. Ets-1 and Sp1 siRNA block peroxide-inducible PDGF-D expression. Angiotensin II (ATII) induction of PDGF-D and Ets-1 was blocked by prior incubation of the cells with PEG-catalase, but not BSA, indicating that ATII-inducible Ets-1 and PDGF-D expression is mediated via H2O2. Thus, 2 separate trans-acting factors regulate PDGF-D transcription, alone and in response to oxidative stress.
Introduction
Platelet-derived growth factor (PDGF) is a family of growth regulatory molecules that serves as key regulators of proliferation and migration in cells of mesenchymal origin,1 including vascular smooth muscle cells (SMCs). These cells express and respond to PDGF via high-affinity cell surface receptors (α and β).2 PDGFs play an important role in blood vessel development and in the pathogenesis of atherosclerosis and restenosis after balloon angioplasty.1-5 In addition to the classic PDGFs (PDGF-A and PDGF-B), identified more than 2 decades ago, 2 novel PDGF chains (PDGF-C and PDGF-D) have recently been described.6
The human PDGFD gene is located on chromosome 11q22.3 and spans 200 kb of gDNA. It encodes a polypeptide of 370 amino acid residues, which unlike PDGF-A and -B, appears to only homodimerize but not heterodimerize with other PDGF chains. PDGF-DD is secreted as a latent dimer that requires activation by proteolytic cleavage.6-9 PDGF-D mRNA (4 kb) is widely expressed in organs such as the heart, pancreas, kidney, and ovary.7,10,11 PDGF-D is also expressed in small and large vessel-derived endothelial cells in culture,2 although its expression in intact vessels is not fully established. Recent studies have shown that PDGF-DD promotes tumor growth by accelerating tumor cell proliferation and stimulating tumor neovascularization.10,12,13 Furthermore, PDGF-D was shown to increase macrophage recruitment, interstitial fluid pressure as well as the maturation of blood vessels during angiogenesis.14 PDGF-D does not appear to be regulated by hypoxic conditions, or VEGF-C, fibroblast growth factor-1, or tumor necrosis factor-α, at least in human endothelial cells.2 The molecular mechanisms involved in the regulation of PDGF-D expression at the level of transcription, however, are yet to be elucidated.
Here we report the first isolation and functional characterization of the PDGF-D promoter. Basal and inducible PDGF-D transcription is regulated by the winged helix-turn-helix factor and prototypic Ets family member, Ets-115 in vascular SMCs via the –470GGAT–467 motif in the PDGF-D promoter. This element (D3) also serves as a novel cis-acting element for the zinc finger transcription factor Sp1.16 H2O2 activates PDGF-D transcription at nanomolar concentrations in SMCs in a manner critically dependent on D3 and the presence of both Ets-1 and Sp1. We also demonstrate here that angiotensin II (ATII)–inducible Ets-1 and PDGF-D expression is mediated via the endogenous generation of H2O2.
Materials and methods
Plasmid constructs
To generate the p1168PDGF-Dluc construct, about 1.3 kb of fragment containing the promoter region of the PDGFD gene was amplified by polymerase chain reaction (PCR) with human gDNA and the according primers (upstream: 5′-GAGCTAGCG AGA ATC CCA AAA GCC TCA A-3′; downstream: 5′-CTCTCGAGG CGG GGT TGC AGA AGT GT-3′, which contain NheI and XhoI restriction enzyme sites [underlined]). The amplified fragment was cloned into the luciferase reporter vector pGL3-basic (Promega, Madison, WI) between the NheI and XhoI restriction sites. Mutagenesis of the Ets-1–binding site on –1168/+185PDGF-D promoter was performed using the Quick Change site-directed mutagenesis kit (Stratagene, LaJolla, CA).
Cell culture
Primary rat aortic SMCs and bovine aortic endothelial cells were obtained from Cell Applications (San Diego, CA) and cultured in Waymouth and DMEM (Invitrogen, Carlsbad, CA), respectively, containing 10% fetal bovine serum, 10 U/mL penicillin, and 10 μg/mL streptomycin at 37°C in a humidified atmosphere of 5% CO2/air. Cells were passaged every 3 to 4 days in 75-cm2 flasks by first rinsing twice with PBS (pH 7.4), and then incubating with 0.05% trypsin, 0.02% EDTA in HBSS (BioWhittaker, Walkersville, MD) for 3 minutes at 37°C prior to resuspending in growth medium. Cells were not used in experiments beyond passage 8.
Primer extension
Primer extension was performed using the Primer Extension System-AMV Reverse Transcriptase according to manufacturer's (Promega) protocol. Total RNA from human primary SMCs was extracted using TRIzol reagent. Total RNA (5 μg) was used in the primer extension reaction. The 2 sets of PDGF-D primers used in the experiments are located 5′ to the translational start site ATG of human PDGF-D; primer A: 5′-TCG CTG TGC TAA TCG CCG AGC TCT C-3′, primer B: 5′CGC CGC CCT GCG CTC TCG CCG CCT G-3′.
Transient transfection and luciferase assays
SMCs in 100-mm culture dishes at 60% to 70% confluence were transfected with 10 μg PDGF-D promoter reporter vector together with the indicated amount of Ets-1 or Sp1 expression vectors using FuGENE6 (Roche Molecular Biochemicals, Indianapolis, IN). For agonist studies, SMCs were incubated in serum-free media for 6 hours before transfection of plasmids and treatment with H2O2. Luciferase activity was quantified 24 hours after transfection using the dual luciferase assay system (Promega).
Preparation of nuclear extracts
SMCs were washed twice with cold PBS and scraped off the plates. The cells were centrifuged at 340 g for 15 minutes at 4°C; the pellets were resuspended in cold PBS and transferred to Eppendorf tubes. The cell suspension was repelleted using a microfuge at 4000 g for 60 seconds at 4°C. The cells were lysed by incubation in buffer A (10 mM HEPES, pH 7.9, 1.5 mM MgCl2, 10 mM KCl, 0.5% Nonidet P-40, 1 mM dithiothreitol [DTT], 0.5 mM phenylmethylsulfonyl fluoride [PMSF], 10 mg/mL leupeptin, 4 mg/mL aprotinin) for 5 minutes on ice. The suspension was recentrifuged at full speed for 40 seconds, and the pellet was resuspended with buffer C (20 mM HEPES, pH 8, 1.5 mM MgCl2, 420 mM NaCl, 0.2 mM EDTA, 1 mM DTT, 0.5 mM PMSF, 10 mg/mL leupeptin, 4 mg/mL aprotinin). After a spin at full speed, an equal volume of buffer D (20 mM HEPES, pH 7.9, 100 mM KCl, 0.2 mM EDTA, 20% glycerol, 1 mM DTT, 0.5 mM PMSF, 10 mg/mL leupeptin, 4 mg/mL aprotinin) was added to the supernatant. Extracts were immediately frozen on dry ice and stored at –80 °C until use.
Electrophoretic mobility shift assay
SMC nuclear extracts or recombinant Ets-1, Sp1 protein were incubated with the indicated 32P-labeled double-stranded oligonucleotides for 20 minutes on ice. Where indicated, nuclear extracts were incubated with unlabeled double-stranded oligonucleotide or antibody for 10 minutes prior to the addition of the probe. The Ets-1 antibody did not bind Sp1 in isolation, nor did the Sp1 antibody bind to Ets-1 in isolation. The samples were resolved by 6% non–denaturing polyacrylamide gel electrophoresis and visualized by autoradiography.
Extraction of total RNA and RT-PCR
SMCs were transfected with 30 μg Sp1 or Ets-1 expression vector, respectively, using FuGENE6 transfection reagent. For agonist experiments SMCs were treated with H2O2 or ATII. The cells were washed twice with cold PBS, and total RNA was extracted with TRIzol reagent. Total RNA (5 μg) was used for the reverse transcriptase (RT) experiment. cDNA (1 μL) from the RT experiment was amplified for PDGF-D and Ets-1 fragment in a final volume of 20 μL. The primer pair for amplifying PDGF-D was: forward, 5′-GTG CAG AGT CCT ACT ATT CCC-3′, and reverse, 5′-GAG GTG GTC TTG AGC TGC AG-3′. PCR was performed by denaturing at 94°C for 5 minutes; cycling 30 times at 94°C for 1 minute, 59°C for 1 minute, 72°C for 1 minute; and extending at 72°C for 7 minutes, producing a 918-bp PDGF-D fragment. Amplification of glyceraldehyde-3-phosphate dehydrogenase (GAPDH) served as the internal control. The primers for GAPDH were: forward, 5′-ACC ACA GTC CAT GCC ATC AC-3′, and reverse, 5′-TCC ACC ACC CTG TTG CTG TA-3′. The amplification conditions for GAPDH were: 94°C, 1 minute; 94°C, 30 seconds, 58°C, 10 seconds, 72°C, 1 minute for 20 cycles; 72°C, 4 minutes, producing a 465 bp-fragment. The amplification conditions for Ets-1 were: 94°C, 1 minute; 94°C, 30 seconds, 55°C, 30 seconds, 72°C, 1 minute for 32 cycles; 72°C, 7 minutes; producing a 327-bp fragment. Ets-1 primers were: forward, 5′-CCT CTC ATT CCT GCC GC-3′, and reverse, 5′-CCT GTG GTG TGT AGC CC-3′. The primers for Sp1 were: forward, 5′-CTT GAC CTC ACA GCC ACA CAA CT-3′, and reverse, 5′-GAC AGC TTG CTG GAG T-3′. The amplification conditions for Sp1 were: 98°C, 30 seconds; 52°C, 30 seconds, 72°C, 1 minute 20 seconds for 33 cycles; 72°C, 4 minutes, generating a 432-bp amplicon.
Cell extraction and Western blot analysis
SMCs (60%-70% confluent) in 100-mm Petri dishes were arrested for 24 hours in serum-free medium before being treated with agonist. SMCs were washed twice with cold PBS, scraped, and suspended in RIPA buffer containing protease inhibitors (150 mM NaCl, 50 mM Tris-HCl, pH 7.5, 1% deoxycholate, 0.1% Triton X-100, 5 mg/mL leupeptin, 100 mM PMSF, 10% Trasylol, 0.5 M EDTA). The suspension was spun at maximum speed at 4°C for 10 minutes, the supernatant was collected, and protein concentration was assayed by BCA protein assay kit (Pierce, Rockford, IL). Cell lysates (15 μg) were resolved in 10% sodium dodecyl sulfate–polyacrylamide gel electrophoresis (SDS-PAGE) and transferred onto Immobilon PVDF transfer membranes (Millipore, New Bedford, MA). Membranes were blocked overnight at 4°C with 5% skim milk in 0.05% Tween-20/PBS, then incubated with the appropriate primary antibody (PDGF-D and Ets-1 at 1:300-1000 dilution) for 1 hour at room temperature. Swine anti–rabbit or rabbit anti–goat IgG conjugated with horseradish peroxidase (HRP) was then incubated for 1 hour. In peptide blockade experiments, the primary PDGF-D antibody (1:300, 0.6 μg/mL final concentration) was incubated alone or in combination with blocking PDGF-D peptide (sc-23573P; 3.3 μg/mL final concentration) for 1 hour at 37°C prior to incubation with the filters, in accordance with the manufacturer's instructions (Santa Cruz Biotechnology, Santa Cruz, CA). Membranes were incubated with chemiluminescence (Perkin Elmer Life Sciences, Shelton, CT) then exposed to film for 1 to 10 minutes.
Real-time quantitative PCR
Total RNA was prepared using TRIzol reagent, and 2 μg was used for synthesis of cDNA in 20 μL in the presence of 0.5 μg oligo dT primer (Sigma, St Louis, MO), 1 μM dNTP mix (Roche Molecular Biochemicals), 40 U RNAse inhibitor (Promega), 200 U SuperScript II reverse transcriptase (Invitrogen), and 4 μL 5 × first-strand buffer (Invitrogen) in DEPC-treated water. Reactions were allowed to proceed at 42°C for 50 minutes, then 70°C for 15 minutes. Real-time quantitative PCR was carried out using ABI PRISM7700 Sequence Detection System in a final volume of 25 μL containing 1 μL cDNA, 12.5 μL 2 × SYBR Green master mix (Applied Biosystems, Weiterstadt, Germany), 0.5 μM primers (Sigma) in DNAse-free water. Primers used were: rat PDGF-D: (forward) 5′-ATC GGG ACA CTT TTG CGA CT-3′, (reverse) 5′-GTG CCT GTC ACC CGAATG TT-3′; rat GAPDH: (forward) 5′-ACA AGA TGG TGA AGG TCG GTG-3′, (reverse) 5′-AGA AGG CAG CCC TGG TAA CC-3′. The PCR conditions were: 50°C for 2 minutes followed by 40 cycles at 95°C for 15 seconds and 60°C for 1 minute. Product sizes were: PDGF-D (129 bp) and GAPDH (69 bp).
siRNA
SMCs (∼60%-70% confluent) were incubated in serum-free medium for 24 hours, then transfected with siRNA (Qiagen, Valencia, CA) targeting endogenous rat Ets-1 or rat Sp1 for 16 hours. Cells were then treated with H2O2 for 8 hours before total RNA was extracted. The Ets-1 siRNA sequence was 5′-r(GGA CAA GCC UGU CAU UCC U)d(TT)-3′ and the complementary strand was 5′-r(AGG AAU GAC AGG CUU GUC C)d(TT)-3′. The Sp1 siRNA sequence was 5′-r(GGA ACA GAG UCC CAA CAG U)d(TT)-3′ and the complementary strand was 5′-r(ACU GUU GCC ACU CUG UUC C)d(TT)-3′. The irrelevant siRNA sequence was 5′-r(GCG AGU AGC GCU AGG AAG U)d(TT)-3′ and complementary strand was 5′-r(ACU UCC UAG CGC UAC UCG C)d(TT)-3′. The siRNA, used at a final concentration of 0.2 μM, corresponds to 3 μg/mL.
ChIP analysis
Human SMCs grown in 100-mm Petri dishes (∼80%-90% confluent) were washed with PBS, pH 7.4, before chromatin immunoprecipitation17 (ChIP) using the appropriate antibody. PCR was performed in 1 mM MgCl2, 0.1 mM dNTP, 0.1 μM primers, and 1 U platinum Taq polymerase (Invitrogen). Amplification conditions were as follows: 94°C for 2 minutes; 40 cycles of 94°C for 30 seconds, 54°C for 10 seconds, and 72°C for 30 seconds; with another extension time of 4 minutes. PDGF-D promoter containing the Ets-1– and Sp1-binding sites was amplified using 2 sets of primers: ChipPDGFDF1 primer 5′-TGATAGATGGAGGGACTCAAG-3′ and ChipPDGFDR1 primer 5′-CAGGAAACAAACTCGCCAG-3′; ChipPDG-FDF2 primer 5′-CATCAGTCTCGACCTTTTCTC-3′ and ChipPDGFDR2 primer 5′-GCTCAGGAAACAAACTCGC-3′. The expected PCR products for primer sets 1 and 2 were 360 and 390 bp, respectively, and confirmed by sequencing.
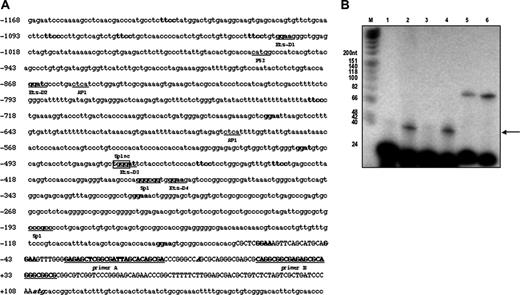
Human PDGF-D promoter analysis. (A) Putative Ets-binding sites (ggaa, ggat, ttcc, atcc) are indicated in bold letters. The 4 Ets-binding sites used in mutational analysis (Figure 3A, Ets-D1, D2, D3, D4) are shown by bold and underlined letters. One nonconsensus (n.c.) Sp1-binding site crossing with Ets-D3 is shown with frame and indicated as Sp1nc. The translational start site is italicized and bolded (CCAGCGC). The primers used for primer extension are shown by bold capital letters and labeled as primer A and B. Capital letters represent 5′-untranslated regions (UTRs). (B) Electrophoretic analysis of 32P-labeled primer extension products. fX174 HinfI DNA markers (lane M) and the products from primer extension reactions using control and PDGF-D primers were separated by electrophoresis on an 8% denaturing polyacrylamide gel. Length (in base pairs) for each DNA HinfI fragment in the marker lane is indicated next to the corresponding band on the autoradiograph. In lanes 1 and 2 the source of the RNA is from early passage SMCs (passage 5) and lanes 3 and 4 from later passage (passage 8) SMCs. In lanes 1 and 3, primer A was used and in lanes 2 and 4 primer B was used. In lanes containing kanamycin-positive control RNA (lane 5 with 2 ng and lane 6 with 5 ng), the top band (87 bp) represents the major cDNA product using the control RNA. The bottom bands (25 bp) in lanes 2 through 6 represent the 32P-labeled primers. The data in panel B are representative of at least 2 independent experiments. The arrow indicates a single 40-bp extension product using primer B.
Human PDGF-D promoter analysis. (A) Putative Ets-binding sites (ggaa, ggat, ttcc, atcc) are indicated in bold letters. The 4 Ets-binding sites used in mutational analysis (Figure 3A, Ets-D1, D2, D3, D4) are shown by bold and underlined letters. One nonconsensus (n.c.) Sp1-binding site crossing with Ets-D3 is shown with frame and indicated as Sp1nc. The translational start site is italicized and bolded (CCAGCGC). The primers used for primer extension are shown by bold capital letters and labeled as primer A and B. Capital letters represent 5′-untranslated regions (UTRs). (B) Electrophoretic analysis of 32P-labeled primer extension products. fX174 HinfI DNA markers (lane M) and the products from primer extension reactions using control and PDGF-D primers were separated by electrophoresis on an 8% denaturing polyacrylamide gel. Length (in base pairs) for each DNA HinfI fragment in the marker lane is indicated next to the corresponding band on the autoradiograph. In lanes 1 and 2 the source of the RNA is from early passage SMCs (passage 5) and lanes 3 and 4 from later passage (passage 8) SMCs. In lanes 1 and 3, primer A was used and in lanes 2 and 4 primer B was used. In lanes containing kanamycin-positive control RNA (lane 5 with 2 ng and lane 6 with 5 ng), the top band (87 bp) represents the major cDNA product using the control RNA. The bottom bands (25 bp) in lanes 2 through 6 represent the 32P-labeled primers. The data in panel B are representative of at least 2 independent experiments. The arrow indicates a single 40-bp extension product using primer B.
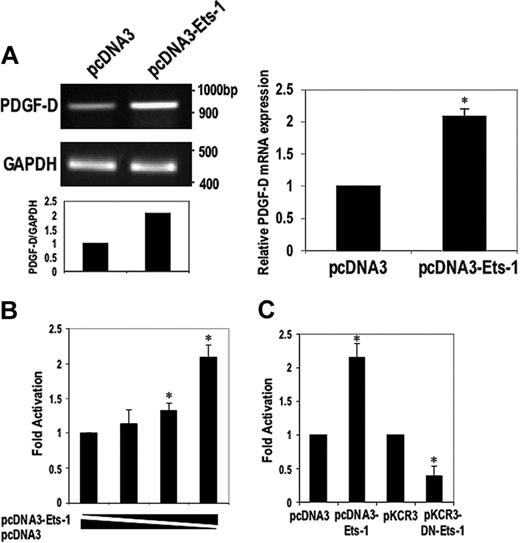
Ets-1 induces PDGF-D expression from mRNA level and transcriptional level. (A) SMCs were transfected with 30 μg Ets-1 expression vector and backbone vector pcDNA3. After 24 hours, total RNA was extracted and semiquantitative RT-PCR (left) or real-time PCR (right) was performed. (B) SMCs were cotransfected with 50, 125, and 500 ng of the Ets-1 expression vector or the corresponding amount of pcDNA3 together with 10 μg p1168PDGF-Dluc plasmid. (C) SMCs were cotransfected with 3 μg Ets-1 plasmid or dominant-negative Ets-1 (DN-Ets-1), respectively, together with 10 μg p1168PDGF-Dluc. Luciferase activity was determined after 24 hours. The data are representative of at least 2 independent experiments. Error bars represent SEM performed in duplicate or triplicate. *P < .05 relative to control using Student t test.
Ets-1 induces PDGF-D expression from mRNA level and transcriptional level. (A) SMCs were transfected with 30 μg Ets-1 expression vector and backbone vector pcDNA3. After 24 hours, total RNA was extracted and semiquantitative RT-PCR (left) or real-time PCR (right) was performed. (B) SMCs were cotransfected with 50, 125, and 500 ng of the Ets-1 expression vector or the corresponding amount of pcDNA3 together with 10 μg p1168PDGF-Dluc plasmid. (C) SMCs were cotransfected with 3 μg Ets-1 plasmid or dominant-negative Ets-1 (DN-Ets-1), respectively, together with 10 μg p1168PDGF-Dluc. Luciferase activity was determined after 24 hours. The data are representative of at least 2 independent experiments. Error bars represent SEM performed in duplicate or triplicate. *P < .05 relative to control using Student t test.
Cell proliferation assay
SMCs were seeded into 96-well plates, and after 48 hours, incubated in serum-free media for 24 hours to induce growth arrest. The cells were exposed to H2O2 in medium containing 0.5% FBS in the presence and absence of goat PDGF-D IgG (Santa Cruz Biotechnology) or goat IgG (2 μg/200 μL/well; Santa Cruz Biotechnology). After 3 days, the cells were detached with trypsin-EDTA and counted in an automated Coulter Z1 counter.
Results
Isolation of the PDGF-D promoter and identification the transcriptional start site by primer extension analysis
Since the identification of PDGF-D 5 years ago,7,8 its promoter has not been functionally characterized in any cell type. For this purpose, approximately 1.3 kb of human PDGF-D sequence (–1168/+185 of GenBank sequence AF336376) was amplified from a human genomic DNA library by PCR. The nucleotide sequence immediately upstream of the predicted transcriptional start site is G+C rich and lacks a typical TATA box. To determine the authentic transcription start site in the PDGFD gene, we performed primer extension analysis using total RNA extracted from primary SMCs and 2 sets of primers (Figure 1A). We observed a single 40-bp extension product using primer B (Figure 1B), which maps the start site to CCAGCGC, located 109 bp upstream of ATG, suggesting an unusually short 5′ untranslated sequence when compared to the PDGFA and PDGFB genes.18 This transcriptional start site is consistent with the initiator consensus Py Py A+1 N T/A Py Py (where Py denotes pyrimidine)19 where RNA synthesis usually begins at the adenosine. The 5′-flanking region was searched for known transcriptional factor-binding elements using MatInspector 2.0 software.20 This analysis revealed potential sites for Sp1, AP1, and p53 and no less than 17 separate potential Ets-binding motifs (5′-GGAA-3′/5′-GGAT-3′ or 5′-TTCC-3′/5′-ATCC-3′; Figure 1A).
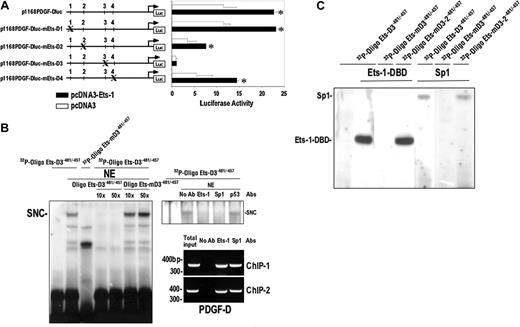
Element D3 mediates basal and Ets-1–inducible PDGF-D promoter activity and binds both endogenous and recombinant Ets-1 and Sp1. (A) Mutational analysis of Ets-binding sites. SMCs were cotransfected with 1 μg pcDNA3-Ets-1 or pcDNA3 plasmid together with 10 μg p1168PDGF-Dluc or p1168PDGF-Dluc bearing mutated Ets-binding sites D1-4. The locations of the mutations in the PDGF-D promoter are shown in Figure 1A. (B) EMSA (left and top right panels) was performed by incubating 32P-OligoEts-D3–481/–457 bearing wild-type or mutant Ets element D3 and nuclear extracts of SMCs. A 10 × and 50 × molar excess of unlabeled Oligo Ets-D3–481/–457 wild-type or mutant type Oligo Ets-D3–481/–457 was used in competition analysis. Polyclonal antibodies to Sp1, Ets-1, or p53 (0.5 μg) were incubated for 15 minutes prior to the addition of probe. SNC denotes specific nucleoprotein complex. ChIP analysis (right panels) was performed using 2 separate primer sets with antibodies to Ets-1 or Sp1 or no antibody. Antibodies to Ets-1 and Sp1 pulled down the PDGF-D promoter, which was then amplified to produce amplicons of 360 and 390 bp, respectively. The omission of an antibody did not support amplification of any product. NE indicates nuclear extracts. (C) Ets element D3 binds recombinant Ets-1 and Sp1. EMSA was performed with 32P-OligoEts-D3–481/–45732P-OligoEts-D3–481/–457 containing mutant Ets-D3 or Ets–D3-2 and recombinant Ets-1 (100 ng) or Sp1 (100 ng). Free probe was run off the gel. The data are representative of at least 2 independent experiments. Error bars represent SEM performed in duplicate or triplicate. *P < .05 relative to control using Student t test.
Element D3 mediates basal and Ets-1–inducible PDGF-D promoter activity and binds both endogenous and recombinant Ets-1 and Sp1. (A) Mutational analysis of Ets-binding sites. SMCs were cotransfected with 1 μg pcDNA3-Ets-1 or pcDNA3 plasmid together with 10 μg p1168PDGF-Dluc or p1168PDGF-Dluc bearing mutated Ets-binding sites D1-4. The locations of the mutations in the PDGF-D promoter are shown in Figure 1A. (B) EMSA (left and top right panels) was performed by incubating 32P-OligoEts-D3–481/–457 bearing wild-type or mutant Ets element D3 and nuclear extracts of SMCs. A 10 × and 50 × molar excess of unlabeled Oligo Ets-D3–481/–457 wild-type or mutant type Oligo Ets-D3–481/–457 was used in competition analysis. Polyclonal antibodies to Sp1, Ets-1, or p53 (0.5 μg) were incubated for 15 minutes prior to the addition of probe. SNC denotes specific nucleoprotein complex. ChIP analysis (right panels) was performed using 2 separate primer sets with antibodies to Ets-1 or Sp1 or no antibody. Antibodies to Ets-1 and Sp1 pulled down the PDGF-D promoter, which was then amplified to produce amplicons of 360 and 390 bp, respectively. The omission of an antibody did not support amplification of any product. NE indicates nuclear extracts. (C) Ets element D3 binds recombinant Ets-1 and Sp1. EMSA was performed with 32P-OligoEts-D3–481/–45732P-OligoEts-D3–481/–457 containing mutant Ets-D3 or Ets–D3-2 and recombinant Ets-1 (100 ng) or Sp1 (100 ng). Free probe was run off the gel. The data are representative of at least 2 independent experiments. Error bars represent SEM performed in duplicate or triplicate. *P < .05 relative to control using Student t test.
Ets-1 activates PDGF-D transcription and mRNA expression in vascular SMCs
The large number of putative Ets-binding sites in the PDGF-D promoter led us to investigate whether Ets-1 could regulate PDGF-D expression. SMCs were transfected with the CMV-based Ets-1 expression vector pcDNA3-Ets-1 or its backbone pcDNA3, and PDGF-D mRNA levels were assessed by semiquantitative RT-PCR and real-time PCR after 24 hours. Ets-1 increased PDGF-D expression as compared with the control plasmid, whereas levels of GAPDH remained unaltered (Figure 2A). We next performed transient cotransfection analysis in SMCs with plasmid p1168PDGF-Dluc, which was created by cloning the –1168/+185 PDGF-D promoter fragment into the promoterless reporter vector pGL3-basic upstream of Firefly luciferase cDNA, together with pcDNA3–Ets-1 or pcDNA3. Ets-1 activated PDGF-D promoter-dependent expression within 24 hours (Figure 2B). In contrast, CMV-based expression vectors for other Ets family members such as Fli-1 or PU.1 had no effect on the activity of the PDGF-D promoter (data not shown).
To further demonstrate the positive regulatory influence of Ets-1 on the PDGF-D promoter, we transfected the reporter vector with a plasmid generating a dominant-negative form of Ets-1 (DN-Ets-1), containing only the DNA-binding domain of Ets-1 and lacking the transactivation domain or its backbone pKCR3. This mutant form of Ets-1 failed to stimulate the PDGF-D promoter (Figure 2C). Instead, it repressed constitutive promoter-dependent reporter activity (Figure 2C), complementing our wild-type overexpression studies and suggesting that Ets-1 is required for basal PDGF-D expression.
Ets site D3 mediates basal activity of the PDGF-D promoter
To identify functional cis-acting elements for Ets-1 in the PDGF-D promoter, we introduced mutations in 4 Ets motifs in p1168PDGF-Dluc, by changing 5′-GGAA-3′ and 5′-GGAT-3′ motifs to 5′-TTCC-3′ and 5′-TTCG-3′, respectively. Ets-1, as expected, stimulated luciferase activity generated by p1168PDGF-Dluc after 24 hours (Figure 3A). It also stimulated the same-fold increase in activity from each mutant plasmid, except mutant D3 (Figure 3A), indicating that mutation of the –470GGAT–467 motif abrogates transactivation by Ets-1 (Figure 3A). To determine whether Ets-1 physically interacts with element D3, a 32P-labeled double-stranded oligonucleotide (32P-Oligo Ets-D3–481/–457) of 25 bp length spanning this element was used in electrophoretic mobility shift analysis (EMSA) with nuclear extracts from SMCs. This resulted in the formation of several nucleoprotein complexes that were abrogated by a 10- or 50-fold molar excess of unlabeled probe but not by the same fold excess of the unlabeled mutant probe (Figure 3B). Of all these complexes, however, the complex of slowest mobility was completely abolished when –470GGAT–467 motif was mutated (32P-Oligo Ets-mD3–481/–457; Figure 3B). This specific nucleoprotein complex (SNC) was eliminated by the presence of polyclonal anti–Ets-1 antibodies, and interestingly, also by antibodies to the zinc finger transcription factor Sp1, but not by antibodies to p53 (Figure 3B), thus suggesting co-occupancy of this region of the PDGF-D promoter by Ets-1 and Sp1. ChIP analysis using 2 independent primer sets provided compelling evidence that Ets-1 and Sp1 co-occupy this region in the authentic promoter (Figure 3B).
To extend these observations, we performed EMSA using 32P-Oligo Ets-D3–481/–457 with recombinant Sp1 and with Ets-1 bearing only the DNA-binding domain. Both proteins bound to this probe but failed to bind Oligo Ets-mD3–481/–457 (Figure 3C). In contrast, 32P-Oligo Ets-mD3-2–481/–457 bearing a mutation outside the –470GGAT–467 motif still bound each protein (Figure 3C).
Sp1 induces PDGF-D expression
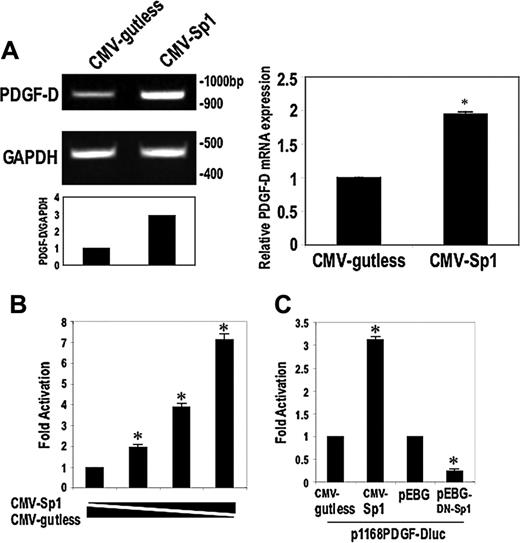
To determine whether Sp1 influences PDGF-D expression, we transfected SMCs with the Sp1 expression vector CMV-Sp1, or its backbone CMV-gutless, and assessed PDGF-D mRNA levels by RT-PCR or real-time PCR. Sp1 activated PDGF-D expression within 24 hours (Figure 4A). Cotransfection of CMV-Sp1 with p1168PDGF-Dluc increased luciferase reporter activity (Figure 4B), whereas cotransfection of a plasmid generating a dominant-negative form of Sp1 (pEBG-DN-Sp1) failed to stimulate the PDGF-D promoter and even repressed constitutive promoter-dependent reporter activity (Figure 4C). These data demonstrate that Sp1 regulates basal and inducible PDGF-D expression. The capacity of Sp1 to induce PDGF-D transcription extends the regulatory role played by this factor in its control of PDGF-A21 and PDGF-B22 expression.
Sp1 activation of PDGF-D transcription is dependent on Ets-1
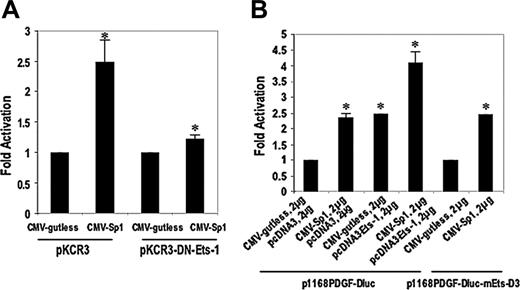
Because Ets-1 and Sp1 each activate the PDGF-D promoter, and a single element in the PDGF-D promoter supports the interaction of both factors, we performed cotransfection experiments to determine whether activation by one factor requires the other. CMV-Sp1, as expected, activated PDGF-D promoter-dependent luciferase activity within 24 hours (Figure 5A). However, Sp1 stimulation of PDGF-D promoter activity was greatly compromised by the presence of DN-Ets-1 (Figure 5A). Additional cotransfection experiments revealed that dual activation of the PDGF-D promoter by Ets-1 and Sp1 was additive and not synergistic (Figure 5B). That Sp1 was still able to transactivate p1168PDGF-Dluc bearing a mutation in D3 (Figure 5B) indicates that Sp1, unlike Ets-1 (Figure 3A), can use promoter elements other than D3 to drive PDGF-D transcription.
Sp1 activates PDGF-D transcription and mRNA expression. (A) SMCs were transfected with 30 μg Sp1 expression vector CMV-Sp1 or backbone vector CMV-gutless. Semiquantitative RT-PCR (left) or real-time PCR (right) was performed after 24 hours. (B) Transient cotransfection of CMV-Sp1 (1-3 μg) or the corresponding amount of CMV-gutless together with 10 μg p1168PDGF-Dluc to demonstrate Sp1 dependence. Promoter activity was assessed after 24 hours. Results are expressed as fold induction compared with backbone vector. (C) SMCs were cotransfected with 3 μg of Sp1 plasmid or dominant-negative Sp1 (pEBG-DN-Sp1), respectively, together with 10 μg p1168PDGF-Dluc. Luciferase activity was determined after 24 hours. The data are representative of at least 2 independent experiments. Error bars represent SEM performed in duplicate or triplicate. *P < .05 relative to control using Student t test.
Sp1 activates PDGF-D transcription and mRNA expression. (A) SMCs were transfected with 30 μg Sp1 expression vector CMV-Sp1 or backbone vector CMV-gutless. Semiquantitative RT-PCR (left) or real-time PCR (right) was performed after 24 hours. (B) Transient cotransfection of CMV-Sp1 (1-3 μg) or the corresponding amount of CMV-gutless together with 10 μg p1168PDGF-Dluc to demonstrate Sp1 dependence. Promoter activity was assessed after 24 hours. Results are expressed as fold induction compared with backbone vector. (C) SMCs were cotransfected with 3 μg of Sp1 plasmid or dominant-negative Sp1 (pEBG-DN-Sp1), respectively, together with 10 μg p1168PDGF-Dluc. Luciferase activity was determined after 24 hours. The data are representative of at least 2 independent experiments. Error bars represent SEM performed in duplicate or triplicate. *P < .05 relative to control using Student t test.
Sp1 activation of PDGF-D transcription is Ets-1 dependent. (A) SMCs were cotransfected with 2 μg CMV-Sp1 and backbone vector CMV-gutless together with 10 μg p1168PDGF-Dluc, with or without 2 μg dominant-negative Ets-1 (DN-Ets-1) and its backbone pKCR3. (B) CMV-Sp1 and/or pcDNA-Ets-1 (1 or 2 μg, as indicated) were transiently cotransfected into SMCs alone or simultaneously together with 10 μg p1168PDGF-Dluc. The data are representative of at least 2 independent experiments. Error bars represent SEM performed in duplicate or triplicate. *P < .05 relative to control using Student t test.
Sp1 activation of PDGF-D transcription is Ets-1 dependent. (A) SMCs were cotransfected with 2 μg CMV-Sp1 and backbone vector CMV-gutless together with 10 μg p1168PDGF-Dluc, with or without 2 μg dominant-negative Ets-1 (DN-Ets-1) and its backbone pKCR3. (B) CMV-Sp1 and/or pcDNA-Ets-1 (1 or 2 μg, as indicated) were transiently cotransfected into SMCs alone or simultaneously together with 10 μg p1168PDGF-Dluc. The data are representative of at least 2 independent experiments. Error bars represent SEM performed in duplicate or triplicate. *P < .05 relative to control using Student t test.
Ets-1 mediates H2O2 stimulation of PDGF-D expression
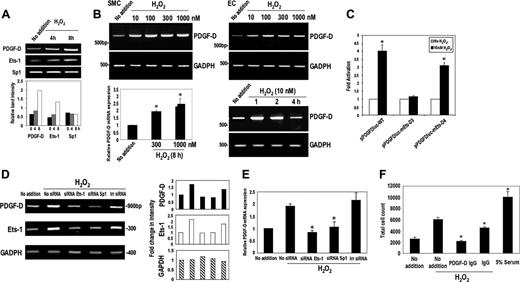
To demonstrate the pathophysiologic relevance of these findings, we treated growth-quiescent SMCs with 10 nM H2O2 for various times (0, 4, 8 hours). H2O2 increased Ets-1 and PDGF-D levels within 4 hours, whereas Sp1 expression remained unchanged (Figure 6A). H2O2 induced PDGF-D mRNA expression in SMCs (Figure 6B left panels) and bovine vascular endothelial cells (Figure 6B right panels). We next added H2O2 to SMCs that were transiently transfected with p1168PDGF-Dluc or Ets mutant (D3, D4) forms of p1168PDGF-Dluc, for 24 hours. H2O2 activated the wild-type PDGF-D promoter compared with untreated cells (Figure 6C). Similar effects were observed with cells transfected with p1168PDGF-Dluc bearing mutant site D4 (Figure 6C). H2O2, however, failed to induce the PDGF-D promoter containing mutant D3 (Figure 6C). To demonstrate the critical role played by endogenous Ets-1 in H2O2 modulation of PDGF-D expression, we used siRNA23 to silence Ets-1. Ets-1 siRNA blocked the induction of both Ets-1 and PDGF-D mRNA in response to H2O2 (Figure 6D). Sp1 siRNA also blocked H2O2-inducible PDGF-D expression (Figure 6D), whereas an irrelevant size-matched siRNA had no effect at the same concentration (Figure 6D). Real-time PCR analysis further demonstrated the Ets-1 and Sp1 dependence of inducible PDGF-D mRNA expression (Figure 6E). That Sp1 siRNA inhibited Ets-1 expression as well as itself is consistent with the existence of at least 5 Sp1 sites in the Ets-1 promoter.24,25
H2O2activation of PDGF-D requires Ets-1. (A) H2O2 increases levels of PDGF-D and Ets-1, but not Sp1. SMCs were treated with H2O2 (10 nM) for 0, 4, and 8 hours prior to extraction of total RNA and assessment of PDGF-D, Ets-1, and Sp1 levels by RT-PCR. (B) H2O2 increases PDGF-D mRNA expression in SMCs and bovine aortic endothelial cells (ECs) at various concentrations (10-1000 nM) and in a time-dependent manner (10 nM) by RT-PCR. Real-time PCR (bottom left panel) confirms H2O2 induction of PDGF-D mRNA expression. (C) H2O2 stimulates PDGF-D promoter activity. SMCs were transfected with 10 μg wild-type p1168PDGF-Dluc, p1168PDGF-Dluc–bearing mutant Ets-D3 element, or D4 elements. H2O2 was added to a final concentration of 10 nM. Luciferase activity was determined after 24 hours. (D) Ets-1 and Sp1 siRNA block Ets-1 activation of PDGF-D expression. SMCs were treated with 0.2 μM Ets-1 siRNA, Sp1 siRNA, and irrelevant (Irr) siRNA overnight, then incubated with 10 nM H2O2 for 8 hours prior to extraction of total RNA and RT-PCR. The histograms on the right refer to band intensity in the blots on the left. (E) Assessment of PDGF-D mRNA expression by real-time PCR. SMCs were treated with 0.2 μM Ets-1 siRNA, Sp1 siRNA, and irrelevant siRNA overnight then incubated with 10 nM H2O2 for 8 hours prior to extraction of total RNA and real-time PCR. (F) SMCs were exposed to H2O2 (100 nM) in the absence or presence of goat polyclonal PDGF-D antibodies or goat IgG and total cell counts were determined after 3 days using a Coulter counter. Alternatively the cells were exposed to 5% serum for control purposes. The data are representative of at least 2 independent experiments. Error bars represent SEM performed in duplicate or triplicate. *P < .05 relative to control using Student t test.
H2O2activation of PDGF-D requires Ets-1. (A) H2O2 increases levels of PDGF-D and Ets-1, but not Sp1. SMCs were treated with H2O2 (10 nM) for 0, 4, and 8 hours prior to extraction of total RNA and assessment of PDGF-D, Ets-1, and Sp1 levels by RT-PCR. (B) H2O2 increases PDGF-D mRNA expression in SMCs and bovine aortic endothelial cells (ECs) at various concentrations (10-1000 nM) and in a time-dependent manner (10 nM) by RT-PCR. Real-time PCR (bottom left panel) confirms H2O2 induction of PDGF-D mRNA expression. (C) H2O2 stimulates PDGF-D promoter activity. SMCs were transfected with 10 μg wild-type p1168PDGF-Dluc, p1168PDGF-Dluc–bearing mutant Ets-D3 element, or D4 elements. H2O2 was added to a final concentration of 10 nM. Luciferase activity was determined after 24 hours. (D) Ets-1 and Sp1 siRNA block Ets-1 activation of PDGF-D expression. SMCs were treated with 0.2 μM Ets-1 siRNA, Sp1 siRNA, and irrelevant (Irr) siRNA overnight, then incubated with 10 nM H2O2 for 8 hours prior to extraction of total RNA and RT-PCR. The histograms on the right refer to band intensity in the blots on the left. (E) Assessment of PDGF-D mRNA expression by real-time PCR. SMCs were treated with 0.2 μM Ets-1 siRNA, Sp1 siRNA, and irrelevant siRNA overnight then incubated with 10 nM H2O2 for 8 hours prior to extraction of total RNA and real-time PCR. (F) SMCs were exposed to H2O2 (100 nM) in the absence or presence of goat polyclonal PDGF-D antibodies or goat IgG and total cell counts were determined after 3 days using a Coulter counter. Alternatively the cells were exposed to 5% serum for control purposes. The data are representative of at least 2 independent experiments. Error bars represent SEM performed in duplicate or triplicate. *P < .05 relative to control using Student t test.
Autocrine/paracrine growth involving PDGF-D
We next performed proliferation experiments in which primary SMCs were exposed to H2O2 in the absence or presence of goat polyclonal PDGF-D antibodies or goat IgG. A 2-fold increase in SMC counts was observed after 3 days of incubation with H2O2 (Figure 6F). The mitogenic effect of H2O2 was abrogated by the presence of PDGF-D antibodies, whereas identical amounts of IgG had only a comparatively modest effect (Figure 6F). These findings suggest that an autocrine/paracrine growth stimulatory loop involving PDGF-DD mediates H2O2-inducible SMC proliferation, because PDGF-D does not appear to heterodimerize with other PDGF chains.
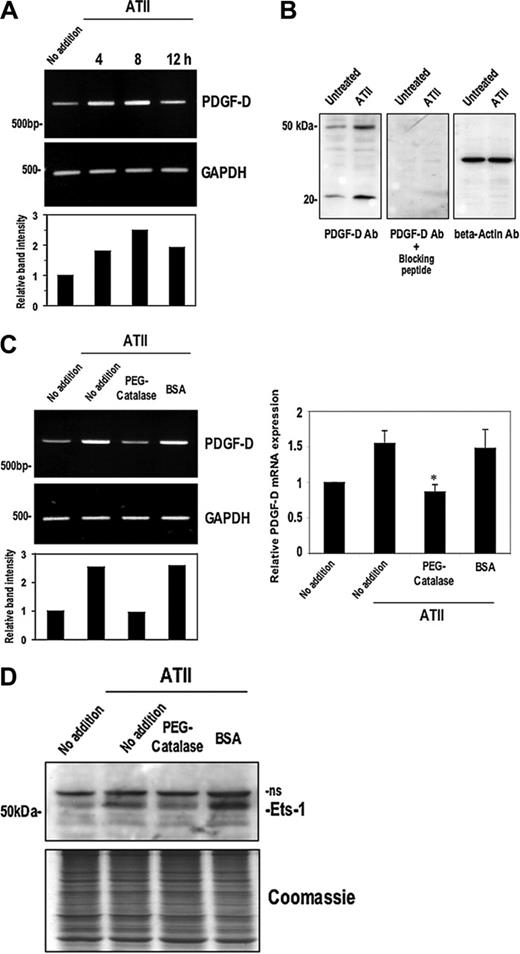
ATII is known to stimulate the production of reactive oxygen species from NAD(P)H oxidase in SMCs.26 Catalase, which rapidly converts H2O2 to H2O and O2, blocks the intracellular accumulation of H2O2 in SMCs exposed to ATII.27 Catalase has been used to block the ATII-inducible expression of pathophysiologically relevant genes such as monocyte chemoattractant protein-1 in SMCs.28 ATII (10–7 M) activated PDGF-D mRNA (Figure 7A) and protein (50 and 21 kDa forms; Figure 7B) expression in SMCs. Moreover, ATII induction of PDGF-D and Ets-1 were blocked by prior incubation of the cells with PEG-catalase (Figure 7C-D), indicating that ATII-inducible Ets-1 and PDGF-D expression is mediated via H2O2. These data are strongly supported by our earlier demonstration that H2O2 can directly activate Ets-1 and PDGF-D expression and that H2O2-inducible PDGF-D promoter-dependent expression is Ets-binding site dependent.
Discussion
Here we have functionally characterized the PDGF-D promoter. Primer extension analysis mapped the transcriptional start site to the ccAGCGC motif. Ets-1, but not a dominant-negative form of Ets-1, activates PDGF-D promoter-dependent reporter gene expression and endogenous PDGF-D mRNA expression. Mutational analysis demonstrated that D3 (–470GGAT–467) mediates both basal and Ets-1–inducible PDGF-D promoter-dependent expression. Binding analysis revealed that this site supports the interaction of endogenous Ets-1 and Sp1. H2O2 stimulates both Ets-1 and PDGF-D expression but has no effect on Sp1. PDGF-D transcription inducible by peroxide is critically dependent on the integrity of D3 and the presence of both Ets-1 and Sp1. Thus, the PDGF-D promoter is eminently regulated by Ets-1 and Sp1, alone and together, via D3, and responds positively to hydrogen peroxide through this element.
Oxidative stress induced as a consequence of excess reactive oxygen species may cause vascular dysfunction and subsequent cardiovascular disease via its effects on cell proliferation, differentiation, and cell death. Under conditions of oxidative stress, redox-sensitive transcription factor activation underpins the inducible expression of key genes altering vascular phenotype. Growth factors such as PDGF-A, PDGF-B, VEGF, and fibroblast growth factor are examples of genes regulated by oxidative stress. We have shown here that PDGF-D is regulated by H2O2 via Ets-1 and element D3. Moreover, our catalase blockade experiments demonstrate that ATII-inducible Ets-1 and PDGF-D expression is mediated via H2O2. These studies, performed in SMCs, have implications to other cell types. For example, Yasuda and colleagues reported that H2O2-inducible endothelial cell tubule formation and proliferation are processes mediated by increased levels of Ets-129 although in their study, actual Ets-1–dependent genes mediating H2O2-inducible angiogenesis were not identified. PDGF-D, which plays a permissive role in angiogenesis9 is, based on the present study, one such candidate. Although the broader biologic functions of PDGF-D have not been fully characterized, identification of key transcriptional modulators of its expression, such as Ets-1 and Sp1, will help us better understand its physiologic and pathophysiologic role and provide future opportunities for molecular intervention and inhibition.
ATII induces Ets-1 and PDGF-D via H2O2. (A) SMCs were treated with 10– 7M ATII for the times indicated prior to extraction of total RNA and assessment of PDGF-D mRNA expression by RT-PCR. (B) SMCs were treated with 10–7M of ATII for 4 hours and then total cell lysates were assessed for PDGF-D protein expression by Western blotting. Peptide blockade experiments involved incubation of the PDGF-D antibody solution with or without the PDGF-D peptide (sc-23573P; 3.3 μg/mL final) for 1 hour at 37°C prior to incubation with filters. (C) PDGF-D mRNA expression by RT-PCR (left) or real-time PCR (right) in SMCs incubated with ATII for 4 hours and pretreatment with either PEG-catalase (50 U/mL) or the equivalent amount of bovine serum albumin (BSA) for 18 hours. (D) Ets-1 expression in SMCs incubated with ATII for 4 hours and pretreatment with either PEG-catalase (50 U/mL) or the equivalent amount of BSA for 18 hours; ns denotes nonspecific band. The data are representative of at least 2 independent experiments. Error bars represent SEM performed in duplicate or triplicate. *P < .05 relative to control using Student t test.
ATII induces Ets-1 and PDGF-D via H2O2. (A) SMCs were treated with 10– 7M ATII for the times indicated prior to extraction of total RNA and assessment of PDGF-D mRNA expression by RT-PCR. (B) SMCs were treated with 10–7M of ATII for 4 hours and then total cell lysates were assessed for PDGF-D protein expression by Western blotting. Peptide blockade experiments involved incubation of the PDGF-D antibody solution with or without the PDGF-D peptide (sc-23573P; 3.3 μg/mL final) for 1 hour at 37°C prior to incubation with filters. (C) PDGF-D mRNA expression by RT-PCR (left) or real-time PCR (right) in SMCs incubated with ATII for 4 hours and pretreatment with either PEG-catalase (50 U/mL) or the equivalent amount of bovine serum albumin (BSA) for 18 hours. (D) Ets-1 expression in SMCs incubated with ATII for 4 hours and pretreatment with either PEG-catalase (50 U/mL) or the equivalent amount of BSA for 18 hours; ns denotes nonspecific band. The data are representative of at least 2 independent experiments. Error bars represent SEM performed in duplicate or triplicate. *P < .05 relative to control using Student t test.
Prepublished online as Blood First Edition Paper, September 27, 2005; DOI 10.1182/blood-2005-06-2377.
Supported by grants from the National Health and Medical Research Council (NHMRC), Australian Research Council (ARC), and New South Wales Department of Health. M.E. was supported by an NHMRC Institut National de la Santé et de la Recherche Médicale (INSERM) Research Fellowship. L.M.K. is a Senior Principal Research Fellow of the NHMRC.
M.Y.L. and M.E. contributed equally to this study.
The publication costs of this article were defrayed in part by page charge payment. Therefore, and solely to indicate this fact, this article is hereby marked “advertisement” in accordance with 18 U.S.C. section 1734.
We thank Prof Barbara J. Graves (Huntsman Cancer Institute, University of Utah) and Dr Mary Kavurma (Centre for Vascular Research, University of New South Wales) for providing recombinant Ets-1 (full-length and DNA-binding domain, respectively), and Dr Shane Thomas (Centre for Vascular Research, University of New South Wales) for helpful discussions.

This feature is available to Subscribers Only
Sign In or Create an Account Close Modal