Abstract
The heterogeneous clinical outcome of NC AML patients (pts), who constitute about 45% of AML pts and are assigned to an intermediate-risk category, likely reflects a biologic diversity. Although mutations in FLT3, MLL, CEBPA and NPM genes and overexpression of BAALC at diagnosis can stratify prognostically NC AML, novel approaches may improve the predictive value of these markers. cDNA microarrays were used recently to gain insight into the biologic and clinical heterogeneity of NC AML. Bullinger et al. (
NEJM 2004;350:1605
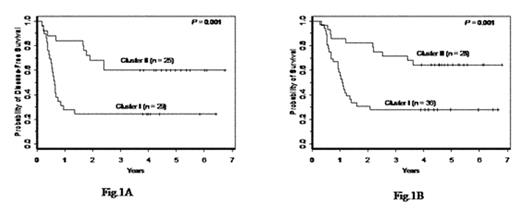
) reported a set of 133 genes represented by 149 cDNAs (Suppl. Table 6, www.ncbi.nlm.nih.gov/geo/, accession #GSE425) that separated NC AML into 2 cluster-based groups with significant differences in overall survival (OS) (Bullinger et al. Fig. 4D), albeit the number of pts analyzed was small. Hence, we sought to validate this signature in a larger, independent set of adults (n=64), <60 years, with primary NC AML, treated on CALGB 9621. Pretreatment samples were analyzed using Affymetrix U133 plus 2.0 GeneChips (Affymetrix, Santa Clara, CA). Normalization to a baseline array with median overall brightness and probe-set level expression computation were performed with dChip version 1.3. The log (base 2) of expression values were exported to BRB-ArrayTools v3.2.3 for analysis. Of the 133 genes from Bullinger et al., 81, represented by 157 probe sets, were on the Affymetrix chip and were expressed in ≥ 25% of our specimens. Hierarchical clustering, using the 157 probe sets, resulted in cluster I, corresponding to the poor-, and cluster II, corresponding to the good-outcome group in Bullinger et al. With a 4.7-year median follow-up, cluster I pts had lower estimated 5-year DFS (24% vs. 60%; P=.001; Fig. 1A) and OS (28% vs. 64%; P=.001; Fig. 1B) rates than cluster II pts. The 2 groups had similar complete remission rates (81% vs. 89%). With regard to pretreatment features, cluster I pts were younger (P=.06), had lower % skin infiltrates (P=.03), higher % marrow blasts (P=.06), different distribution of FAB subtypes (P=.04) with a high % M4, and higher incidence (67% vs. 12%) of FLT3 internal tandem duplication (ITD) (P<.001). A multivariable model including gene-expression cluster membership, FLT3 ITD status by Genescan analysis, and their interaction was fit to determine if the gene-expression signature added any information once accounting for FLT3 ITD status. A significant interaction of the gene-expression signature and FLT3 status was observed for DFS (P=.009) and OS (P=.01), where the gene-expression signature predicted DFS (P=.02) and OS (P=.02) only in pts with wild-type (wt) FLT3 but not in those with FLT3 ITD, who had adverse outcome irrespective of the gene-expression signature. Cluster I pts with wtFLT3 had >3x the risk of relapse and death than the corresponding cluster II pts. In conclusion, we independently validated for the first time the prognostic value of a gene-expression signature in NC AML. This expression profiling appears particularly useful in predicting outcome of pts lacking the prognostically adverse FLT3 ITD. Fig. 1A, Fig. 1B
Author notes
Corresponding author
2005, The American Society of Hematology
2005


This feature is available to Subscribers Only
Sign In or Create an Account Close Modal