Abstract
The iron-regulatory hormone hepcidin has been proposed as the mediator of anemia of inflammation (AI). We examined the acute and chronic effects of hepcidin in the mouse. Injections of human hepcidin (50 μg/mouse), but not of its diluent, induced hypoferremia within 4 hours. To examine the chronic effects of hepcidin, we implanted either tumor xenografts engineered to overexpress human hepcidin or control tumor xenografts into nonobese diabetic-severe combined immunodeficiency (NOD-SCID) mice. Despite abundant dietary iron, mice with hepcidin-producing tumors developed more severe anemia, lower serum iron, and increased hepatic iron compared with mice with control tumors. Hepcidin contributes to AI by shunting iron away from erythropoiesis and sequestering it in the liver, predominantly in hepatocytes. (Blood. 2005;105:1797-1802)
Introduction
Anemia of inflammation (AI), also referred to as anemia of chronic disease, is seen in a wide variety of inflammatory states including the acute systemic inflammatory response syndrome, chronic infections and inflammatory disorders, and some cancers.1-3 AI is characterized by normocytic or microcytic iron-refractory anemia, low serum iron (hypoferremia), and relatively preserved bone marrow iron.4 The pathogenic mechanisms that cause AI are not well understood but are thought to involve shortened erythrocyte lifespan with inadequate erythropoietic compensation due to the inhibitory effects of inflammatory cytokines on iron supply to the bone marrow, on erythropoietin production, and on the responsiveness of erythroid precursors to erythropoietin.3,5
Recent studies in humans and mice suggest that the ironregulatory hormone hepcidin may be the principal mediator of AI. Hepcidin is an acute-phase peptide6-8 whose overproduction leads to iron-limited erythropoiesis. Even without inflammation, transgenic mice overexpressing hepcidin suffered from severe ironrefractory anemia.9 Patients with large hepatic adenomas that autonomously produce hepcidin developed hypoferremia and severe iron-refractory anemia, and the resection of the adenomas reversed the hematologic abnormalities.10 The inflammatory stimuli lipopolysaccharide (LPS), Freund adjuvant, and turpentine increased the hepatic expression of mouse hepcidin-1.8,11-13 Within a few hours after the initiation of interleukin 6 (IL-6) infusion, human volunteers excreted increased amounts of urinary hepcidin and developed hypoferremia.8 In humans, urinary hepcidin excretion was increased in AI.7 In the aggregate, these studies suggest that AI may result from an inflammatory increase in hepcidin synthesis leading to hypoferremia and iron-refractory anemia.
Although the hepcidin-1 transgenic mouse provides important insight into the actions of hepcidin,9 it is not a suitable model for more detailed studies of the role of hepcidin in AI. The mice usually die at birth due to severe iron-deficiency anemia, presumably because hepcidin blocks placental iron transport, and the rare mosaic survivors require parenteral iron presumably because hepcidin overproduction blocks intestinal absorption of iron. Moreover, the existing models have emphasized the effects of hepcidin on iron absorption and have not specifically examined whether hepcidin can alter the distribution of iron among the various compartments. As an alternative, we introduced hepatoma xenografts into nonobese diabetic-severe combined immunodeficiency (NOD-SCID) mice and examined the superimposed effects of chronic hepcidin overproduction by engineering the tumors to express human hepcidin.
Materials and methods
Rodent diets
Mice were maintained on 1 of 2 normal iron diets: NIH 31 rodent diet (333 parts per million [ppm] iron; Harlan Teklad, Indianapolis, IN) or Prolab RMH breeder diet (440 ppm iron; PMI International, Brentwood, MO). Mice on either of these 2 diets are referred to as being on a high-iron diet. Prior to experiments, subsets of mice were switched to a diet containing less than 4 ppm iron (Harlan Teklad) and referred to as being on a low-iron diet.
Animal model for testing the effect of human hepcidin in vivo
C57/Bl6J mice were obtained from Charles River Laboratories (Wilmington, MA) or bred in our facility. Mice were maintained on a high-iron diet until 6 weeks of age when they were switched to a low-iron diet for 2 weeks. Human hepcidin-25 (hHep) was synthesized, refolded, and purified by reverse-phase high-performance liquid chromatography (HPLC) as previously described.14 Mice received a single intraperitoneal injection of 50 μg of hepcidin in 100 μL 0.01% acetic acid or 0.016% HCl. Control mice received diluent only. Mice were killed 4 hours later and blood and organs harvested.
Cell cultures
The cell lines included HepG2 and Hep3B (human hepatocellular carcinoma cell lines), Caco-2 (human colorectal adenocarcinoma cell line), and A549 (human lung carcinoma cell line), all from American Type Culture Collection (Manassas, VA). All cell lines were grown in Dulbecco modified Eagle medium (DMEM; Invitrogen, Carlsbad, CA), supplemented with 10% fetal bovine serum (FBS).
Construction of lentiviral expression vector
Human hHep cDNA (National Center for Biotechnology Information [NCBI] accession no. BC020612) containing the entire coding region was generated by polymerase chain reaction (PCR) with primers designed to introduce NheI and AgeI cleavage sites into the cDNA: 5′-ACAGCTAGCCAGACGGCACGATG and 5′-GGCACCGGTGGTAGGTTCTACGTC. The PCR was performed using human liver Marathon-ready cDNA as the template (Clontech, Palo Alto, CA). The PCR products were digested with NheI and AgeI and then inserted into the green fluorescence protein (GFP)-expressing lentiviral transfer vector, pCS-CG,15 generating pLENTI-Hepcidin. The inserted hHep cDNA sequence was confirmed by DNA sequencing.
Transfection of packaging cells and infection of target cells with the lentivirus
Human embryonic kidney 293T cells were cultured in DMEM supplemented with 10% FBS. Briefly, 5 × 10⁶ 293T cells were plated in 10-cm-diameter tissue dishes the day before transfection. The cells were transfected the next day using calcium phosphate reagent (Invitrogen). The amount of plasmid DNA used for making hHep-expressing or control GFP-expressing lentiviral vectors was as follows: either 6.25 μg of pLENTI-Hepcidin or pCS-CG, plus 2.5 μg of pVSV-G (vesicular stomatitis virus glycoprotein) pseudotyping construct and 6.25 μg of pΔVPR packaging construct, respectively. The cells were transfected overnight, washed, and replenished with fresh medium. Seventy-two hours later, the supernatants were harvested, filtered through a 0.45-μm filter, and stored in aliquots at -80°C.
HepG2, Hep3B, Caco-2, and A549 cells grown in DMEM + 10% FBS were then infected with undiluted recombinant lentivirus supplemented with hexadimethrin bromide (Sigma-Aldrich, St Louis, MO) at a final concentration of 10 μg/mL.
Western blot analysis of human hepcidin expression in transduced cells
Cells infected with recombinant lentivirus were grown for 1 to 2 days in DMEM + 10% fetal calf serum (FCS) and then switched to serum-free DMEM. Seventy-two hours later, the cells were centrifuged and the supernatant harvested. One milliliter of supernatant was lyophilized in a vacuum. The resulting pellets were dissolved in 35 μL of 5% acetic acid. Serum-free medium spiked with synthetic hepcidin-25 was used as a control. Seven microliters was then loaded into an acid-urea polyacrylamide gel for electrophoresis. Gels were silver stained or transferred to Immobilon-PSQ membranes (Millipore, Bedford, MA) and Western blotted for hepcidin as described previously.8
Purification of hHep from cell culture and mass determination
pLENTI-Hepcidin-infected HepG2 cells were switched to serum-free media for 3 days and then the supernatants were harvested. The supernatants were concentrated by microultrafiltration using a 1-kDa cutoff filter (Amicon Corporation, Danvers, MA) and then analyzed with HPLC as previously described.14 Matrix-assisted laser desorption/ionization time-of-flight mass spectrometry was performed on the purified hepcidin fraction (Microchemical Institute, Emory University School of Medicine, Atlanta, GA).
Animal model for studies of chronic hHep in vivo
All animal studies were approved by the Animal Research Committee at University of California, Los Angeles (UCLA). NOD.CB17-Prkdcscid/J (scid) mice were either purchased directly from Jackson Laboratory (Bar Harbor, ME) or bred in our facility for fewer than 4 generations under specific pathogen-free conditions. Mice were maintained on a high-iron diet. At the time of tumor cell injection, a group of mice was switched to the low-iron diet.
Prior to injection, HepG2 cells were harvested and washed 3 times with Hanks balanced salt solution (HBSS) and resuspended at a concentration of 2.5 × 10⁷ cells per mL. Eight-week-old mice were anesthetized with isoflurane delivered by nose cone. Using a 25-gauge needle, 200 μL of cells (5 × 10⁶ cells) or HBSS was injected subcutaneously into both dorsal flanks. The mice were divided into 4 groups based on what was injected: HBSS (no cells, n = 10 on low-iron diet and 12 on high-iron diet), HepG2 (unmodified HepG2 cells, n = 7 on low-iron diet and 11 on high-iron diet), GFP (HepG2 containing GFP vector, n = 3 on low-iron diet and 12 on high-iron diet), and hepcidin (HepG2 containing pLENTI-Hepcidin, n = 13 on low-iron diet and 17 on high-iron diet). In pilot experiments the HepG2 and GFP mice showed similar hepcidin production and hematologic changes; therefore, these mice were grouped together and referred to as control tumor mice. Mice were monitored twice weekly for signs of distress and to measure tumor size. Mice were killed with isoflurane and blood, organs (liver, spleen, duodenum, and bone marrow), and the tumors were collected.
Hepcidin mRNA assay
RNA from cultured cells or homogenized tissues was isolated using TRIzol (Invitrogen) following the manufacturer's instructions. Single-pass cDNA was synthesized using the iScript cDNA synthesis kit (Bio-Rad, Hercules, CA). The quantitative real-time polymerase chain reaction (qRT-PCR) was performed using primers and methods previously described.8 Human hepcidin and mouse hepcidin-1 mRNA concentrations were normalized to human glyceraldehyde 3-phosphate dehydrogenase (G3PDH) and mouse β-actin, respectively.
Urinary hepcidin assay
A subset of the mice was transferred to metabolic cages (Nalgene Labware, Rochester, NY) for up to 9 days for the collection of urine. Mice were housed in groups of 4 per cage and allowed access to low-iron food and water ad libitum. Urine was collected at 24- to 72-hour intervals. Human hepcidin concentration in urine was determined by dot immunoassay as previously described.8
Hematologic studies, iron measurements, and histology
Mice were anesthetized with isoflurane. Phlebotomy from the orbital sinus was used to obtain 150 μL of heparinized blood, which was assayed for hemoglobin (Hgb) using a kit (Pointe Scientific, Lincoln Park, MI) and hematocrit (Hct) using Fisherbrand capillary tubes (Fisher Scientific, Pittsburgh, PA) in a Clay Adams Autocrit Centrifuge (Clay-Adams, New York, NY). Blood was collected by cardiac puncture for fluorometric determination of serum iron as instructed by the manufacturer (Diagnostic Chemicals Limited, Oxford, CT). All blood samples were collected at the same time of day for each experiment. Bone marrow was either smeared directly on glass slides or fixed in 10% formalin first and then processed with HistoGel (Richard-Allan Scientific, Kalamazoo, MI).
Tissue iron content was determined using a method similar to that described by Barry and Sherlock.16 Tissue was dried, weighed, and treated for 30 minutes with 600 μL of a 1:1 (vol/vol) mixture of concentrated sulphuric and nitric acids. A blank was treated similarly. After the residue had cooled, it was transferred to a 15-mL tube and iron-free water was added to a final volume of 10 mL. One milliliter of this solution was used to measure total iron using bathophenanthroline sulphonate. Because this method measures all iron, heme and nonheme, care was taken to exsanguinate mice prior to organ harvest to decrease the background from hemoglobin.
For histology, tissues were fixed in 10% formalin, embedded in paraffin, sectioned, and mounted on slides for staining with hematoxylin and eosin or Perl Prussian blue stain to detect storage iron. Bone marrow smears were stained with Perl Prussian blue. Tissue or bone marrow iron was estimated on a scale from 0 (no blue staining seen) to 3 (diffusely blue) by a reader not aware of the donor mouse group. All images were obtained using an Eclipse E600 microscope (Nikon USA, Melville, NY) fitted with a SPOT RT Color digital camera (Diagnostic Instruments, Sterling Heights, MI). Images were captured using SPOT software (Diagnostic Instruments) and cropped and magnified using Photoshop (Adobe Systems, San Jose, CA). Tissues were imaged with Nikon Plan APO 10 ×/0.45 (Figure 5A,B) or 40 ×/0.95 (Figures 5C,D and Figure 6). Blood smears (Figure 5E,F) were imaged with a Nikon Plan Fluor 100 ×/1.30 oil objective lens.
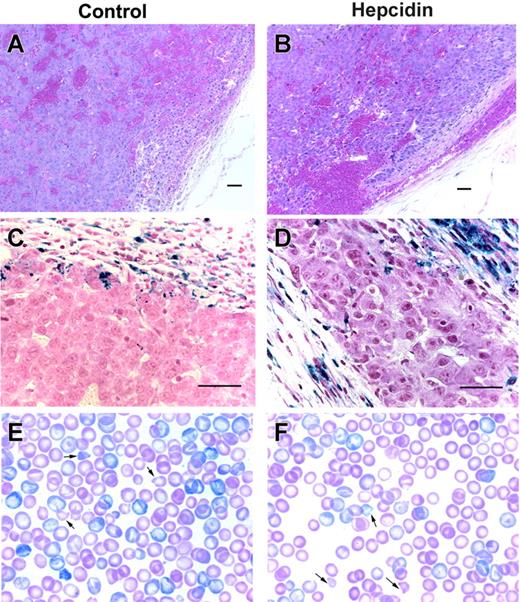
Tumor xenografts sections and peripheral blood smears. Hematoxylin and eosin low-power images of hepatoma xenografts expressing GFP (A) or hepcidin and GFP (B) show sheets of neoplastic hepatocytes, abnormal blood vessels, and areas of hemorrhage. Corresponding Perl Prussian blue-stained sections (C-D) demonstrate hemosiderin-laden macrophages in the fibrous capsule surrounding the tumors. Scale bars represent 50 μm. Panels E and F show Giemsa-stained blood smears from a pair of similarly severely anemic (Hgb level 68 vs 67 g/L) mice with hepatoma xenografts either not engineered or engineered to express hepcidin, respectively, on a high-iron diet. Arrows point to some of the many erythrocyte fragments.
Tumor xenografts sections and peripheral blood smears. Hematoxylin and eosin low-power images of hepatoma xenografts expressing GFP (A) or hepcidin and GFP (B) show sheets of neoplastic hepatocytes, abnormal blood vessels, and areas of hemorrhage. Corresponding Perl Prussian blue-stained sections (C-D) demonstrate hemosiderin-laden macrophages in the fibrous capsule surrounding the tumors. Scale bars represent 50 μm. Panels E and F show Giemsa-stained blood smears from a pair of similarly severely anemic (Hgb level 68 vs 67 g/L) mice with hepatoma xenografts either not engineered or engineered to express hepcidin, respectively, on a high-iron diet. Arrows point to some of the many erythrocyte fragments.
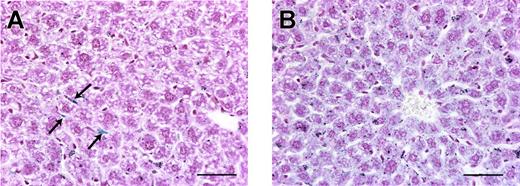
Hepatic iron staining. Perl Prussian blue stain of liver sections from a tumor-free mouse (A) and a hepcidin-secreting tumor mouse (B) on a high-iron diet. Unlike in tumor-free mice where spindle-shaped Kupffer cells (arrows) are the most prominent blue-staining cells, in mice with hepcidin-secreting tumors there is diffuse blue staining of the hepatocytes, showing that the increased hepatic iron is within hepatocytes. Scale bars represent 50 μm.
Hepatic iron staining. Perl Prussian blue stain of liver sections from a tumor-free mouse (A) and a hepcidin-secreting tumor mouse (B) on a high-iron diet. Unlike in tumor-free mice where spindle-shaped Kupffer cells (arrows) are the most prominent blue-staining cells, in mice with hepcidin-secreting tumors there is diffuse blue staining of the hepatocytes, showing that the increased hepatic iron is within hepatocytes. Scale bars represent 50 μm.
Statistics
Normally distributed data are presented as mean ± standard deviation. Nonparametric data are described as the median with the interquartile range in brackets. Box and whisker graphs depict the median (line within the box), 25 to 75 percentiles (top and bottom border of the box), and 10 to 90 percentiles (whiskers). The Student t test is used to compare groups of parametric data. Nonparametric or ordinal data are compared using the Mann-Whitney rank sum test.
Results and discussion
Acute effects of hepcidin
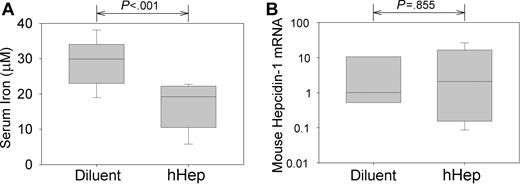
We first tested whether an injection of human hepcidin (hHep) affects serum iron in C57 BL6 mice. We treated 8-week-old mice with 50 μg of hHep or with diluent. Four hours later, mean serum iron fell from 28.8 ± 6.3 μM in control mice to 17.0 ± 6.3 μM in hHep-treated mice (Figure 1; P < .001 by t test, n = 11 in each group). To ensure that hypoferremia was not caused by the induction of endogenous hepcidin-1 by the possible proinflammatory effects of the injectate, qRT-PCR for murine hepcidin-1 mRNA was performed on the mouse livers. There was no difference in hepcidin-1 expression between mice treated with diluent or hHep (Figure 1; P = .885 by t test on log-transformed data). The rapid induction of hypoferremia demonstrates that human hepcidin is bioactive in mice.
Human hepcidin induces acute hypoferremia in mice. Mice were injected intraperitoneally with 50 μg hepcidin or its diluent and analyzed 4 hours later. (A) Serum iron concentrations. (B) Concentration of mouse hepcidin-1 mRNA in the liver measured by qRT-PCR, normalized to β-actin mRNA concentration, and shown as a ratio to the median value in diluent-injected mice. Box and whisker plots represent median, 25% to 75% range, and 10% to 90% range.
Human hepcidin induces acute hypoferremia in mice. Mice were injected intraperitoneally with 50 μg hepcidin or its diluent and analyzed 4 hours later. (A) Serum iron concentrations. (B) Concentration of mouse hepcidin-1 mRNA in the liver measured by qRT-PCR, normalized to β-actin mRNA concentration, and shown as a ratio to the median value in diluent-injected mice. Box and whisker plots represent median, 25% to 75% range, and 10% to 90% range.
Secretion of hepcidin by tumor xenografts
In order to study the chronic effects of hepcidin, we designed tumor xenografts to express high levels of human hepcidin. HIV CS-CG vectors15 containing the prohepcidin gene and GFP, or GFP alone, were packaged and pseudotyped with a vesicular stomatitis virus (VSV) envelope. The infection-competent viruses were harvested and used to infect cell lines derived from the liver, lung, and colon. Hepcidin mRNA assayed by qRT-PCR was increased 2000-fold in hepcidin-infected HepG2 compared with noninfected and GFP-infected cells (data not shown). All infected cell lines expressed the construct as demonstrated by green fluorescence. However, only the liver-derived cell lines, HepG2 and, to a lesser extent, Hep3B, secreted amounts of human hepcidin detectable by Western blotting and silver staining (data not shown), indicating that the high-level translation and correct processing of hepcidin are likely liver specific.
Reverse-phase C18 HPLC of medium from infected cell lines showed that only medium from hepcidin-expressing cells, but not from GFP-only expressing cells, contained a peak at 31% acetonitrile (ACN), where native hepcidin elutes (data not shown). To confirm that this peak was hepcidin, mass spectrometry was performed and compared with that of synthetic 15N-hepcidin-25.17 The spectrograms from the 2 samples were nearly identical taking into account the increased mass from the 15N (data not shown).
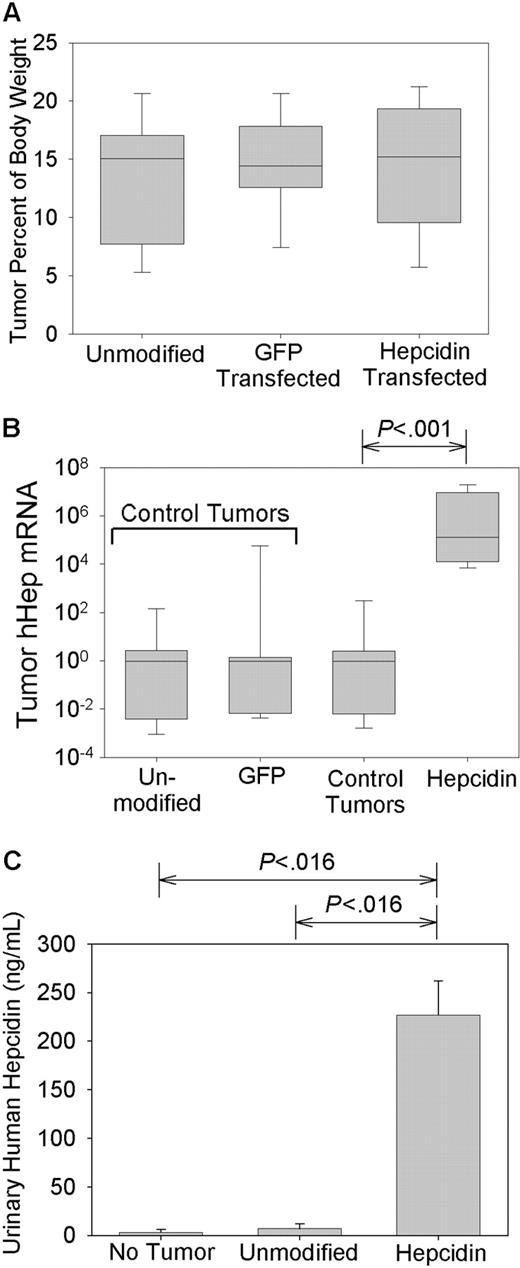
Tumors appeared at about 3 weeks after injection and were allowed to grow until they reached approximately 1.5 × 1.5 cm in size, typically around 5 to 6 weeks after injection. All tumor-bearing mice appeared chronically ill but showed normal mobility and food and water intake. Tumor-bearing mice lost 10.8% ± 9.7% of their initial body weight compared with non-tumor-bearing mice who gained 9.09% ± 6.28% (P < .001 by t test). There was no difference in the weight loss between the control tumor mice and the hepcidin-producing mice or between the mice maintained on the low- or high-iron diets (data not shown). The combined weights of the 2 tumors per animal averaged 3.3 ± 1.3 g (14.1% ± 5.1% of body weight), and all 3 groups of tumor-bearing mice had similar-sized tumors (P = .805 by 1-way analysis of variance [ANOVA]; Figure 2A).
Hepcidin production by xenografts. Mice were implanted with human hepatoma xenografts that were either unmodified or transfected with a GFP-expressing vector (GFP transfected) or a vector expressing both GFP and hepcidin (hepcidin transfected). Control tumors include both unmodified and GFP-transfected tumors. (A) Tumor masses, expressed as the percentage of total body weight. (B) Tumor hepcidin mRNA expression by real-time PCR normalized to G3PDH mRNA and shown as a ratio to the median of mice with control tumors. Box and whisker plots represent median, 25% to 75% range, and 10% to 90% range. (C) Urinary hepcidin excretion in mice bearing different types of tumors. Bar graph shows mean and one standard deviation. Significant differences (P < .05) are indicated at the top of each panel.
Hepcidin production by xenografts. Mice were implanted with human hepatoma xenografts that were either unmodified or transfected with a GFP-expressing vector (GFP transfected) or a vector expressing both GFP and hepcidin (hepcidin transfected). Control tumors include both unmodified and GFP-transfected tumors. (A) Tumor masses, expressed as the percentage of total body weight. (B) Tumor hepcidin mRNA expression by real-time PCR normalized to G3PDH mRNA and shown as a ratio to the median of mice with control tumors. Box and whisker plots represent median, 25% to 75% range, and 10% to 90% range. (C) Urinary hepcidin excretion in mice bearing different types of tumors. Bar graph shows mean and one standard deviation. Significant differences (P < .05) are indicated at the top of each panel.
As expected, the hepcidin-producing tumors expressed 5.33 × 10⁶-fold more human hepcidin mRNA than non-hepcidin-producing tumors (P < .001 by Mann-Whitney; Figure 2B). There was no difference between tumors infected with GFP or noninfected tumors (P = .357 by Mann-Whitney; Figure 2B). Because tumors infected with the GFP-expressing vector and noninfected tumors were of equal size and expressed similar amounts of hepcidin, they were grouped together as control tumors.
To assess whether the high human hepcidin expression seen in the tumors led to high systemic levels of human hepcidin, we measured the urinary excretion of hepcidin by an immunoassay. The mice with hepcidin-producing tumors had on average 30- and 80-fold higher urinary hepcidin than mice with control tumors or no tumors, respectively (both P = .016 by rank sum test; Figure 2C). Average urinary concentration of human hepcidin in the mice with hepcidin-producing tumors (240 ng/mL) was comparable to that seen in humans with mild to moderate anemia of inflammation.7 This indicates that hepcidin from tumors engineered to overexpress the peptide reached the systemic circulation, allowing us to examine the chronic effects of hepcidin.
Chronic effects of hepcidin
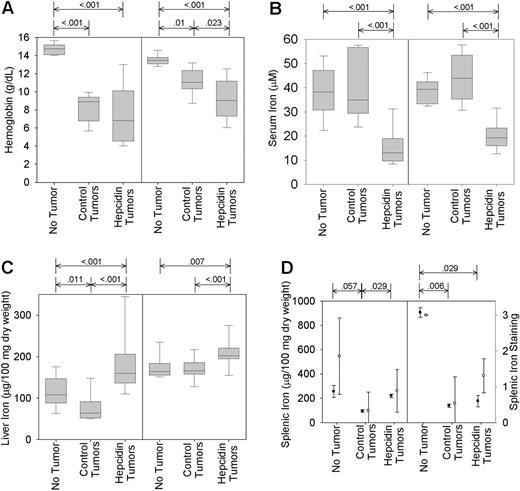
Serum iron was not affected by control tumors (tumor-free, 42.3 ± 11.4 vs control tumor, 38.6 ± 7.3 μM; P = .179 by t test). However, serum iron fell significantly in mice with hepcidin-producing tumors (18.2 ± 6.8 μM; P = .001 by t test). This pattern was present regardless of whether the mice were on a low- or high-iron diet (Figure 3B). Liver iron on low-iron diet fell slightly in mice with control tumors compared with nontumor mice (median, 64 [interquartile range, 52-88] vs median, 108 [interquartile range, 90-142] μg/100 mg dry weight; P = .011 by rank sum; Figure 3C) but rose significantly in mice with hepcidin-producing tumors (median, 160 [interquartile range, 143-205] μg/100 mg; P < .001 by rank sum). A similar but less pronounced pattern was seen in mice on the high-iron diet. In comparison to the major effects of hepcidin on serum iron and hepatic iron concentrations, the effects of hepcidin on splenic and bone marrow iron were relatively slight. Splenic iron detected by chemical assay or Perl staining fell significantly in all mice with tumors (Figure 3D) but was somewhat higher in mice with hepcidin-producing tumors compared with control tumors. The effect of hepcidin was only significant in the low-iron group (Figure 3D). In both the high- and low-iron groups, stainable bone marrow iron fell significantly when tumors were present (data not shown; P < .001 by rank sum). Although mice with hepcidin-producing tumors appeared to have slightly more iron in the bone marrow, this difference was not statistically significant (P = .695 and P = .309 by rank sum for mice on low- and high-iron diet, respectively).
Hepcidin overproduction exacerbates tumor-associated anemia and hypoferremia and prevents mobilization of iron from stores. Mice bearing unmodified, GFP-transfected, or hepcidin-transfected tumors were maintained either on a high- (left graph of each pair) or low-iron (right graph) diet for the duration of the study. (A) Blood hemoglobin concentrations. (B) Serum iron levels. (C-D) Liver and splenic iron content. Box and whisker plots represent median, 25% to 75% range, and 10% to 90% range. (D) Total splenic iron was measured directly (left axis; •) or by semiquantitative grading of the sections stained with Perl Prussian blue (right axis; ○). Plot shows mean and one standard deviation. Significant differences (P < .05) are indicated at the top of each panel.
Hepcidin overproduction exacerbates tumor-associated anemia and hypoferremia and prevents mobilization of iron from stores. Mice bearing unmodified, GFP-transfected, or hepcidin-transfected tumors were maintained either on a high- (left graph of each pair) or low-iron (right graph) diet for the duration of the study. (A) Blood hemoglobin concentrations. (B) Serum iron levels. (C-D) Liver and splenic iron content. Box and whisker plots represent median, 25% to 75% range, and 10% to 90% range. (D) Total splenic iron was measured directly (left axis; •) or by semiquantitative grading of the sections stained with Perl Prussian blue (right axis; ○). Plot shows mean and one standard deviation. Significant differences (P < .05) are indicated at the top of each panel.
Compared with mice without tumors, all mice with tumors became anemic (median hemoglobin level 140 g/L [interquartile range, 134-147] vs 98 [74-116]; P < .001 by rank sum). On the high-iron diet, mice with hepcidin-producing tumors were more anemic than mice with control tumors (Figure 3A; median hemoglobin level 90 g/L [74-112] vs 110 [103-123]; P = .023 by rank sum). The mean corpuscular volume of erythrocytes in mice on a high-iron diet with hepcidin-producing tumors was 56.0 ± 6.1 μm3 compared with 61.4 ± 8.4 μm3 in mice with control tumors (P < .03), consistent with iron-restricted hematopoiesis under the influence of hepcidin. The tumor-induced anemia was further exacerbated by low-iron diet but here the mice with control tumors or hepcidin-producing tumors had similar blood hemoglobin concentrations (Figure 3A). Hematocrit values followed the same pattern (data not shown).
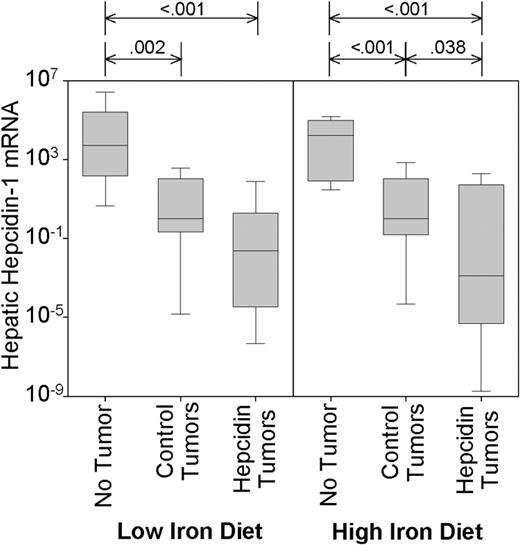
Control tumors suppressed endogenous mouse hepcidin-1 on either diet by several orders of magnitude (Figure 4; P = .002 and P < .001, for low- and high-iron diet, respectively). Hepcidin-producing tumors suppressed endogenous hepcidin even further, although this difference was only significant in mice on the high-iron diet (P = .038). This likely indicates that autologous hepcidin in tumor mice on the low-iron diet is maximally suppressed, probably secondary to anemia, hypoferremia, or both. The very low expression of endogenous hepcidin-1 in the tumorbearing mice suggests that hepcidin mRNA is not induced by tumors in these immunodeficient mice and that endogenous hepcidin does not contribute to anemia in this setting.
Control and hepcidin-producing tumors suppress endogenous mouse hepcidin-1. Mouse hepatic hepcidin-1 mRNA concentration was analyzed by qRT-PCR and normalized to β-actin. Significant differences (P < .05) are indicated at the top of each panel. Box and whisker plots represent median, 25% to 75% range, and 10% to 90% range.
Control and hepcidin-producing tumors suppress endogenous mouse hepcidin-1. Mouse hepatic hepcidin-1 mRNA concentration was analyzed by qRT-PCR and normalized to β-actin. Significant differences (P < .05) are indicated at the top of each panel. Box and whisker plots represent median, 25% to 75% range, and 10% to 90% range.
On both high- and low-iron diets, the secretion of human hepcidin by the tumors induced hypoferremia and modified the organ distribution of iron, confirming that human hepcidin exerts biologic activity in mice. Secretion of hepcidin worsened anemia in mice on a high-iron diet but not a low-iron diet. These data suggest that under the conditions of abundant dietary iron, hepcidin excess mimics the hematopoietic effects of iron deficiency by inducing the redistribution of iron into the hepatic storage pool, thereby restricting iron availability to the erythron.
With either hepcidin-producing or control tumors, NOD-SCID mice developed anemia and weight loss. However, unlike hepcidin-producing tumors, control tumors did not induce significant hypoferremia, even with the additional stress of low-iron diet. In contrast, hypoferremia is usually seen in humans with cancer-related anemias.18 In mice with experimental inflammation, hypoferremia is dependent on the induction of hepcidin11 by cytokines, predominantly IL-6.8 NOD-SCID mice have severe deficits in both adaptive and innate immunity19 and would not be expected to mount an appropriate cytokine response to tumors. The suppression of endogenous hepcidin is probably due to the anemia combined with the lack of cytokine stimulation that would counteract it.6-8 In this model, hypoferremia reflects solely the production of hepcidin by the tumor.
The development of anemia in NOD-SCID mice with control tumors and low endogenous hepcidin production suggests that a nonimmune, hepcidin-independent mechanism contributes to anemia in this model. Microscopic examination of the tumors showed similar abnormal blood vessel formation, intratumor hemorrhages, and tumor capsules containing many iron-loaded macrophages (Figure 5). The histologic appearance of the tumors and the density of iron-loaded macrophages was similar whether the tumors produced hepcidin or not. Tumors contained 240 ± 77 μg iron/100 mg dry weight. Taking into account the weights of the tumors, they contained more iron than the liver. However, there was no difference between mice on a high-iron (222 ± 94 μg/100 mg) or a low-iron diet (251 ± 65 μg/100 mg; P = .157) or between mice with control (234 ± 68 μg/100 mg) or hepcidin-producing tumors (247 ± 88 μg/100 mg; P = .50). Moreover, blood smears of tumor-bearing mice, regardless of hepcidin production, showed many damaged erythrocytes and erythrocyte fragments (Figure 5E-F). On the basis of these observations, we surmise that hemorrhages and hemolysis in the tumors, caused by their abnormal vasculature, shorten the erythrocyte lifespan and contribute to anemia. This does not preclude the possibility that other, perhaps as yet unknown mechanisms, also contribute to the tumor-induced anemia in the immunodeficient NOD-SCID mice.
It is often stated but not convincingly documented that in anemia of malignancy and in AI, iron is predominantly sequestered in macrophages.20 However, all the tumor-bearing mice had significantly less bone marrow iron and splenic iron than tumor-free controls. In contrast, liver iron stores were significantly increased by hepcidin, mirroring what has been seen in animal models of inflammation.21-23 Furthermore, when the livers from mice with hepcidin-producing tumors were stained with Perl Prussian blue, the iron was found predominantly in hepatocytes, whereas in mice without tumors the Kupffer cells were the most prominent iron storage cells (Figure 6). These results indicate that the hepatocytes play an important and previously underappreciated role in the iron sequestration of AI. The final destination of sequestered iron depends on the relative rates of iron uptake and export in each tissue and these can be influenced by local concentrations of hepcidin (normally likely to be highest in the liver) and by the sensitivity of each tissue to the effects of hepcidin. The dynamic regulation of macrophage-mediated iron recycling by hepcidin, including in this case recycling by tumor-associated macrophages (Figure 5), is of great interest but not addressed by our analysis. The profound immunodeficiency of the tumor-bearing mice may also modify the distribution of iron by eliminating potential hepcidin-independent effects of the immune system on iron metabolism.24 Since detailed human studies of the effect of inflammation on hepatic iron stores have not been performed, it remains to be seen whether the mouse model is predictive of the cellular and organ distribution of iron in human AI.
In summary, hepcidin induces a rapid fall in serum iron and this response is maintained during chronic overproduction of hepcidin. In our model, chronic hepcidin overproduction exacerbated the tumor-associated anemia by inducing the sequestration of iron and hypoferremia. In humans and in mice, inflammation has been shown to cause hepcidin overproduction, predominantly through the induction of hepcidin by inflammatory cytokines, especially IL-6. Our model of the chronic effects of excess hepcidin recapitulates the key features of AI and suggests that inhibitors of the production or activity of hepcidin could be useful for its treatment.
Prepublished online as Blood First Edition Paper, October 12, 2004; DOI 10.1182/blood-2004-08-3375.
Supported by the Will Rogers Foundation and grant DK 065029 from the National Institutes of Health.
L.L. and S.R. contributed equally to this work.
An Inside Blood analysis of this article appears in the front of this issue.
The publication costs of this article were defrayed in part by page charge payment. Therefore, and solely to indicate this fact, this article is hereby marked “advertisement” in accordance with 18 U.S.C. section 1734.
We gratefully thank Drs Sawyers and Chen at UCLA and Dr Verma at the Salk Institute for their lentiviral vector, packaging cell line, and constructive discussion and suggestions. We also gratefully acknowledge the assistance of Ping Fu at the Human Tissue Research Center at UCLA and Erika Valore, Rose Linzmeier, Lan Lin, Dina Farshidi, Dharma Thapa, and Michael Durando for their assistance on this project.

This feature is available to Subscribers Only
Sign In or Create an Account Close Modal