Abstract
Human megakaryocyte differentiation and maturation were studied in fresh marrow aspirates by using multiparameter flow cytometric correlative analysis. The expression of glycoprotein (GP)IIb/IIIa, GPIIIa, GPIb, and CD36 correlated directly with cell size and ploidy (r > 0.97); however, GPIb acquisition was relatively slow. von Willebrand factor (VWF) is robustly expressed by early (2N and 4N) megakaryocytes, enabling their complete resolution from the other marrow cells at a level superior to that achieved with GPIIb/IIIa. Expression of myeloid CD45 and immunoglobulin G (IgG)-FcγRII receptor (CDw32) increased with megakaryocyte maturation and contrasted with the declining expression of HLA-DR (negative in platelets). Interleukin-6 receptor expression in megakaryocytes was higher than in other marrow cells. By using the time-of-flight technique, the diameter of the megakaryocyte population was 37 ± 4 μm (mean ± 1 SD) compared with 14 ± 2 μm for the total marrow cells, ranging from 21 ± 4 μm for 2N cells to 56 ± 8 μm for 64N cells. Cell size directly correlated with cell DNA (r = 0.98). Receptor density of GPIIb/IIIa and GPIb decreased with the transition from 2N to 4N cells, then reached maximum at 32N cells. In conclusion, the present methods are useful for studying in vivo human megakaryocytopoiesis in normal and altered states. The expression of VWF is a sensitive and distinctive marker for the identification of young marrow megakaryocytes. (Blood. 2004; 104:2722-2727)
Introduction
Megakaryocytes (MKs) arise from multipotential hematopoietic stem cells capable of differentiation into erythroid, granulocytic-macrophage, and megakaryocytic lineages. This process is associated with an evolutionary acquisition of functional receptors necessary for normal platelet function. During maturation, MKs undergo nuclear reduplication without cytoplasmic division. The cytoplasm increases in size and acquires organelles characteristic of peripheral platelets. Accordingly, mature marrow MKs are large, granular, polyploid cells reaching diameters of 60 μm and ploidy of 128N.1-12
The analysis of MK cellular differentiation markers is useful in studies investigating megakaryocytopoiesis in normal and disease states. However, the study of human MKs in vivo has proven difficult because of their relative rarity (constituting about 0.05% of all nucleated bone marrow cells), fragility, and their inherent tendency to aggregate.6,13,14 Consequently, large numbers of marrow cells and highly selective methods are needed for successful isolation or analysis.
The introduction of fluorescence-activated flow cytometry (FCM) represents a significant technical advance in studies of MKs. The advantages of the method include the following: (1) MKs are identified by lineage-specific markers using cell-specific antibodies; (2) studies of cell populations are based on the analysis of individual cell measurements; (3) the cells can be characterized by simultaneous measurements of size, granularity which reflects cytoplasmic maturation, and 2 or more receptor expression levels in relation to cell DNA content or ploidy. FCM has been shown to be a sensitive and rapid method for the analysis of infrequent cell populations even in a complex cell mixture such as bone marrow.15 Thus, this method overcomes many of the technical limitations associated with separation and analysis on the basis of physical megakaryocyte characteristics such as size and density.
Following initial studies in experimental animals,16-19 the flow cytometric method was adapted for the analysis of human MKs derived from routine marrow aspirates,9-11 thus permitting sequential studies of MKs in normal and pathologic states. Moreover, with the use of fluorescence-activated cell sorting of bone marrow aspirates, it becomes possible to isolate highly pure (≥ 98%) viable human MKs capable of synthesis of both DNA and protein in vitro and responsive to hematopoietic growth factors.9 In this work, the quantitative determination of in vivo human marrow MK cellular differentiation and maturation characteristics were studied by using flow cytometric techniques.
Materials and methods
Preparation of bone marrow cells
The study was approved by the institutional review board for human investigation. Preparation of bone marrow aspirates for flow cytometric analysis was performed as previously described.9-11 MKs were analyzed both in unfractionated marrow (to preclude possible selective cell loss) and in fractionated marrow (enriched for MKs to hasten the analysis). Fractionation was performed by separating marrow cells over a discontinuous Percoll gradient of density 1.060 g/mL. This procedure yields about 15-fold enrichment with recovery of at least 98% of recognizable MKs.11 For analysis of cell size using the “time-of-flight” technique (described in “Flow cytometric analysis”), an aliquot of labeled marrow was fixed with 1% paraformaldehyde for 30 minutes at room temperature.
Megakaryocyte labeling
Multicolor labeling. For measurement of megakaryocytic ploidy distribution, MKs in fresh marrow aspirates were directly labeled with a fluoresceinated lineage-specific monoclonal antibodies (MoAbs; FITC-LJ-P4) directed to the membrane glycoprotein (GP) IIb-IIIa complex (CD41a) for cell identification and stained with propidium iodide (PI) for DNA quantitation, using a minor modification of a previously described method.11
For simultaneous assessment of lineage-specific and myeloid markers in relation to ploidy, MKs were labeled with fluorescein and phycoerythrin (PE)-conjugated MoAbs, and cell DNA was stained with the dye 7-aminoactinomycin D (7AAD) (final concentration of 25 μg/mL). FITC-LJ-P4 MoAb against CD41a was used for MK identification, and PE-conjugated primary antibody probes were used for other cell markers. For simultaneous analysis of 3 marker proteins, the cells were labeled with peridinin chlorophyll protein (PerCP)-conjugated anti-CD45, along with fluorescein and PE-labeled probes.
The expression of von Willebrand factor (VWF) by marrow MKs in relation to ploidy was determined by simultaneous labeling with fluoresceinated-MoAb to VWF and PE-labeled MoAb to the lineage-specific GPIIb/IIIa complex (CD41a), along with staining of cell DNA with 7AAD. The cell count was adjusted to 5 × 10⁶/mL with MK medium,11 then the cell suspension was incubated for 30 minutes on ice with a saturating concentration of the MoAbs. This concentration was predetermined by quantitative flow cytometric measurements of the fluorescence of large MKs. For labeling with anti-VWF MoAb, cells were incubated in the presence of 0.025% Triton X-100 (Sigma, St Louis, MO) for permeabilization. The cell suspension was then diluted 1:2 with MK medium and analyzed by flow cytometry. Aliquots of the marrow cell suspension were also incubated under identical conditions with isotype-matched monoclonal antibody (MoAb) and used as the control cell population. By using inhibitors and buffers as previously described, optimal dispersion and preservation of cells were obtained.11,20
MoAbs used. LJ-P4 against the platelet-MK GPIIb/IIIa complex (CD41a), LJ-P3 anti-GPIb (CD42b) (kindly supplied by Dr Z.M. Ruggeri, Scripps Research Institute, La Jolla, CA); anti-CD45 (HLe1), anti-HLA-DR (clone L243), anti-GPIIIa (CD61), anti-CD34 (HPCA2) (Becton Dickinson, San Jose, CA); MoAb IV.3 anti-IgG-FcγRII (CDw32) (Medarex, West Lebanon, NH); anti-CD36 (AMAC, Westbrook, ME); anti-VWF (kindly supplied by Dr Bruce Evatt, The Centers for Disease Control, Atlanta, GA). PE-labeled human-recombinant interleukin 6 (IL-6) was used for the assessment of cytokine receptor expression (R&D, Minneapolis, MN).
Flow cytometric analysis
A single argon-ion laser FACScan (Becton Dickinson) flow cytometer capable of 3-color fluorescence detection and equipped with an adjustable logarithmic amplifier to improve resolution of the multiple MK ploidy peaks was used. In the 3-color setting, the 7AAD dye is excited by the 488-nm wavelength of the argon-ion laser, and its red fluorescence emission is separated by using longpass filter greater than 630 nm, together with bandpass filters 520 to 540 nm for fluorescein and 563 to 586 nm for phycoerythrin. An overlap in the emission spectra of the various fluorochromes was corrected by using single-color and double-color labeled cells of the same preparation. The linear response range for the fluorescence intensity was confirmed by using standard fluorescent beads (Flow Cytometry Standard, Triangle Park, NC). The membrane fluorescence intensity of the various MK ploidy classes was compared with both that of the standard particles and normal platelets and was expressed as “platelet equivalent.” Platelet-rich plasma was prepared from citrate-anticoagulated blood and was adjusted to a count of 200 × 109/L prior to labeling.
The MK population was quantitatively analyzed for (1) cell size as estimated by forward light scatter (FSC); (2) cytoplasmic maturation as assessed by 90° light scatter or side scatter (SSC), which reflects the fine intracellular complexity; (3) relative expression of the membrane functional receptors and cytoplasmic marker proteins as assessed by the intensity of the immunofluorescence; and (4) ploidy distribution as assessed by the intensity of the DNA-bound PI or 7AAD fluorescence.
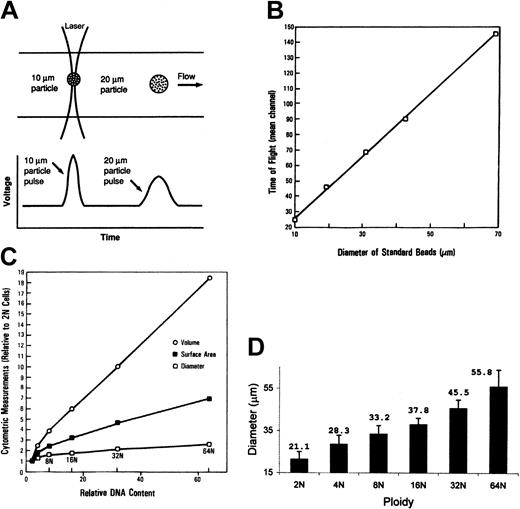
Cell diameter was directly measured as the electronic pulse width representing the time required for a cell in suspension to pass through a focused light beam (time-of-flight) (Figure 3A) and is directly proportional to cell diameter.21 Preliminary studies showed this measurement to be directly related to the size of standard particles with a diameter ranging between 10 and 70 μm (R = 0.9) (Figure 3B). To establish the relationship between marrow MK diameter and cell maturation stage, MKs were analyzed by using a Coulter-type experimental flow cytometer (National Laboratories, Los Alamos, CA) equipped with 2W argon-ion laser delivering an elliptical narrow light beam (8 × 120 μm diameters) at 488 nm.
Relationship of cell size measured by time-of-flight and ploidy. (A) Time-of-flight is the time required for a cell in suspension to pass through a focused light beam, as measured by the pulse width. This measurement is proportional to the cell diameter as illustrated (adapted from Shapiro21 ). (B) Relationship between time-of-flight measurement and particle diameter. Small-angle light scatter of standard beads (10-70-μm diameter) was detected by flow cytometry, and the pulse width was measured. The solid line represents the linear regression (r = 0.99). (C) Cell diameter, surface area, and volume of normal human MKs. The derived cell surface areas and volumes were calculated, assuming sphere-shaped particles. (D) Relationship between cell diameter, measured by time-of-flight, and ploidy of normal human marrow megakaryocytes (n = 19). Data are mean ± SD.
Relationship of cell size measured by time-of-flight and ploidy. (A) Time-of-flight is the time required for a cell in suspension to pass through a focused light beam, as measured by the pulse width. This measurement is proportional to the cell diameter as illustrated (adapted from Shapiro21 ). (B) Relationship between time-of-flight measurement and particle diameter. Small-angle light scatter of standard beads (10-70-μm diameter) was detected by flow cytometry, and the pulse width was measured. The solid line represents the linear regression (r = 0.99). (C) Cell diameter, surface area, and volume of normal human MKs. The derived cell surface areas and volumes were calculated, assuming sphere-shaped particles. (D) Relationship between cell diameter, measured by time-of-flight, and ploidy of normal human marrow megakaryocytes (n = 19). Data are mean ± SD.
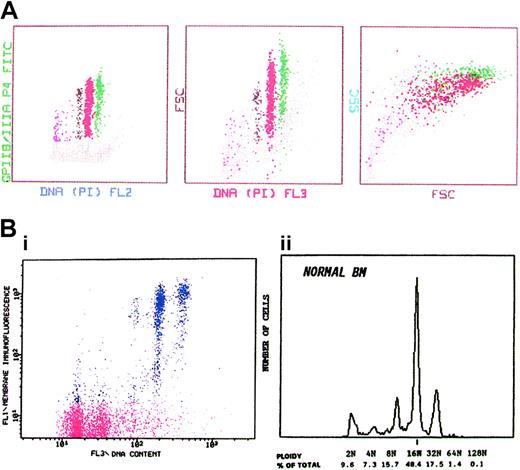
MKs were selected on the basis of their distinct immunofluorescence at levels above that of control cells labeled with an unrelated MoAb. To achieve adequate analysis of ploidy distribution, 2000 to 3000 MKs were analyzed in each sample. Acquisition rate was limited to 1000 cells/second to enhance resolution. Bidimensional plots of immunofluorescence versus FSC or DNA-fluorescence (Figure 2) were used to establish the location of the desired cell population. The ploidy distribution was determined by setting markers at the nadirs between peaks by using the 2N and 4N peaks of whole marrow cells as internal reference standards11 (Figure 2B).
Relation between expression of GPIIb/IIIa, cell size, granularity, and ploidy of human marrow MKs. (A) Distribution of marrow MKs by surface expression of GPIIb/IIIa, cell size as estimated by forward light scatter (FSC), granularity as reflected by 90° light scatter or side scatter (SSC), and DNA content. Note the progressive increase of all parameters in relation to ploidy. (B) (i) The distribution of marrow cells according to membrane-GPIIb/IIIa immunofluorescence and the DNA content. Cells with background fluorescence represent the principal marrow cell population with ploidy classes of 2N and 4N (red). The highly fluorescent cells represent the MK population with polyploid subclasses (blue). (ii) The DNA histogram of the MK population is shown. The modal ploidy is 16N.
Relation between expression of GPIIb/IIIa, cell size, granularity, and ploidy of human marrow MKs. (A) Distribution of marrow MKs by surface expression of GPIIb/IIIa, cell size as estimated by forward light scatter (FSC), granularity as reflected by 90° light scatter or side scatter (SSC), and DNA content. Note the progressive increase of all parameters in relation to ploidy. (B) (i) The distribution of marrow cells according to membrane-GPIIb/IIIa immunofluorescence and the DNA content. Cells with background fluorescence represent the principal marrow cell population with ploidy classes of 2N and 4N (red). The highly fluorescent cells represent the MK population with polyploid subclasses (blue). (ii) The DNA histogram of the MK population is shown. The modal ploidy is 16N.
Statistical analysis
Comparisons among the megakaryocytic and platelet determinations were performed by standard least square regression analysis as described.10 Megakaryocyte ploidy distribution was determined by the average distribution of healthy individuals (n = 19) by using multinomial distribution analysis as described.11 All values are expressed as mean ± standard deviation (SD).
Results
Flow cytometric measurements of normal human MKs
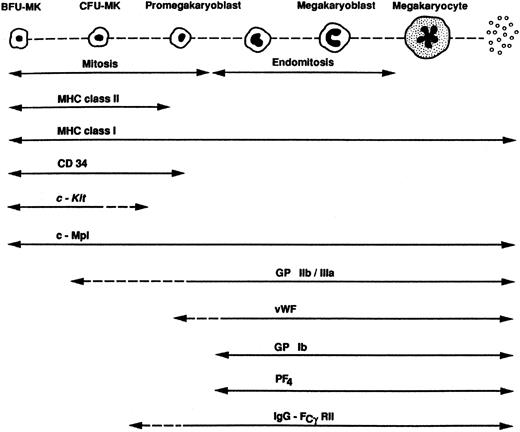
Cellular characteristics. The differentiation markers of the megakaryocytic lineage are illustrated in Figure 1. The distribution of unfractionated human marrow MKs according to the various flow cytometric measurements is shown in Figure 2A. The expression of GPIIb/IIIa is related to cell DNA content (left panel); cell size as assessed by forward light-scatter (FSC) is compared with cell DNA (middle panel), and the ultrastructural complexity reflected by side scatter (SSC) is compared with FSC (right panel). Whereas immunofluorescence, size, and granularity increase continuously with maturation, ploidy increases in discrete steps, thus being useful for discrimination between MK maturation subsets.
Differentiation markers of the megakaryocytic lineage. BFU-MK indicates megakaryocytic burst-forming unit; CFU-MK, megakaryocytic colony-forming unit; MHC, major histocompatibility complex; CD, cluster designation; c-Kit, cellular Kit gene that encodes for the receptor to stem cell factor.
Differentiation markers of the megakaryocytic lineage. BFU-MK indicates megakaryocytic burst-forming unit; CFU-MK, megakaryocytic colony-forming unit; MHC, major histocompatibility complex; CD, cluster designation; c-Kit, cellular Kit gene that encodes for the receptor to stem cell factor.
Ploidy distribution. The analytical potential of FCM for studies of megakaryocytopoiesis can be particularly demonstrated in determination of the megakaryocytic ploidy distribution. Figure 2B shows the quantitative analysis of normal human MK ploidy. In the left panel the distribution of the marrow cells according to membrane immunofluorescence and DNA content is demonstrated. Cells with background fluorescence represent the principal marrow cell population (red), consisting of 2N and 4N ploidy classes. The highly fluorescent cells represent the MKs with polyploid subclasses (blue). The DNA histogram of the MK population is shown on the right panel. The modal ploidy is 16N, comprising about 50% of the total MKs, with an approximately equal distribution of cells having ploidy less than 16N and more than 16N.
Estimation of MK size. For more direct measurement of MK cell diameter, the time-of-flight technique was used. The measurement of time-of-flight is illustrated in Figure 3A; accordingly, time-of-flight is the time required for a cell in suspension to pass through a focused light beam, as measured by the electronic pulse width. This time measurement is proportional to the cell diameter as illustrated. By using an elliptical narrow laser beam, a linear relationship (r = 0.99) was found between time-of-flight measurement and the size of standard particles with diameters in the range of 10 to 70 μm (Figure 3B). By using this method, the average diameter of the total MK population in normal human marrow was 37 ± 4 μm (mean ± 1 SD) compared with 14 ± 2 μm for the total bone marrow cell population. The derived average MK volume was 26 × 103 μm3, compared with 4 × 103 μm3 of an average lymphocyte. The relationship of normal human marrow MK cell diameter, surface area, and volume to cell ploidy is demonstrated in Figure 3C. All measurements concordantly increased with cell ploidy. The mean diameter of the various ploidy classes ranged from 21 ± 4 μm for 2N cells to 56 ± 8 μm for 64N cells (Table 1). Cell diameter was directly related to cell DNA content (r = 0.97) (Figure 3D).
Flow cytometric measurements of megakaryocyte cell diameter, granularity, and the expression levels of membrane glycoproteins
Ploidy class . | Cytometric measurement . | . | Relative expression of glycoproteins, platelet equivalent* . | . | . | |||
|---|---|---|---|---|---|---|---|---|
| . | Diameter, μm . | Granularity, mean channel . | GPIIb/IIIa . | GPIb . | GPIIIa . | |||
| 2N | 21.10 ± 3.8 | 17.6 ± 5.2 | 121.00 ± 47.4 | 65.70 ± 9.7 | 84.70 ± 25.8 | |||
| 4N | 28.30 ± 4.5 | 36.7 ± 9.4 | 157.30 ± 43.5 | 76.00 ± 14.8 | 103.00 ± 18.0 | |||
| 8N | 33.20 ± 4.3 | 55.8 ± 8.4 | 239.00 ± 42.6 | 99.7 ± 28.6 | 167.7 ± 21.1 | |||
| 16N | 37.80 ± 30.2 | 90.6 ± 7.1 | 381.70 ± 49.1 | 135.70 ± 30.7 | 320.00 ± 28.0 | |||
| 32N | 45.50 ± 4.2 | 142.0 ± 21.7 | 597.30 ± 127.3 | 211.70 ± 28.9 | 499.70 ± 75.2 | |||
| 64N | 55.80 ± 8.1 | 191.0 ± 32.1 | 893.50 ± 188.5 | 316.00 ± 14.7 | 711.50 ± 121.5 | |||
Data are shown as mean and standard deviation (I SD).
The fluorescence level of marrow MKs relative to that of circulating platelets.
Megakaryocytic differentiation markers
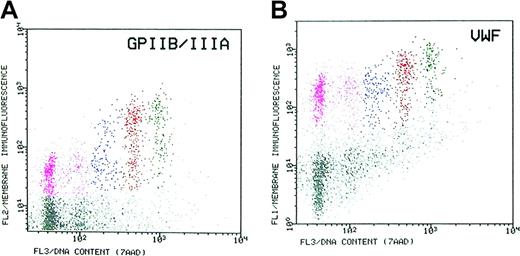
Expression of lineage-specific markers. Megakaryocytic differentiation markers were studied by multicolor flow cytometric analysis. By using this method, the expression of VWF by marrow MKs in relation to ploidy was determined by simultaneous labeling with fluoresceinated MoAb to VWF, PE-labeled MoAb to the lineage-specific GPIIb/IIIa complex (CD41a), and staining of cell DNA with 7AAD (Figure 4). The resolution of the MK cell by the expression of GPIIb/IIIa is shown in the left panel, and the resolution by the expression of VWF is shown in the right panel. Compared with GPIIb/IIIa, the megakaryocytic cells exhibit high expression levels of VWF, enabling their full resolution from the general marrow cell population. Especially, young, low-ploidy (2N/4N) MKs express high level of VWF relative to that of more mature (16N) MKs (ratio = 0.5), as compared with the expression level of GPIIb/IIIa (ratio = 0.2). The high expression of VWF by the least mature MKs permitted their absolute resolution from the total marrow cells at a level that is superior to that obtained by the expression of GPIIb/IIIa. Thus, the expression of VWF may be a sensitive and distinctive marker for identification of young marrow MKs. Compared with the rapid acquisition of VWF, the acquisition of its receptor GPIb (CD42b) was relatively slow, in a rate that is approximately half that of GPIIb/IIIa (Table 1).
Coexpression of von Willebrand factor (VWF) and of GPIIb/IIIa by marrow MKs. The megakaryocytes were simultaneously labeled with fluoresceinated-MoAb to VWF and PE-labeled MoAb to the lineage-specific GPIIb/IIIa complex (CD41a) and stained with 7AAD for measurement of cell DNA content. The megakaryocytic cells are highly resolved from the general marrow cell population by virtue of their distinct expression level. (A) Resolution of marrow MKs by expression of GPIIb/IIIa. (B) Resolution of MKs by the expression of VWF. Small (2N/4N) MKs express a high level of VWF relative to that of the more mature 16N MKs (ratio = 0.5), as compared with the relative expression of GPIIb/IIIa in the same cell populations (ratio = 0.2). Thus, the expression of VWF is a sensitive marker for identification of young marrow MKs.
Coexpression of von Willebrand factor (VWF) and of GPIIb/IIIa by marrow MKs. The megakaryocytes were simultaneously labeled with fluoresceinated-MoAb to VWF and PE-labeled MoAb to the lineage-specific GPIIb/IIIa complex (CD41a) and stained with 7AAD for measurement of cell DNA content. The megakaryocytic cells are highly resolved from the general marrow cell population by virtue of their distinct expression level. (A) Resolution of marrow MKs by expression of GPIIb/IIIa. (B) Resolution of MKs by the expression of VWF. Small (2N/4N) MKs express a high level of VWF relative to that of the more mature 16N MKs (ratio = 0.5), as compared with the relative expression of GPIIb/IIIa in the same cell populations (ratio = 0.2). Thus, the expression of VWF is a sensitive marker for identification of young marrow MKs.
Surface expression of the principal receptors, GPIIb/IIIa and GPIb, progressively increases with ploidy (Table 1) and best correlates with cell surface area (r = 0.99). However, although both cell surface and the expression of GPIIb/IIIa and GPIIIa increased by 7-fold in the transition from 2N to 64N cells, GPIb increased only by 4.8-fold. The total expression of GPIb among mature (16N) cells was about 35% that of GPIIb/IIIa.
The measurement of cell diameter by time-of-flight enabled the calculation of cell surface area and, thus, permitted the estimation of the membrane receptor density (total cell fluorescence/surface area). On the basis of this assessment, the receptor density of both GPIIb/IIIa and GPIb decreased with the transition from 2N to 4N cells (Table 1). Further analysis revealed that, although cell surface increased by 1.8-fold, receptor expression increased by only 1.3-fold. The receptor density then progressively increased with maturation, reaching maximal levels in 32N, without further increment in 64N cells.
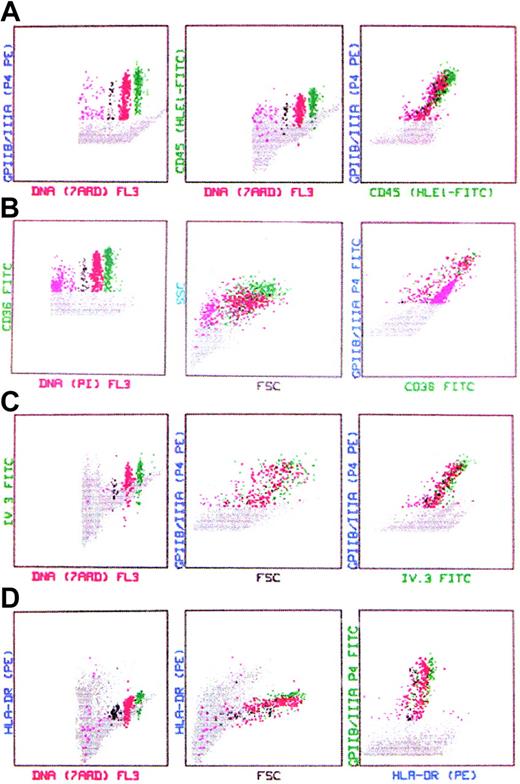
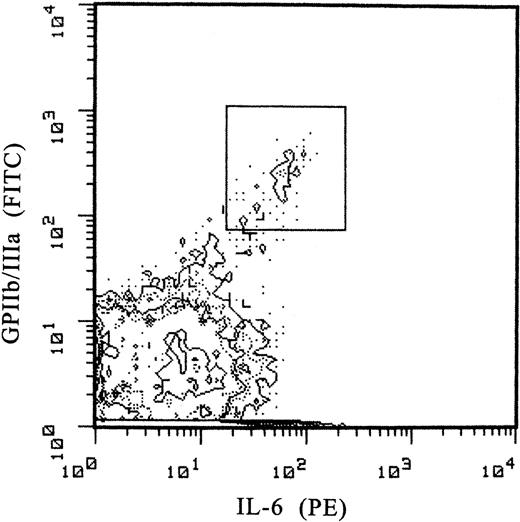
Expression of myeloid markers. Using similar methods, the expression of myeloid markers by normal human marrow MKs in relation to lineage-specific markers and cell ploidy was studied. CD34 is expressed only by a minor proportion (< 1%) of marrow cells, including MKs (data not shown). The expression of the pan-leukocyte, CD45 (Figure 5A), of CD36, the thrombospondin/collagen receptor (Figure 5B), and of IgG-FcγRII (CDw32, the only Fcγ-receptor expressed on MK-platelet system; Figure 5C) is enhanced among MKs and directly correlated with cell maturation. The increased expression of myeloid markers was concordant with the expression of the lineage-specific GPIIb/IIIa and GPIb, cell size, and ploidy. In contrast, the expression of HLA-DR by MKs declined with maturation (Figure 5D) and became negative in platelets. The expression of the receptor for MK-stimulating cytokine IL-6 as estimated by the binding of PE-labeled cytokine, was enhanced among MKs compared with other marrow cells (Figure 6).
Expression of myeloid markers by marrow MKs. (A) CD45 is highly expressed by MKs. The expression level correlates with cell maturation as determined by ploidy. (B) CD36 (thrombospondin receptor) is robustly expressed by MKs and is highly correlated with MK size, ploidy, and the expression of CD41a. (C) The expression of IgG-FcγRII (CDw32, the only IgG-Fcγ receptor expressed on platelets-MKs) correlates directly with cell maturation. Receptor expression is assessed by the binding of IV.3 MoAb. (D) Mature MKs express relatively low levels of HLA-DR compared with other marrow cells (represented by gray dots).
Expression of myeloid markers by marrow MKs. (A) CD45 is highly expressed by MKs. The expression level correlates with cell maturation as determined by ploidy. (B) CD36 (thrombospondin receptor) is robustly expressed by MKs and is highly correlated with MK size, ploidy, and the expression of CD41a. (C) The expression of IgG-FcγRII (CDw32, the only IgG-Fcγ receptor expressed on platelets-MKs) correlates directly with cell maturation. Receptor expression is assessed by the binding of IV.3 MoAb. (D) Mature MKs express relatively low levels of HLA-DR compared with other marrow cells (represented by gray dots).
Expression of surface membrane receptor for IL-6. The expression of the receptor is assessed by the binding of PE-labeled human-recombinant IL-6 (FL2). MKs are identified by simultaneous labeling with LJ-P4 MoAb directed to the membrane CD41 (GPIIb/IIIa complex). MKs (marked with a box) exhibit an enhanced double fluorescence compared with other marrow cells.
Expression of surface membrane receptor for IL-6. The expression of the receptor is assessed by the binding of PE-labeled human-recombinant IL-6 (FL2). MKs are identified by simultaneous labeling with LJ-P4 MoAb directed to the membrane CD41 (GPIIb/IIIa complex). MKs (marked with a box) exhibit an enhanced double fluorescence compared with other marrow cells.
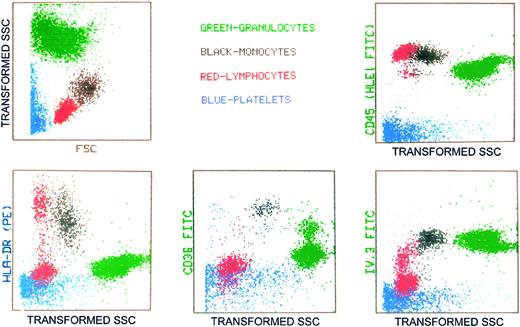
For comparison, the expression of the various myeloid markers by peripheral blood cell elements is shown in Figure 7. Transformed SSC represents decreased logarithmic amplification of the SSC pulse to enhance resolution between cell classes.
The expression of cell membrane receptors studied in marrow MKs, by peripheral blood cells and platelets. Transformed SSC represents decreased logarithmic amplification of the SSC pulse to enhance resolution among cell classes.
The expression of cell membrane receptors studied in marrow MKs, by peripheral blood cells and platelets. Transformed SSC represents decreased logarithmic amplification of the SSC pulse to enhance resolution among cell classes.
Discussion
The analysis of human marrow MK cellular differentiation markers is useful in studies investigating megakaryocytopoiesis in normal and disease states. In the present study we have demonstrated that multiparametric flow cytometric analysis of human marrow MKs may permit the simultaneous assessment of stem cell, early myeloid, and lineage-specific markers in relation to maturation stage, including size and ploidy. We have shown that the expression of VWF is a more sensitive marker than GPIIb/IIIa for the identification of young marrow megakaryocytes.
Previous studies of human marrow MKs have proven difficult because of the relative rarity of these cells (constituting about 0.05% of all nucleated bone marrow cells), fragility, and their inherent tendency to aggregate.6,13,14 Consequently, large numbers of marrow cells and selective methods for MK separation are needed for successful isolation and analysis. The present studies demonstrate that FCM is a useful technique for the analysis of marrow MK cellular and molecular characteristics. The method has been shown to be rapid, sensitive, reproducible, and capable of performing multiparameter correlative measurements on a large number of individual cells.15,22
By using multicolor FCM with a commonly available flow cytometer, we have demonstrated that young (2N/4N) human marrow MKs labeled for lineage-specific CD41a (GPIIb/IIIa complex) and stained for DNA, express high levels of VWF. The high expression of VWF permitted the absolute resolution of the young MK subsets from the total marrow cell population, at levels not previously achieved by using GPIIb/IIIa as the lineage-specific marker. The high level of resolution permits the reliable identification of the less mature megakaryocytic marrow cells for further studies of their cellular and molecular characteristics throughout the differentiation and maturation process.
The expression of the major lineage-specific receptors, GPIIb/IIIa and GPIb, is progressively increased with ploidy (Table 1). However, whereas cell surface area and the expression of GPIIb/IIIa increased by 7-fold in the transition from 2N to 64N cells, the expression of GPIb increased only by 4.8-fold. The total expression of GPIb in 16N cells was about one third that of GPIIb/IIIa.
The studies of MK membrane receptors also revealed that MKs generally express myeloid markers progressively, in concert with cellular maturation as determined by cell size and ploidy. However, whereas the expression of the myeloid markers, the pan-leukocyte CD45, the collagen/thrombospondin receptor CD36 and the IgGFcγRII (CDw32) was in concordance with cell maturation, the expression of HLA-DR declined with maturation and became negative in platelets. The expression of the receptor for the MK-stimulating cytokine IL-6 was high compared with other marrow cells, consistent with a previous report.23
The analysis of cell DNA content showed that human MKs in marrow are polyploid cells with modal ploidy of 16N, comprising about 50% of the total megakaryocytic cells. The rest of the MKs showed an approximately equal distribution of cells having ploidy less than 16N and more than 16N. Studies in experimental mammals showed similar ploidy distribution.16-19 It is of interest that, whereas immunofluorescence, size, and granularity increase continuously with cell maturation, ploidy increases in discrete steps (Figure 2). Thus, MK ploidy level may be useful for discrimination between cell maturation subsets.
Because the relationship between cell size and the flow cytometric measurement of light scatter (FSC), especially for large cells, is complex and has not been adequately characterized,10,15,23 the time-of-flight technique was used for more direct measurement of MK cell diameter.21 By using a narrow laser beam, a linear relationship (r = 0.99) was found between the time-of-flight measurement and the size of standard particles with diameters ranging between 10 and 70 μm (Figure 3B). Using this method, the average diameter of the total MK population in normal human marrow was 37 ± 4 μm compared with 14 ± 2 μm for the total bone marrow cell population. The mean diameter of the various ploidy classes ranged from 21 ± 4 μm for 2N cells to 56 ± 8 μm for 64N cells (Figure 3D). Cell diameter was directly related to cell DNA content. The link between size and ploidy is consistent with previous studies based on microscopic examination.24 The average megakaryocyte cell volume was approximately 6.5-fold that of an average lymphocyte.
The measurement of cell size by the time-of-flight technique permitted the calculation of cell surface area, and thus the estimation of the membrane receptor density (total cell expression/surface area). In contrast to the total receptor expression levels of GPIIb/IIIa and GPIb that increased concordantly with ploidy, the receptor density decreased initially with the transition from 2N to 4N cells. Then, the density increased progressively, reaching maximum at 32N cells, without further increment at levels of 64N cells. The decreased receptor density in the 4N cells may be partially explained by the relatively rapid increase in cell size. Whereas in the transition from 2N to 4N the cell surface area increased by 1.8-fold, the total cell receptor expression increased by 1.3-fold only.
The flow cytometric method used in the present study for the analysis of normal human marrow MKs may also be useful for studying in vivo megakaryocytopoiesis in an altered state. For example, the assessment of receptor expression in myeloproliferative disorders may be of special interest because these disorders are invariably associated with platelet functional defects, leading to hemostatic compromise. However, the nature of this defect has not been well defined. By using FCM for the estimation of MK frequency together with measurements of cell size may also be useful for the assessment of the total megakaryocytic mass.20 This assessment may be particularly useful in studying disorders associated with abnormal platelet counts.11,25 In addition, using the present method, sequential analysis of routine marrow aspirates may be performed following therapies capable of modifying platelet counts,12,20,26-29 including treatment with hematopoietic growth factors and stem cell transplantation. The advantage afforded by VWF expression in distinguishing 2N and 4N megakaryocytes by using flow cytometry would provide a useful tool to purify these young cells by cell sorting9 for further biochemical and molecular analysis. Overall, the interpretation of the data shows that the present method for analysis of routine marrow aspirates may be useful for studying mechanisms affecting megakaryocytopoiesis.
Prepublished online as Blood First Edition Paper, June 15, 2004; DOI 10.1182/blood-2004-02-0769.
The publication costs of this article were defrayed in part by page charge payment. Therefore, and solely to indicate this fact, this article is hereby marked “advertisement” in accordance with 18 U.S.C. section 1734.

This feature is available to Subscribers Only
Sign In or Create an Account Close Modal