Abstract
PU.1 is a member of the Ets family of transcription factors and plays an essential role in the development of both myeloid and lymphoid cells. To examine zebrafish pu.1 (zpu.1) expression in subpopulations of blood cells during zebrafish development, we linked a 9-kb zebrafish genomic fragment upstream of the zpu.1 initiator codon to green fluorescent protein (GFP) and microinjected this construct to generate stable transgenic lines. GFP-positive fluorescent myeloid precursors were observed migrating from the anterolateral mesoderm in living embryos from 16 to 28 hours after fertilization (hpf) in a pattern that overlaps the expression pattern of endogenous zpu.1 mRNA. Analysis of larval histologic sections revealed GFP-expressing hematopoietic cells in the developing zebrafish kidney. Flow cytometric analysis of cells from adult whole kidney marrow revealed 2 discrete subpopulations of GFP-positive cells, which after cell sorting exhibited either myeloid or early lymphoid morphology. Thus, the zebrafish zpu.1 promoter fragment used here is capable of driving reporter gene expression in subsets of embryonic and adult hematopoietic cells. These transgenic lines will be useful to dissect the cellular and molecular control of myeloid cell differentiation, and this promoter fragment may prove useful in the development of zebrafish models of acute myeloid leukemia.
Introduction
PU.1 is an Ets family transcription factor that plays an essential role in the development of both myeloid (granulocytes and monocytes/macrophages) and lymphoid cells.1,2 Numerous studies of both human and murine tumor-derived cell lines and tissue samples have shown that PU.1 expression is restricted to hematopoietic cell lineages.1-4 Studies of the promoter and enhancer sequences of a number of genes expressed by hematopoietic cells have defined PU.1-dependent regulatory elements, including components of the B-cell receptor and an array of adhesion molecules, growth factor receptors, and lysozymal enzymes expressed by myeloid cells.5
During hematopoiesis, PU.1 is up-regulated with myeloid and down-regulated with erythroid commitment.6 In one PU.1-deficient mouse, embryos die in late gestation and exhibit an array of functional deficiencies in macrophages, granulocytes, and progenitors of B and T lymphocytes.7 Another PU.1-deficient mouse is able to produce live pups that die soon after birth from septicemia.8 These mice also have impaired myeloid development and lack B lymphocytes. Several recent studies have shown that PU.1 blocks erythroid differentiation by directly antagonizing GATA-1 activity.9,10 The PU.1 promoter is regulated by PU.1 itself in an autoregulatory loop, and CCAAT/enhancer-binding protein α (C/EBPα) can induce PU.1 gene expression, suggesting a direct role for both proteins in the regulation of the PU.1 gene.11 Overexpression of PU.1 in transgenic mice driven by the spleen focus-forming virus (SFFV) long-terminal-repeat (LTR) results in erythroleukemia.12
Analysis of the murine PU.1 promoter has shown that as little as 334 bp of the PU.1 promoter confers myeloid-specific gene expression in transient transfection assays.13,14 However, this genomic fragment, as well as a longer fragment extending up to 2.1 kb, was unable to drive reporter gene expression in multiple lines of transgenic mice (D.G. Tenen, oral communication, January 2001). Recently, transgenic mice have been generated using a 91-kb murine PU.1 genomic DNA fragment to direct reporter gene expression in a pattern similar to that observed for the endogenous PU.1 gene.15
The zebrafish (Danio rerio) animal model offers a unique opportunity for the in vivo analysis of genes required for the control of normal vertebrate myeloid cell development. Embryonic zebrafish development is extremely rapid; rudiments of the major organs, including a functional heart and circulating blood cells, develop within 30 hours after fertilization. Zebrafish pu.1 (zpu.1) expression is detectable by whole-mount RNA in situ hybridization in hematopoietic cells between 12 and 30 hours after fertilization (hpf) but not in older embryos.16,17 Expression of zpu.1 is observed by 12 hpf in the anterior yolk region of the developing embryo, followed by expression in the posterior intermediate cell mass (ICM). The posterior expression is lost at approximately 24 hpf, whereas anterior expression persists and is observed in cells spreading anteriorly over the yolk until 28 to 30 hpf. The zpu.1-expressing cells appear later in development than those expressing scl, lmo2, and gata2, which is consistent with findings in mammals, suggesting that the expression of zpu.1 regulates the differentiation of hematopoietic stem cells along the myeloid lineage.
The use of a green fluorescent protein (GFP) transgene to study gene expression in zebrafish is particularly attractive since GFP fluorescence provides a rapid real-time approach for in vivo analysis of the spatial and temporal expression of developmentally regulated genes in the optically clear zebrafish embryo. Several GFP-expressing transgenic zebrafish lines have already been developed, allowing the study of gene expression and developmental processes (reviewed in Gong and Hew18 ). Although there are transgenic zebrafish models expressing GFP under the control of erythroid and lymphoid promoters, there is only one report of a transgenic zebrafish in which GFP is targeted to early myeloid cells of embryonic zebrafish.19-21
Here we report that a 9.0-kb fragment of zebrafish sequences upstream of the zpu.1 initiator codon is able to drive GFP expression in myeloid cells from 12 to 28 hpf in a pattern overlapping the expression of endogenous zpu.1 mRNA. Histologic sections from larval transgenic animals revealed GFP-expressing hematopoietic cells in the developing zebrafish kidney, which is the hematopoietic organ in adult teleosts. Analysis of cells from adult zebrafish kidney by flow cytometry and cell sorting revealed discrete subpopulations of GFP-positive cells, which exhibited either myeloid or lymphoid morphology, indicating that zpu.1 is expressed in these cells during definitive hematopoiesis in adult zebrafish.
Materials and methods
Cloning and sequencing of zebrafish zpu.1genomic DNA
An arrayed zebrafish genomic bacterial artificial chromosome (BAC) library (Genome Systems, St Louis, MO) was screened with a 32P-labeled zebrafish pu.1 cDNA probe, resulting in the isolation of 2 positive clones, 184:L24 and 145:H24. The identities of the 2 isolated BAC clones were reconfirmed by polymerase chain reaction (PCR) using zpu.1-specific primers. BAC clone 184:L24 was used to generate the subsequent enhanced GFP-reporter plasmid constructs (Clontech, Palo Alto, CA).
Plasmid constructs
Construct 5pu.1-GFP was generated by ligating a 5-kb PstI/NarI fragment containing the putative zebrafish pu.1 (zpu.1) promoter to a GFP reporter gene, enhanced GFP (EGFP), using a NarI/BamHI linker containing the 5′ flanking sequences upstream of the putative zpu.1 transcription start sites. The linker was amplified by the polymerase chain reaction (PCR) using a primer (Oligo 1, TTCCTACGGCCACTGTCAGG) complementary to genomic sequences just 5′ of the NarI site and a primer (Oligo 2, CGCGGATCCGCGGTTGGGTTCCTCGCCTCGCCTG) that is complementary to the cDNA sequence just 5′ of the zpu.1 translation start. Primer (Oligo 2) contained a BamHI site to facilitate subsequent cloning. PCR was carried out using the Advantage PCR System (Clontech) for 35 cycles (94° C, 30 seconds; 65° C, 30 seconds; 68° C, 2 minutes). After digestion with BamHI and NheI, the amplified fragment was gel purified and ligated with the PstI/NarI fragment of the putative zpu.1 promoter into the BamHI-PstI–digested EGFP vector (Clontech), resulting in construct 5pu.1-GFP. The construct 9zpu.1-GFP was generated by ligating an additional 4 kb of zpu.1 genomic sequences upstream of the PstI site to the 5′ end of the reporter gene in construct 5pu.1-GFP.
Microinjection of zebrafish embryos
The PU.1/GFP transgene was excised from plasmid vector of 9zpu.1-GFP by restriction digestion with Afl II and isolated following electrophoresis in low-melting agarose gel. DNA fragments were purified using Geneclean II Kit (Bio101 Inc, Montreal, QC, Canada) and resuspended in 5 mM Tris, 0.5 mM EDTA (ethylenediaminetetraacetic acid), and 0.1 M KCl at a final concentration of 100 mg/mL prior to microinjection. Single-cell wild-type embryos were injected as described.22 Approximately 200 to 300 pg of linearized DNA were injected into one-cell–stage embryos.
Fluorescent microscopic observation and imaging
Embryos and adult fish were anesthetized using tricaine (Sigma A-5040; Sigma, St Louis, MO), as described previously,23 and examined under a fluorescein isothiocyanate (FITC) filter on a fluorescent Leica microscope (MZFLIII) (Heidelberg, Germany) equipped with a Hammamatsu Orca 3CCD digital camera and accompanying software (Hammamatsu City, Japan).
Identification of germ line transgenic fish
Embryos injected with the 9zpu.1-GFP transgene were raised to maturity and incrossed. Embryos from these crosses were analyzed for GFP expression, isolated, and raised establishing a number of stable transgenic lines.
Whole-mount RNA in situ hybridization
Sense (control) and antisense digoxigenin (DIG)–labeled RNA probes were generated from a zpu.1 cDNA clone (a gift from G. Lieschke, Ludwig Institute for Cancer Research, Melbourne, Australia). RNA in situ hybridizations were performed as described.17 In double-labeling assays for detecting GFP and mRNA expression, embryos were processed for mRNA in situ hybridization as described7 ; however, prior to the antibody reaction for detecting the mRNA, the following steps were added for the visualization of GFP-positive cells. Anti-GFP–rabbit–conjugated antibody (Molecular Probes, Eugene, OR) was added at a final dilution of 1:1000 and embryos were incubated at 4° C overnight. The following morning, embryos were washed in blocking solution. Embryos were then incubated in 100 μL of 1:100 antirabbit Alexa (Molecular Probes) overnight at 4° C. Embryos were then washed 3 times for 20 minutes in blocking solution and incubated in anti-DIG–alkaline phosphatase–conjugated antibody at a final dilution of 1:5000 in blocking solution overnight at 4° C. The following morning, embryos were rinsed in blocking solution and then for 1 hour in Maleic acid buffer with Tween (MABT), followed by 30 minutes in MABT. After rinsing 3 times for 10 minutes each in Tris (pH 8.2) staining buffer, embryos were carefully transferred into 24-well cell culture plates for staining with Fast Red using tablets from Roche Biochemicals (Indianapolis, IN), according to the manufacturer's protocol. The staining reaction was performed in the dark to keep background staining to a minimum. Once the desired level of staining was seen, embryos were washed gently with copious amounts of phosphate-buffered saline with Tween (PBST). Embryos were then mounted in Vectashield Mounting Medium (Vector Laboratories, Burlingame, CA), and embryos were examined using a fluorescent microscope. RNA in situ hybridization on paraffin-embedded tissues was performed as described previously.24 Confocal images were captured with a Zeiss LSM 510 META-NLO laser-scanning microscope and a Zeiss LD40× 0.6 NA Achroplan objective lens (Zeiss, Oberkochen, Germany).
Histology and cytology
Adult animals that were killed were placed in 4% paraformaldehyde at 4° C for 4 days and then transferred to 0.25 M EDTA (pH 8.0) for no fewer than 2 days. Fish were then dehydrated in alcohol, cleared in xylene, and infiltrated with paraffin. Four-micrometer tissue sections from paraffin-embedded tissue blocks were placed on charged slides, deparaffinized in xylene, rehydrated through graded alcohol solutions, and stained with hematoxylin/eosin. Cytospin preparations were performed using 1 × 10⁵ to 2 × 10⁵ kidney cells or splenocytes cytocentrifuged at 300 rpm for 3 minutes onto glass slides (Shandon, Waltham, MA). Blood smears and cytospin preparations were stained with May-Grünwald and Giemsa stains (Fluka, Buchs, Switzerland) for morphologic analyses and differential cell counts and were examined using an Olympus BX-51 microscope (Olympus, Melville, NY) equipped with a QImaging Micropublisher digital camera (QImaging, Burnaby, BC, Canada) and accompanying software.
Immunohistochemistry
Paraffin sections (4 μm) were used for immunohistochemical determination of GFP protein expression. Slides were deparaffinized and pretreated with 1.0 mM EDTA (pH 8.0; Zymed, South San Francisco, CA) in a steam pressure cooker (Decloaking Chamber; BioCare Medical, Walnut Creek, CA), according to the manufacturer's instructions, followed by washing in distilled water. All further steps were performed at room temperature in a hydrated chamber. Slides were pretreated with Peroxidase Block (DAKO, Carpinteria, CA) for 5 minutes to quench endogenous peroxidase activity, followed by goat serum diluted 1:5 in 50 mM Tris-Cl (pH 7.4) for 20 minutes at room temperature to block nonspecific binding sites. Primary murine antibody to GFP (Clone JL-8; Clontech) was applied at a 1:1000 dilution in 50 mM Tris-Cl (pH 7.4) with DAKO diluent (DAKO) for 1 hour. After washing in 50 mM Tris-Cl (pH 7.4), goat antibody to mouse horseradish peroxidase–conjugated antibody (Envision detection kit; DAKO) was applied for 30 minutes. Immunoperoxidase staining was developed with a diaminobenzidine (DAB) and chromogen kit (DAKO), according to the manufacturer's instructions, and examined using an Olympus BX41 microscope equipped with an Olympus QColor 3 camera and accompanying acquisition software.
Flow cytometry
Hematopoietic cells isolated from zebrafish were processed as described,25 washed, and resuspended in ice-cold 0.9 × phosphate-buffered saline (PBS) + 5% fetal bovine serum (FBS) and passed through a 40-μm filter. Propidium iodide (PI; Sigma) was added to 1 μg/mL to exclude dead cells and debris. Fluorescence-activated cell sorter (FACS) analysis and sorting was performed based on PI exclusion, forward scatter, side scatter, and GFP fluorescence using a FACS Vantage flow cytometer (Becton Dickinson, Franklin Lakes, NJ). Target cell populations were sorted twice to optimize cell purity. Mean cell sizes of scatter populations were determined by linear normalization to 2-μm and 10-μm latex beads using forward scatter.25
RT-PCR analysis
GFP-positive, FACS-sorted blood cell populations were obtained from adult zebrafish kidneys and transferred into an RNase-free tube containing 100 μLof Trizol (Gibco, Carlsbad, CA) and 25 μg of glycogen (Ambion,Austin, TX). Total RNA was extracted from 1000 to 2000 sorted cells, according to the manufacturer's protocol, and then resuspended into 10 to 20 μL of diethyl pyrocarbonate (DEPC) water. Total RNA aliquots corresponding to 10 or 100 cells were used as template, and One-step reverse transcriptase–PCR (RT-PCR; Qiagen, Valencia, CA) was performed in a volume of 25 μL. Ten-nanogram aliquots of total kidney cell RNA and 100 cells aliquots from the GFP-negative “lymphoid compartment” were used as controls. All primers except ZIgLC3 and Zrag2 primers were designed to span one or more introns. Primer sequences for zebrafish genes in the lymphoid lineages26 are as follows: rag2 (forward, ACGCTCATGTCCAACTGGGATAT; and reverse, TTGAGGCGGACAGTCACCTACACT); IgLC3 (forward, GTTCCTGACCAGTGCAGAGA; and reverse, CCTGATCACCTCCAGCATGA); and lck (forward,AGATGAATGGTGTGACCAGTGTA; and reverse, GATCCTGTAGTGCTTGATGATGT). Primer sequences of the other zebrafish genes are as follows: mpo (forward, GCTGCTGTTGTGCTCTTTCA; and reverse, TTGAGTGAGCAGGTTTGTGG); gata1 (forward, ATTATTCCACCAGCGTCCAG; and reverse, CCACTTCCACTCATGGGACT); pu.1 (forward, CAGAGCTACAAAGCGTGCAG; and reverse, GCAGAAGGTCAAGCAGGAAC); α-hemaglobin (forward, TTGTCTACCCCCAGACCAAG; and reverse, AGAGCCAGAGCTGAGAGGAA); scl (forward, AGCCATAAGGTGCAGACCAC; and reverse, CGTTGAGGAGCTTAGCCAGA); and β-actin (forward, CCCAGACATCAGGGAGTGAT; and reverse, CACCGATCCAGACGGAGTAT). RT-PCR conditions are as follows: 50° C, 32 minutes; 95° C, 15 minutes; 35 cycles of 94° C, 30 seconds; 60° C, 30 seconds; 72° C, 1 minute; then 72° C, 10 minutes; 4° C stored. PCR products were separated on a 1.2% agarose gel.
Results
The zpu.1 promoter directs EGFP expression in transgenic zebrafish
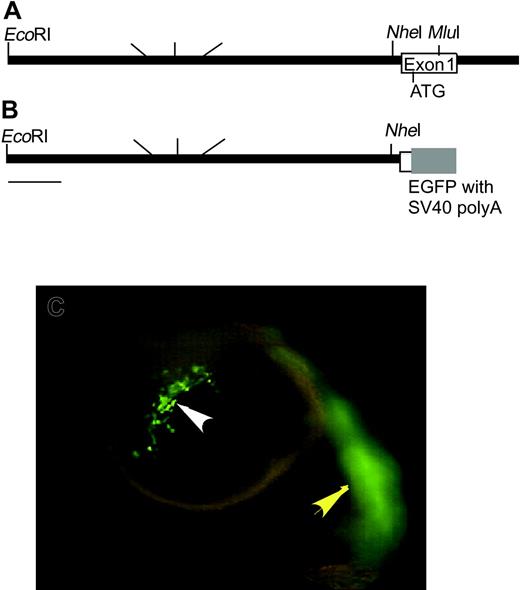
To study the development of early myeloid subpopulations, we tested the ability of promoter fragments of zpu.1 to drive EGFP expression in the myeloid cells of transgenic lines.16,17 An EcoRI and NarI restriction fragment was found to span approximately 9 kb of sequences upstream of the zpu.1 initiation codon (Figure 1A). A linker spanning the NarI site and the 5′ untranslated region (UTR) just upstream of the zpu.1 start codon was amplified by PCR and used to insert the 9-kb EcoRI-NarI fragment upstream of EGFP into pSKII (Figure 1B). Injection of this construct (referred to as 9zpu.1-EGFP) into one-cell–stage zebrafish embryos resulted in EGFP expression within myeloid cells migrating over the anterior yolk at 22 hpf (Figure 1C white arrowhead). Expression in muscle cells of the trunk was also noted (Figure 1C yellow arrowhead). To establish stable transgenic lines, one-cell–stage embryos injected with linearized 9zpu.1-EGFP were grown to adulthood. Ninety adults were grown from injected embryos and 7 transgenic founders were identified as capable of producing offspring that expressed the EGFP transgene within 24 hpf (Table 1). The transmission rates varied from 4% to 50% among the progeny of the transgenic founders, indicating germ cell mosaicism in genomic transgene integration, consistent with previous transgenic fish reports.18,27 All of the transgenic founders produced embryos that expressed EGFP at detectable levels using a dissecting microscope equipped with epifluorescence. However, individual founder lines displayed different levels of EGFP expression and some lines exhibited either ectopic expression in the brain and eyes or ubiquitous expression (Table 1). The lines were assigned names according to standard zebrafish nomenclature and are hereafter referred to as TG(zpu.1:EGFP) with allele designations df1 through df7. The rate of transgene transmission in the F2 incross of F1 brothers and sisters, each of whom harbored the transgene, was consistent with a dominant mendelian inheritance ratio (approximately 75%), suggesting that each transgene was integrated into a single chromosome locus. So far, the stable transmission and expression of the EGFP transgene have been maintained over 3 generations. For all studies described in this report, allele 5 (TG(zpu.1:EGFP)df5) was used because it exhibited the brightest EGFP fluorescence in developing myeloid cells.
Structure of the zpu.1 promoter and transient expression of EGFP. (A) Restriction map of the genomic region upstream of the first exon of zpu.1. (B) Restriction map of the zpu.1 genomic fragment and the EGFP transgene in the 9pu.1-EGFP construct used for injection to establish transgenic lines. (C) Fluorescent image of 22 hpf living embryos injected with linearized 9pu.1-GFP at the one-cell stage. The white arrowhead indicates zpu.1-expressing myeloid cells migrating from the anterolateral mesoderm over the yolk; and the yellow arrowhead, fluorescence in skeletal muscle. Lateral views, anterior is to the left, dorsal is up. Original magnification × 40.
Structure of the zpu.1 promoter and transient expression of EGFP. (A) Restriction map of the genomic region upstream of the first exon of zpu.1. (B) Restriction map of the zpu.1 genomic fragment and the EGFP transgene in the 9pu.1-EGFP construct used for injection to establish transgenic lines. (C) Fluorescent image of 22 hpf living embryos injected with linearized 9pu.1-GFP at the one-cell stage. The white arrowhead indicates zpu.1-expressing myeloid cells migrating from the anterolateral mesoderm over the yolk; and the yellow arrowhead, fluorescence in skeletal muscle. Lateral views, anterior is to the left, dorsal is up. Original magnification × 40.
Comparison of expression levels in transgenic founders
Allele . | Hematopoietic expression level . | Nonhematopoietic expression level . |
|---|---|---|
| 1 | ++ | Muscle |
| 2 | ++ | Muscle, eye |
| 3 | + | Muscle |
| 4 | + | Muscle |
| 5 | +++ | Muscle, CNS |
| 6 | - | Global |
| 7 | - | Global |
Allele . | Hematopoietic expression level . | Nonhematopoietic expression level . |
|---|---|---|
| 1 | ++ | Muscle |
| 2 | ++ | Muscle, eye |
| 3 | + | Muscle |
| 4 | + | Muscle |
| 5 | +++ | Muscle, CNS |
| 6 | - | Global |
| 7 | - | Global |
The official name for these lines is TG(zpu.1:EGFP). Expression level was determined by observation at 24 hpf using a dissection microscope equipped with epifluorescence.
+, ++, and +++ indicate relative expression levels; CNS, central nervous system; and -, not observed.
EGFP expression pattern in transgenic embryos
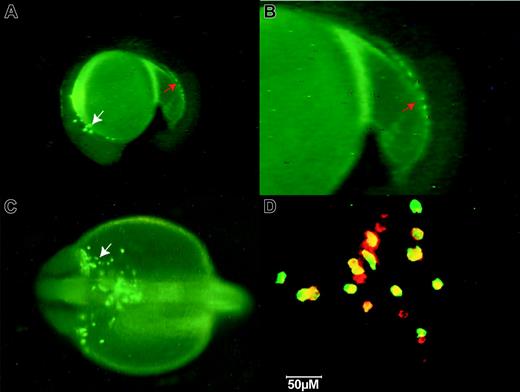
EGFP expression in the TG(zpu.1:EGFP)df5 line was detected at low levels as early as the 6-somite stage within the anterior-lateral mesoderm when the endogenous zpu.1 transcript is first detectable by in situ hybridization.16 By 22 hpf, the pattern of expression EGFP in the transgenic line was also indistinguishable from that of endogenous zpu.1 RNA and was observed in the anterior-lateral mesoderm and in the posterior ICM, with EGFP-expressing cells spreading over the yolk cell (Figure 2A-C). Confocal coexpression studies using an anti-GFP antibody and an antisense zebrafish zpu.1 mRNA probe revealed that 95% of cells expressed both GFP and pu.1 mRNA (Figure 2D yellow cells). At 24 hpf, the ectopic EGFP expression in muscle and hindbrain became evident and persisted through early larval stages (data not shown). Endogenous zpu.1 mRNA is not detectable in these locations, suggesting that this aspect of the EGFP expression in these lines is ectopic and may result from the lack of regulatory sequences in the 9 kb of zpu.1 promoter that are responsible for suppressing embryonic muscle and neural zpu.1 expression.
Fluorescent images of TG(zpu.1:EGFP)df5 embryos at 22 hpf. (A) Lateral view of GFP-positive cells. (B) Magnified lateral view of the posterior tail in panel A. (C) Dorsal view of the anterior head region. The white arrows indicate zpu.1-expressing myeloid cells migrating from the anterolateral mesoderm over the yolk; and the red arrows, zpu.1 cells in the ICM. (D) Confocal image of 2-color in situ hybridization of cells migrating over the anterior yolk at 22 hpf using a zpu.1 RNA probe (red) and an antibody to EGFP (green). Yellow indicates coexpression. Original magnification × 40 (A, D); × 100 (B-C).
Fluorescent images of TG(zpu.1:EGFP)df5 embryos at 22 hpf. (A) Lateral view of GFP-positive cells. (B) Magnified lateral view of the posterior tail in panel A. (C) Dorsal view of the anterior head region. The white arrows indicate zpu.1-expressing myeloid cells migrating from the anterolateral mesoderm over the yolk; and the red arrows, zpu.1 cells in the ICM. (D) Confocal image of 2-color in situ hybridization of cells migrating over the anterior yolk at 22 hpf using a zpu.1 RNA probe (red) and an antibody to EGFP (green). Yellow indicates coexpression. Original magnification × 40 (A, D); × 100 (B-C).
EGFP expression in transgenic zebrafish larvae
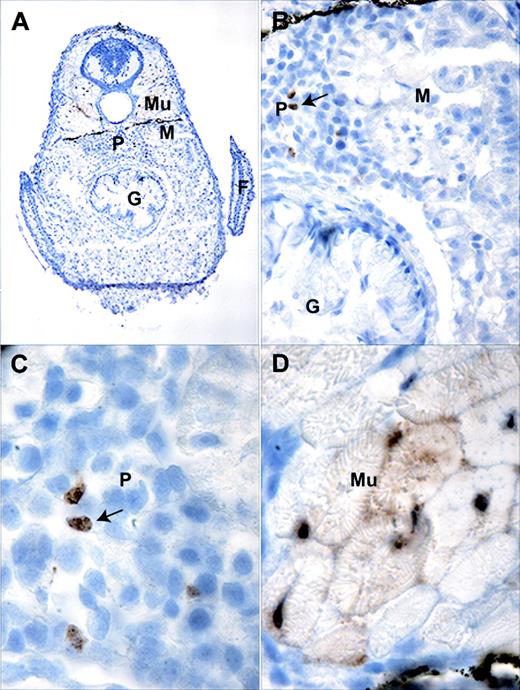
In the zebrafish, embryonic zpu.1 expression is undetectable by RNA in situ hybridization after 30 hpf.16,17 After 7 to 10 days after fertilization (dpf) and throughout adulthood, the major site of definitive hematopoiesis in the zebrafish is within the interstitium of the kidney, known as the “kidney marrow.”28 In the free-swimming larvae of fish and amphibians, the pronephros, consisting of bilateral tubules and glomeruli, forms first and later gives rise to the mesonephros, which contains the renal tubules (reviewed in Drummond29 ). Immunohistochemical examination of tissue sections from 20-day-old TG(zpu.1:EGFP)df5 transgenic larvae provided evidence of EGFP expression by cells in kidney and other tissues (Figure 3A), which was not detectable by epifluorescence analysis of living fish. We found evidence of GFP-positive hematopoietic cells in the interstitial kidney marrow cells located between the glomeruli in the pronephros (Figure 3B-C) in a region also known to contain gata1-positive cells.20 By contrast, EGFP-expressing cells were not evident in the mesonephros at this stage of development. We also detected EGFP expression in the muscle cells of the larvae (Figure 3D), consistent with our observations in living embryos.
Immunohistochemistry of TG(zpu.1:EGFP)df5 20-day-old transgenic larvae. (A) Transverse section at the level of the pectoral fin (F) showing the pronephros (P), mesenephros (M), muscle (Mu), and gut (G). Enlarged views of the (B) mesonephros and pronephros junction, (C) pronephros, and (D) muscle. Original magnifications × 100 (A), × 200 (B), and × 1000 (C-D). Arrows indicate positive cells.
Immunohistochemistry of TG(zpu.1:EGFP)df5 20-day-old transgenic larvae. (A) Transverse section at the level of the pectoral fin (F) showing the pronephros (P), mesenephros (M), muscle (Mu), and gut (G). Enlarged views of the (B) mesonephros and pronephros junction, (C) pronephros, and (D) muscle. Original magnifications × 100 (A), × 200 (B), and × 1000 (C-D). Arrows indicate positive cells.
EGFP expression in adult transgenic zebrafish kidney
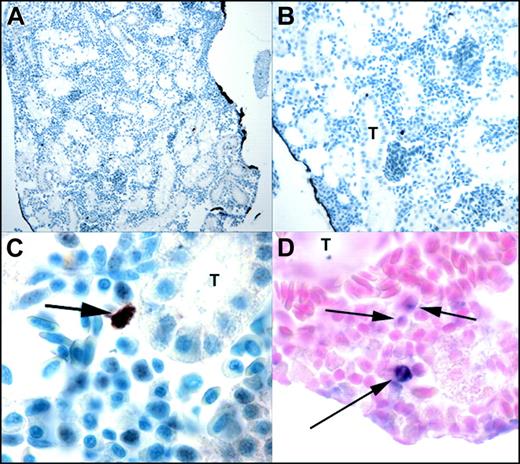
We examined tissue sections of adult zebrafish (6 months old) for EGFP expression by immunohistochemistry (Figure 4A). In adults, EGFP expression was no longer detectable in muscle cells and was restricted to a small fraction of cells in the kidney marrow. At this stage, development of the zebrafish kidney is complete, and hematopoietic cells are situated between the renal tubules (Figure 4B). A small number of hematopoietic cells were found to be EGFP-positive (Figure 4C), similar to the number of pu.1-positive cells observed by RNA in situ hybridization on similar sections from the same fish (Figure 4D).
Immunohistochemistry of TG(zpu.1:EGFP)df5 adult kidney marrow. (A-C) Transverse sections showing EGFP-positive cells in the kidney marrow of transgenic adults at progressively increased magnification, and (D) transverse section of the kidney of transgenic fish analyzed with zebrafish pu.1 antisense RNA. T indicates renal tubule. Original magnifications × 100 (A), × 200 (B), and × 1000 (C-D). Arrows indicate positive cells.
Immunohistochemistry of TG(zpu.1:EGFP)df5 adult kidney marrow. (A-C) Transverse sections showing EGFP-positive cells in the kidney marrow of transgenic adults at progressively increased magnification, and (D) transverse section of the kidney of transgenic fish analyzed with zebrafish pu.1 antisense RNA. T indicates renal tubule. Original magnifications × 100 (A), × 200 (B), and × 1000 (C-D). Arrows indicate positive cells.
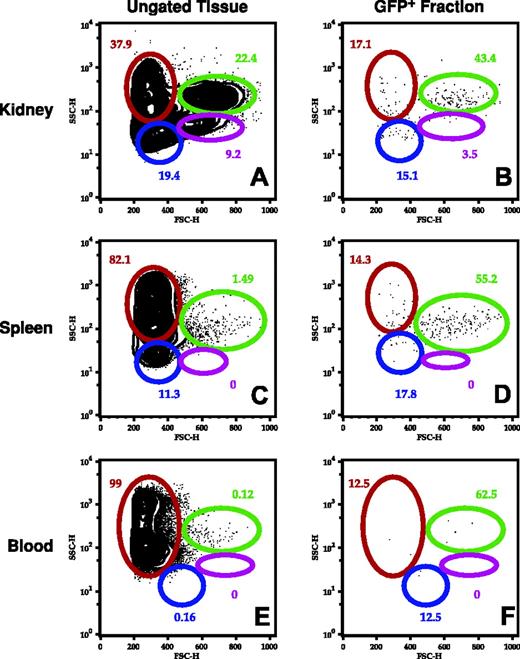
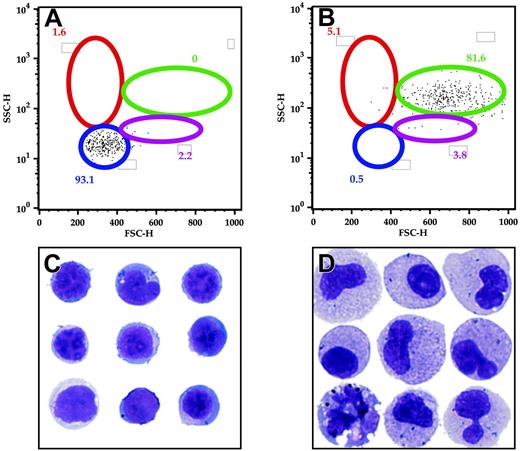
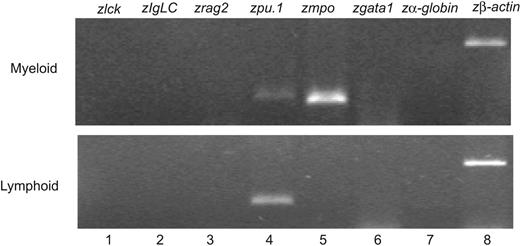
To identify the hematopoietic cells expressing EGFP driven by the zpu.1 promoter, we examined living cells from the kidney, spleen, and blood by FACS. In our transgenic fish, the cells expressing EGFP accounted for 1.8% ± 0.3% (n = 8) of all hematopoietic cells in the kidney, and they were enriched in the myeloid and “lymphoid” cell light-scatter gates (Figure 5A-B). In the spleen, EGFP-expressing cells accounted for 1.1% ± 0.4% (n = 6) of the cells, with the majority of these cells falling within the myeloid scatter fraction (Figure 5C-D). In the blood, only a very small fraction (0.0086%) of cells expressed EGFP, predominantly within the myeloid cell population (Figure 5E-F). We used cell sorting to analyze the morphology of the EGFP-positive kidney marrow cells in the lymphoid (Figure 6A) and myeloid (Figure 6B) compartments. By analysis of May-Grünwald–stained cells, the cells in the lymphoid compartment had the appearance lymphoid or undifferentiated early progenitor cells (Figure 6C), while cells in the myeloid compartment were predominantly monocytic or bilobed neutrophilic precursors, suggesting that zpu.1 is down-regulated at the metamyelocyte stage, relatively late in myeloid cell development (Figure 6D). Likewise, cells in the myeloid compartment expressed both zpu.1 and zmpo, as demonstrated by RT-PCR at the 10-cell level (Figure 7 top, lanes 4-5) and 100-cell level (data not shown). The fact that GFP-positive cells in the lymphoid compartment expressed zpu.1 (Figure 7 bottom, lane 4) but lacked the expression of zebrafish mpo or the lymphoid markers lck, rag2, and Ig light chain26 at the 10-cell level (Figure 7 bottom, lanes 1-3) and 100-cell level (data not shown), suggests that these cells represent early hematopoietic or immature lymphoid cells. To further analyze the GFP-positive cells in the lymphoid compartment, we also examined expression of the stem cell marker scl. The cells also did not express scl at the 10- and 100-cell levels (Figure S1; see the Supplemental Figure link at the top of the online article on the Blood website). Thus the GFP-positive cells in our study with light-scatter properties similar to lymphoid cells lack expression of any of the markers of differentiated hematopoietic cells that were tested except zpu.1, suggesting that they represent early hematopoietic cells that lack scl expression or immature lymphoid cells.
FACS analysis of hematopoietic cells from the TG(zpu.1:EGFP)df5 adult fish. Cells from kidney (A-B), spleen (C-D), and blood (E-F) from adult transgenic zebrafish were isolated and analyzed by FACS for total cellular subfractions by light-scatter gating (A,C,E) and the same subfractions of EGFP-positive cells (B,D,F). Gated populations are as follows: erythrocytes (red), lymphocytes (blue), granulocytes and monocytes (green), and blood cell precursors (purple). Cell size is represented by forward scatter (FSC; abscissa), and granularity is represented by side scatter (SSC; ordinate). Mean percentage of cells is indicated for each gated subpopulation.
FACS analysis of hematopoietic cells from the TG(zpu.1:EGFP)df5 adult fish. Cells from kidney (A-B), spleen (C-D), and blood (E-F) from adult transgenic zebrafish were isolated and analyzed by FACS for total cellular subfractions by light-scatter gating (A,C,E) and the same subfractions of EGFP-positive cells (B,D,F). Gated populations are as follows: erythrocytes (red), lymphocytes (blue), granulocytes and monocytes (green), and blood cell precursors (purple). Cell size is represented by forward scatter (FSC; abscissa), and granularity is represented by side scatter (SSC; ordinate). Mean percentage of cells is indicated for each gated subpopulation.
FACS analysis and morphology of hematopoietic cells from the TG(zpu.1: EGFP)df5 adult kidney. GFP-sorted cells were further separated into lymphoid (A) and myeloid (B) compartments, and morphology for the lymphoid-sorted (C) and myeloid-sorted (D) cells was evaluated by cytospin. Gated populations are as described.25 Populations of cells within each gate are described as mean percentages of total cells. Original magnification × 1000 (C-D).
FACS analysis and morphology of hematopoietic cells from the TG(zpu.1: EGFP)df5 adult kidney. GFP-sorted cells were further separated into lymphoid (A) and myeloid (B) compartments, and morphology for the lymphoid-sorted (C) and myeloid-sorted (D) cells was evaluated by cytospin. Gated populations are as described.25 Populations of cells within each gate are described as mean percentages of total cells. Original magnification × 1000 (C-D).
RT PCR analysis of hematopoietic cells from the TG(zpu.1:EGFP)df5 adult kidney. GFP-sorted cells from the myeloid and lymphoid light-scatter compartments were analyzed for lineage-specific expression of the zebrafish lck, IgLC, rag2, pu.1, mpo, gata1, α-hemaglobin, and β-actin genes.
RT PCR analysis of hematopoietic cells from the TG(zpu.1:EGFP)df5 adult kidney. GFP-sorted cells from the myeloid and lymphoid light-scatter compartments were analyzed for lineage-specific expression of the zebrafish lck, IgLC, rag2, pu.1, mpo, gata1, α-hemaglobin, and β-actin genes.
Discussion
Vertebrate hematopoiesis is a complex process that proceeds in distinct phases at changing anatomical sites during development.30 Developmentally regulated transcription factors, including PU.1, play essential roles in controlling this process. In this study, we used the zebrafish animal model and generated transgenic lines using the zpu.1 promoter to drive the expression of EGFP in developing myeloid cells during embryogenesis and in the adult. Our results during embryonic development are similar to those reported by Ward et al,21 indicating that either 5.3- or 9.0-kb genomic fragments are able to drive EGFP expression in zpu.1-expressing cells during zebrafish embryogenesis. However, the recently published papers of Ward et al21 and others16,17 examined zpu.1 expression only during zebrafish embryogenesis and did not address the lineage-restricted expression pattern of this transcription factor during definitive hematopoiesis in juvenile and adult zebrafish.
By examining the developing zebrafish kidney at 20 dpf, we were able to identify EGFP-positive cells in the region of the developing pronephros, the site of definitive hematopoiesis in juvenile fish. EGFP-expressing cells were also present in low numbers in the adult kidney marrow. Further analysis by FACS revealed that these EGFP-positive cells are predominantly myeloid or lymphoid/early hematopoietic cells, indicating that the pu.1 promoter fragment described here is useful for identifying the myeloid and immature hematopoietic cell populations that express this gene and that, as in mammals, zpu.1 is expressed during definitive myelopoiesis. The ectopic EGFP expression in the muscle of transgenic embryos may be due to the lack of a transcriptional silencer in our 9.0-kb promoter fragment that normally suppresses nonhematopoietic cell expression of pu.1. The aberrant EGFP expression in muscle cells, which was observed in all 7 stable transgenic lines, appears to be restricted to embryogenesis, since EGFP expression was not detected in muscle cells of adult zebrafish.
Our studies indicate that in older zebrafish, zpu.1 is expressed in cells with the morphology of immature lymphoid/hematopoietic cells or myeloid cells (Figure 6). Lineage-specific gene expression analysis suggests that zpu.1 is expressed during myeloid differentiation in adults with eventual coexpression of both zpu.1 and zmpo, as has been observed during embryonic development.17 In contrast, zpu.1 is expressed by lymphoid appearing cells that do not express zlck, zRag2, zIgLC, and zmpo, suggesting that zpu.1 is expressed by more primitive progenitor cells that lack expression of the marker genes of hematopoietic differentiation that were studied here. Previous embryonic studies did not show evidence of zpu.1 expression by whole-mount RNA in situ hybridization after 30 hpf16,17 ; however, zpu.1 expression was detectable by RT-PCR in embryos as old as 7 dpf.16 The detection of EGFP expression in juvenile and adult fish in a small subset of hematopoietic cells supports the hypothesis that zpu.1 is expressed by subsets of myeloid progenitor and other immature hematopoietic cells throughout zebrafish development.
Zebrafish have a number of features that facilitate the study of vertebrate hematopoiesis. Because fertilization of eggs is external and embryos are nearly transparent, the cell movement and behavior of labeled hematopoietic cells can be directly monitored in vivo. In addition, many mutants that are defective in hematopoietic development have been generated.31,32 Zebrafish embryos that lack circulating blood cells can survive for several days, so downstream effects of mutations can be analyzed even if specific genes are inactivated in ways that are deleterious to embryonic development. Since the genes and molecular regulation of hematopoiesis are highly conserved throughout vertebrate evolution, results from zebrafish embryonic studies can provide insight into the mechanisms involved in mammalian hematopoiesis.
The stable transgenic zebrafish lines expressing EGFP in subsets of hematopoietic cells have many important uses for future studies of mechanisms regulating hematopoiesis. By capitalizing on the capacity of the zebrafish model to accommodate forward-genetic mutagenesis screens, the TG(zpu.1:EGFP)df5 line will be useful to help identify genes that influence myeloid and lymphoid/progenitor cell development. Adoptive transfer experiments using these EGFP-expressing cells will establish their lineage reconstituting capacity. Furthermore, transgenic zebrafish lines are valuable for the study of molecular pathways in leukemogenesis.24 Thus, the 9.0-kb zpu.1 promoter fragment described here, which is able to drive zpu.1 expression in the myeloid cells of adult zebrafish, should provide a useful means to drive the expression of oncogenes during myelopoiesis to facilitate the development of zebrafish models of acute myeloid leukemia.
Prepublished online as Blood First Edition Paper, March 2, 2004; DOI 10.1182/blood-2003-09-3105.
Supported by grants CA93152 (A.T.L.) and CA96785 (K.H.), and the Dana-Farber/Harvard Cancer Center support grant CA006516, all from the National Institutes of Health, and the Leukemia and Lymphoma Society Specialized Center of Research (SCOR) Program.
The online version of the article contains a data supplement.
The publication costs of this article were defrayed in part by page charge payment. Therefore, and solely to indicate this fact, this article is hereby marked “advertisement” in accordance with 18 U.S.C. section 1734.
We thank Min Deng, Hui-Ying Piao, Alan Flint, Janice Williams, Yu Yang, David Langenau, and Vuong Nguyen for their technical help and support.

This feature is available to Subscribers Only
Sign In or Create an Account Close Modal