Abstract
Lymphoid cells in most patients with chronic lymphocytic leukemia (CLL), when treated with rituximab, become CD20-. This is thought to be due to masking of CD20 by rituximab. We used specific antimouse immunoglobulin antibodies to detect rituximab on the surface of CLL lymphocytes and we demonstrate that rituximab is rarely detectable after therapy. Only 3 of 65 patients with CLL had rituximab detectable on their lymphocytes after rituximab therapy despite the fact that most had no detectable CD20 expression. In vitro mixing of CLL or Raji cells with rituximab demonstrated that rituximab was detectable on the surface of cells due to its binding to CD20. However, the addition of plasma led to the down-modulation of CD20 expression, and the rituximab became undetectable. This down-modulation of CD20 protein expression was associated with a down-modulation of CD20 mRNA. CLL cells that lost their CD20 expression regained CD20 expression after 24 hours in culture. These data suggest that rituximab therapy leads to a substantial but transient down-modulation of CD20 expression and that negativity for CD20 in cells from patients treated with rituximab is not necessarily due to CD20 masking. The importance of this down-modulation in the efficacy of current therapy with rituximab needs further investigation. (Blood. 2003;102: 3514-3520)
Introduction
CD20 is a 33- to 36-kDa transmembrane phosphoprotein that is expressed on the surface of mature B cells and the majority of immature B cells.1,2 In vitro studies have demonstrated a degree of internalization of CD20.3,4 CD20 molecules have been reported to be heavily phosphorylated and involved in proliferation of B cells.5-7 CD20 appears to regulate transmembrane calcium conductance.8 Antibodies directed toward the extracellular portion of CD20 activate tyrosine kinase activity that modulates cell cycle progression by interaction with Src-family kinases.9-12
Immunotherapy using an antibody targeting CD20 (rituximab) has been successful, both alone and in combination with chemotherapy, in treating B-cell lymphoproliferative diseases.13-17 This humanized antibody induces apoptosis through complement fixation and antibody-dependent, cell-mediated cytotoxicity.10,11,18-21 High response rates have been reported with rituximab in various non-Hodgkin lymphomas and chronic B-cell lymphocytic leukemia (CLL).22-26 But despite the presence of CD20 in most B-cell lymphoproliferative diseases, a certain portion of patients are resistant to therapy with rituximab.23,24,27-29
The pharmacokinetics and pharmacodynamics of rituximab are only partially understood. The CD20 antigen cannot be detected by flow cytometry on the surface of B cells in patients treated with rituximab; this is thought to be due to the masking of CD20 by rituximab. An alternative explanation would be down-modulation of CD20 after treatment with rituximab; rare cases of a CD20- clone emerging after treatment with rituximab have been reported.30-32 This presumed masking of CD20 expression by rituximab has not been established. Such verification is difficult because anti-idiotype antibodies for the detection of rituximab are not reliable and show cross-reactivity with other human antibodies. Although rituximab is a humanized antibody, it contains enough mouse sequences to be targeted using antimouse immunoglobulin (Ig) antibodies. Herein, we demonstrate that polyclonal antimouse Ig antibodies that are absorbed against human Ig can detect rituximab on the surface of cells using flow cytometry. These antibodies were specific and did not cross-react with human Ig. The rituximab on the cell surface was quantified to determine whether the absence of detectable CD20 was due to masking or to lack of CD20 protein expression. The data suggest that the inability to detect CD20 on the surface of cells after exposure to rituximab was not always due to masking but rather to down-modulation of the expression of CD20 on the surface of cells. This down-modulation may have implications for the scheduling and dosing of rituximab therapy.
Patients and methods
Peripheral blood samples were collected from 65 patients with B-cell CLL treated on protocols that included rituximab. All samples were collected under protocols approved by the Institutional Review Board after informed consent was obtained from the patients. The diagnosis was established using standard morphologic, immunologic, and molecular evaluations. The samples were analyzed prospectively for CD20 expression and the presence of rituximab on the surface of cells. Most of the patients with CLL were treated with fludarabine, cyclophosphamide, and rituximab, but a few patients were treated on a protocol combining rituximab and alemtuzumab. Samples from untreated patients with CLL were also used in some experiments. Raji cells were obtained from the American Type Culture Collection (Rockville, MD).
Fluorescent phycoerythrin (PE)-conjugated monoclonal antibodies (MoAbs) against CD20 and against mouse Ig were obtained from Becton Dickinson (BD) Biosciences (San Jose, CA) and Jackson Laboratories (West Grove, PA), respectively. Fluorescein isothiocyanate (FITC)-conjugated MoAb against CD19 was obtained from BD Biosciences.
Immunophenotyping and immunohistostaining
Five thousand live-gated events on the lymphocytes were acquired from each tube using a FACSCaliber flow cytometer (BD Biosciences, San Jose, CA). Data were analyzed using the Cell Quest software program (BD Biosciences). For cytoplasmic staining, we used the Cytofix/Cytoperm Kit (BD Biosciences). Immunohistostaining for CD20 was done using the monoclonal L26 (Dako, Glostrup, Denmark) as recommended by the manufacturer.
Cell culture
Cells from the Raji cell line and mononuclear cells from fresh CLL samples, obtained by Ficoll with Histopaque 1077 (Sigma Diagnostics, St Louis, MO), were maintained in RPMI 1640 containing 10% fetal calf serum at 5% CO2. The cells were washed and then treated with rituximab, with or without various concentrations of plasma. The treated and untreated cells were incubated at 37°C from 30 minutes to 120 minutes, depending on the experiment. After the required incubation period, the cells were washed and tested for surface CD20 and rituximab either immediately or after culture for 24 and 48 hours.
Detection of CD20 expression on the surface of cultured cells
Equal numbers of cells (1 million) were stained before and after treatment with rituximab, with or without plasma, with PE- and FITC-labeled G1 MoAb as isotypic control. Similar numbers of cells were also stained with PE-labeled CD20 MoAb and FITC-labeled CD19 antibodies (BD Biosciences). A third aliquot was stained with PE-labeled goat antimouse MoAb (Jackson Laboratories). After the cells were incubated with the antibodies at 4°C for 20 minutes, they were washed twice with 1 × phosphate-buffered saline (PBS) containing 0.1% sodium azide. The washed cells were then fixed with 1% paraformaldehyde.
Quantification of CD20 expression on the surface of fresh cells
The QuantiBRITE system (BD Biosciences) was used for quantification with beads (QuantiBRITE PE beads; BD Biosciences) as recommended by the manufacturer. After the cells were stained, as detailed, a set of 4 precalibrated fluorescently labeled beads was used for standardization before the samples were acquired. Then the cells were acquired, and the QuantiCALC software (BD Biosciences) program was used to convert flow cytometry data and CD20 intensity to the number of antibodies bound per cell (ABC).
RNA and real-time RT-PCR
Total RNA was extracted by the phenol-guanidinium isocyanate method33 using Trizol reagent (Invitrogen, Carlsbad, CA) according to the manufacturer's instructions. Standard reverse transcription (RT) was used. Briefly, the mixture contained 2 μL extracted cellular RNA, 500 μM each dNTP (dinucleotide triphosphate), 200 to 300 ng reverse primer, 1 × first-strand buffer (Life Technologies, Gaithersburg, MD), 10 mM dithiothreitol (DTT; Boehringer Mannheim, Indianapolis, IN), and 10 U Superscript II reverse transcriptase (Life Technologies) in a volume of 10 μL. The reaction mixture was incubated at 50°C for 30 minutes followed by heat inactivation at 72°C for 10 minutes. The RT reactions were run in triplicate for the standards and in duplicate for unknown samples. For each duplicate reaction, a “no-RT” control that included all components of the RT mixture except the reverse transcriptase was run. After the first-strand synthesis, all of the 10-μL RT reaction mixture was used for subsequent polymerase chain reaction (PCR) amplification by adding 40 μL PCR master mix to the same wells. The PCR mixture included 1 × PCR buffer, 200 μM each dNTP, and 1 U Taq polymerase (Roche Molecular Biochemicals, Indianapolis, IN) in a final volume of 50 μL. Amplification and real-time data acquisition were performed in an ABI Prism 7700 sequence detector (Applied Biosystems, Foster City, CA) using the following cycle conditions: initial denaturation at 95°C for 1 minute, followed by 40 cycles of denaturation at 95°C for 12 seconds and annealing at 60°C for 1 minute. As a control, CD20 was amplified from a fresh human tonsillectomy specimen by RT-PCR, and the amplified material was purified by chromatography through a G50 spin column (Boehringer Mannheim). The DNA concentration was determined using an optical density measurement. To determine the number of molecules in the starting material, we used synthetic DNA (sDNA) for β-actin or double-stranded DNA (dsDNA) for CD20 to construct standard curves. Ten-fold serial dilutions of the DNA were used to generate the standard curves.
For quantification, the TaqMan PCR technology34,35 was used. This involved an internally quenched, fluorescently labeled oligonucleotide (probe) that annealed to the denatured target sequence in the segment defined by the PCR primers. On primer extension, the probe was hydrolyzed by virtue of the 5′→3′ exonuclease activity of TaqI polymerase, resulting in the liberation and dequenching of a fluorescent nucleotide. The ABI Prism 7700 sequence detector (Applied Biosystems) detected in real time the fluorescent signal of the hydrolyzed probe and determined the threshold cycle (CT), the cycle number at which the signal exceeds the background by 10 SD or more. The CT value is a precise measure of the number of generated amplicons, which in turn is a measure on a logarithmic scale of the amount of starting DNA target. The RTs and PCRs were run in 96-well plates. Each run consisted of an sDNA or dsDNA standard (typically 200 fg to 20 Pg) in triplicate and 20 unknown samples in duplicate. One “no-RT” well was used for each duplicate unknown to control for tissue-derived DNA contamination, and a “no-template” control well consisting of all the components of the RT and PCR mixtures except RNA was used to control for extraneous DNA contamination.
The following primers were used for the amplification of CD20: 5′-ATGTCTTCACTGGTGGGCC-3′, 5′-TAATCTGGACAGCCCCCAA-3′; and the following 2 primers were used for the amplification of β-actin: 5′-CCCTGGCACCCAGCAC-3′, 5′-GCCGATCCACACGGAGTAC-3′. The following are used as probes for CD20 and β-actin: 5′-CACGCAAAG CTTCTTCATGAGGGAATC T-3′ and 5′-ATCAAGATCATTGCTCCTCCTGAGCGC-3′, respectively.
Results
Detection of rituximab on the surface of cells using flow cytometry and antibody directed against the mouse Ig
To detect rituximab on the cell surface, antibodies were used that specifically detected the mouse sequence in rituximab and did not cross-react with the human Ig. As shown in Figure 1, when CLL cells were mixed with rituximab in ex vivo experiments, the cells became negative for CD20 because of the masking of CD20 by rituximab. Rituximab could be detected more easily on the surface of cells using antimouse Ig antibodies. These antibodies did not bind to human Ig, and no signal was detectable before the rituximab was added.
Ex vivo detection of rituximab on the surface of CLL cells. (A) Negative control and lack of staining noted when isotypic control antibodies were used to stain isolated lymphocytes from a patient with confirmed CLL. CD20 was detected in the gated lymphocytes before adding rituximab (B), and there was no detectable rituximab on the surface of cells using antimouse Ig antibodies (C). After adding rituximab, the cells became completely negative for CD20 (D) and strongly positive for rituximab using antimouse Ig sera (E). The percentage of cells in each quadrant is shown in each plot.
Ex vivo detection of rituximab on the surface of CLL cells. (A) Negative control and lack of staining noted when isotypic control antibodies were used to stain isolated lymphocytes from a patient with confirmed CLL. CD20 was detected in the gated lymphocytes before adding rituximab (B), and there was no detectable rituximab on the surface of cells using antimouse Ig antibodies (C). After adding rituximab, the cells became completely negative for CD20 (D) and strongly positive for rituximab using antimouse Ig sera (E). The percentage of cells in each quadrant is shown in each plot.
When we tested samples from patients treated with regimens containing rituximab, the rituximab was detected in some patients. Examples of detection of rituximab and CD20 in patients with CLL are shown in Figure 2. Masking of CD20 expression was seen in most patients. The CLL cells were detected by their positivity for CD19. All samples tested were positive for CD20 before therapy was initiated.
Examples of detection of rituximab and CD20 in 4 different patients with CLL being treated with rituximab. Varying degrees of masking of CD20 expression (A) and detection of rituximab (B) on CLL cells are shown. In patients 1 and 2 almost all the B cells are positive for rituximab, whereas no rituximab is detected on the surface of cells from patients 3 and 4. Some of the B cells were CD20+ despite the negativity for rituximab. All B cells were negative for both CD20 and rituximab, which suggests that CD20 is no longer expressed on the surface of cells rather than masking by the rituximab. CD20 expression was detected in more than 90% of CD19+ cells in all patients before therapy. The percentage of cells in each quadrant is shown in each plot.
Examples of detection of rituximab and CD20 in 4 different patients with CLL being treated with rituximab. Varying degrees of masking of CD20 expression (A) and detection of rituximab (B) on CLL cells are shown. In patients 1 and 2 almost all the B cells are positive for rituximab, whereas no rituximab is detected on the surface of cells from patients 3 and 4. Some of the B cells were CD20+ despite the negativity for rituximab. All B cells were negative for both CD20 and rituximab, which suggests that CD20 is no longer expressed on the surface of cells rather than masking by the rituximab. CD20 expression was detected in more than 90% of CD19+ cells in all patients before therapy. The percentage of cells in each quadrant is shown in each plot.
We tested 65 CLL samples from patients treated with either fludarabine/cyclophosphamide/rituximab (FCR) or a rituximab and alemtuzumab combination. The samples were collected at various times after the initiation of therapy, varying from 1 to 240 days. Most samples analyzed after rituximab therapy were negative for rituximab (Figure 3), and only 3 samples showed detectable rituximab, one with complete negativity for CD20 and 2 with some positivity for CD20 and rituximab (Figure 3).
Relative levels of CD20 and rituximab on surface of cells as detected by flow cytometry in patients treated with rituximab. Each symbol represents a patient and percentages of positive cells for CD20 and rituximab are shown.
Relative levels of CD20 and rituximab on surface of cells as detected by flow cytometry in patients treated with rituximab. Each symbol represents a patient and percentages of positive cells for CD20 and rituximab are shown.
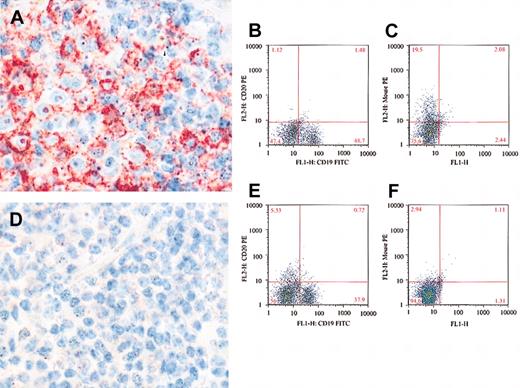
To confirm the flow cytometry data, we analyzed CD20 protein expression using immunohistochemistry and L26 MoAb, which is an antibody that binds to a cytoplasmic epitope of the CD20.36 Bone marrow biopsies from 7 patients with CLL who were negative by flow cytometry for both CD20 and rituximab were tested by immunohistochemistry and L26 antibody. All 7 samples were completely negative for L26 (Figure 4). In contrast, bone marrow samples from 2 patients who were negative for CD20, but positive for rituximab by flow cytometry, showed positivity for L26 (Figure 4). This supports our conclusion that the majority of our patients with CLL who were treated with rituximab were negative for CD20 due to down-modulation rather than masking of CD20 by the rituximab and only when rituximab is detected on the surface of cells was the negativity of CD20 on the surface of cells due to masking.
Detection of CD20 by immunohistochemical stains using L26 MoAb. L26 is positive (red) in a bone marrow lymphoid aggregate from a patient with CLL treated with rituximab (A). The B cells are surface CD20- (B), but rituximab positive (C), indicating masking of the surface CD20. In contrast, bone marrow from a different CLL patient is negative for L26 (D), surface CD20 (E), and rituximab (F), indicating absence of CD20 rather than masking. Original magnification, × 500 (A, D).
Detection of CD20 by immunohistochemical stains using L26 MoAb. L26 is positive (red) in a bone marrow lymphoid aggregate from a patient with CLL treated with rituximab (A). The B cells are surface CD20- (B), but rituximab positive (C), indicating masking of the surface CD20. In contrast, bone marrow from a different CLL patient is negative for L26 (D), surface CD20 (E), and rituximab (F), indicating absence of CD20 rather than masking. Original magnification, × 500 (A, D).
In vitro down-modulation of CD20 by rituximab
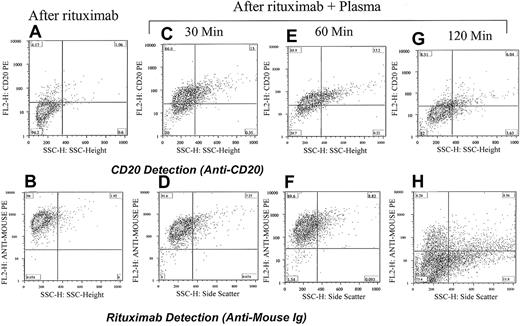
The lack of detectable CD20 and rituximab on the surface of cells was surprising. To assess the effects of rituximab on the expression of CD20 ex vivo, we used CLL and Raji cells to test the hypothesis that exposure to rituximab leads to down-modulation of CD20, hence, lack of CD20 and rituximab expression. Cells from a patient with CLL expressing a large amount of CD20 on their surface were incubated with rituximab alone. The CD20 expression was masked, and the rituximab was easily detected (Figure 5). However, when the patient's own plasma was added in addition to rituximab and incubated for 2 hours, neither CD20 nor rituximab was detectable in the majority of cells. Time course demonstrated that the effects of rituximab and down-modulation of the CD20 could be detected, although at a lower level, at 30 minutes after incubation with plasma (Figure 5). The same experiment was performed using Raji cells and plasma from healthy individuals. Raji cells showed similar, although to a lesser degree, down-modulation. Seven patients with CLL were tested and all showed loss of positivity for both CD20 and rituximab when the plasma was added along with the rituximab. In contrast, rituximab was easily detected on the surface of cells that were incubated for 2 hours with rituximab alone without plasma. These data suggest that plasma contains components necessary for activating a pathway that leads to the down-modulation of the CD20 expression and to the loss of rituximab binding.
Down-modulation of CD20 increases with increasing incubation time with plasma. Adding rituximab to cells from a patient with CLL masks the detection of CD20 (A) and shows strong positivity for rituximab (antimouse Ig; B). Incubating the cells with rituximab and the patient's plasma for 30 minutes partially reduced the detection of CD20 (C) and rituximab is easily detected on the surface of cells (D). The same cells when analyzed 1 hour after incubation with rituximab and plasma became less positive for CD20 (E) and remained strongly positive for rituximab (F). After 120 minutes the cells became completely negative for both CD20 (G) and rituximab (H). The percentage of cells in each quadrant is shown.
Down-modulation of CD20 increases with increasing incubation time with plasma. Adding rituximab to cells from a patient with CLL masks the detection of CD20 (A) and shows strong positivity for rituximab (antimouse Ig; B). Incubating the cells with rituximab and the patient's plasma for 30 minutes partially reduced the detection of CD20 (C) and rituximab is easily detected on the surface of cells (D). The same cells when analyzed 1 hour after incubation with rituximab and plasma became less positive for CD20 (E) and remained strongly positive for rituximab (F). After 120 minutes the cells became completely negative for both CD20 (G) and rituximab (H). The percentage of cells in each quadrant is shown.
Internalization of CD20 and rituximab
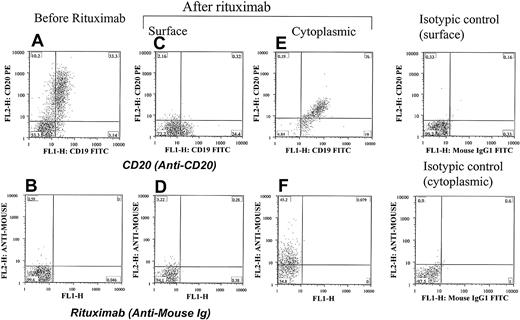
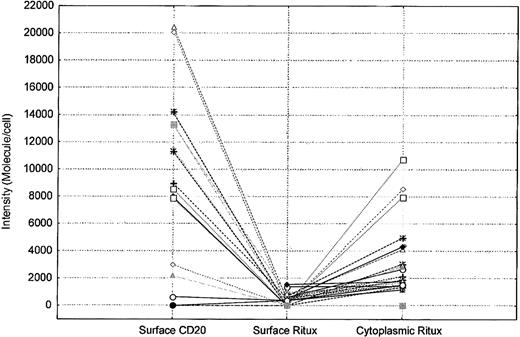
To further explore the effects of rituximab exposure on CD20 expression, the possibility of internalization as a factor in the surface down-modulation of CD20 was investigated. As shown in Figure 6, evidence of internalization of CD20 and rituximab can be demonstrated in some CLL patients. Samples from 26 patients with CLL treated with FCR or a combination of rituximab and alemtuzumab were tested for the presence of cytoplasmic rituximab and CD20. Cytoplasmic analysis for CD20 and rituximab using antimouse Ig was performed by staining cells after permealization of the cell surface using a gentle detergent. The QuantiBRITE bead system was used to quantify the surface and cytoplasmic levels of rituximab. A higher intensity of rituximab was detected in the cytoplasm than on the surface (Wilcoxon matched pairs test, P < .0001; Figure 7). This finding suggested that the lack of CD20 and rituximab detected on the surface of cells was due in part to internalization. Testing of Raji cells yielded the same results. Incubating Raji cells with rituximab and plasma showed some internalization and cytoplasmic staining. However, this internalization did not account for the complete lack of CD20 and rituximab expression because many of the cells remained negative for cytoplasmic CD20 and rituximab.
Internalization of CD20 and rituximab at the early stage of therapy with rituximab. Cells from a patient with CLL were positive for CD20 (A) and negative for rituximab (B) before therapy. They became negative for both CD20 (C) and rituximab (D) 24 hours after rituximab therapy. The same cells showed cytoplasmic positivity for both CD20 (E) and rituximab (F), confirming internalization of the CD20/rituximab complexes. Isotypic controls are shown. The percentage of cells in each quadrant is shown.
Internalization of CD20 and rituximab at the early stage of therapy with rituximab. Cells from a patient with CLL were positive for CD20 (A) and negative for rituximab (B) before therapy. They became negative for both CD20 (C) and rituximab (D) 24 hours after rituximab therapy. The same cells showed cytoplasmic positivity for both CD20 (E) and rituximab (F), confirming internalization of the CD20/rituximab complexes. Isotypic controls are shown. The percentage of cells in each quadrant is shown.
Cytoplasm levels of rituximab are higher than those detected on the surface of cells in patients treated with rituximab. Each symbol represents a patient. The intensity of surface CD20, surface rituximab (Ritux), and cytoplasmic rituximab on the positive cells is shown for each patient.
Cytoplasm levels of rituximab are higher than those detected on the surface of cells in patients treated with rituximab. Each symbol represents a patient. The intensity of surface CD20, surface rituximab (Ritux), and cytoplasmic rituximab on the positive cells is shown for each patient.
Down-modulation of CD20 mRNA by rituximab
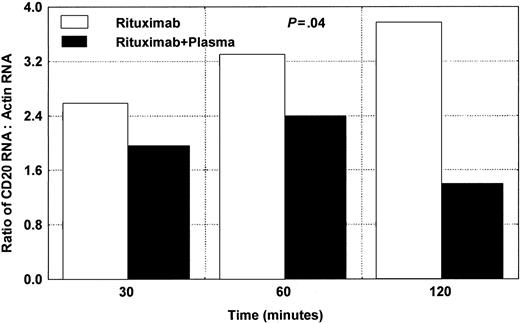
We tested 3 different patients with CLL for the expression of CD20 mRNA using RT/real-time PCR. The cells were exposed to rituximab in the presence or absence of plasma, as shown in Figure 8. Wilcoxon matched pairs test showed significant difference (P = .04) between samples with rituximab alone and samples with rituximab and plasma.
Changes in CD20 mRNA in CLL cells after adding rituximab and plasma. Significant down-modulation is noted after 120 minutes. The average of 2 different experiments using samples from 2 different patients is presented here. Wilcoxon matched pairs test showed a significant difference (P = .04) between samples with rituximab alone and samples with rituximab and plasma.
Changes in CD20 mRNA in CLL cells after adding rituximab and plasma. Significant down-modulation is noted after 120 minutes. The average of 2 different experiments using samples from 2 different patients is presented here. Wilcoxon matched pairs test showed a significant difference (P = .04) between samples with rituximab alone and samples with rituximab and plasma.
Down-modulation of CD20 expression is transient
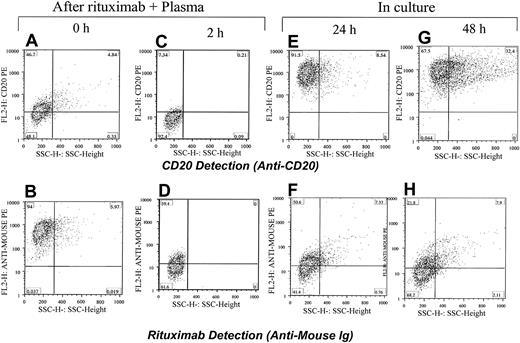
To test the long-term effects of rituximab exposure on CD20 expression in leukemic cells, we exposed the CLL cells and Raji cells to rituximab and plasma. The cells were washed and incubated for 24 or 48 hours. They were analyzed before culturing and after culturing for CD20 expression and the presence of rituximab. As expected, cells lost CD20 expression after rituximab and plasma exposure, although most regained CD20 expression after 24 hours. Rituximab remained detectable in only few cells after 24 hours (Figure 9).
Restoring CD20 expression in Raji cells within 24 hours after exposure to rituximab. Rituximab and plasma were first added to Raji cells and the CD20 was masked (A) and rituximab was detected on the surface of cells (B). After 2 hours of incubation with plasma from a healthy individual, the CD20 was down-modulated (C) and a low level of rituximab was detected on the surface of cells (D). Cells were washed and kept in culture media. After 24 and 48 hours, most cells became positive for CD20 (E,G). Rituximab was detectable on the surface of cells in some cells (F,H). The percentage of cells in each quadrant is shown.
Restoring CD20 expression in Raji cells within 24 hours after exposure to rituximab. Rituximab and plasma were first added to Raji cells and the CD20 was masked (A) and rituximab was detected on the surface of cells (B). After 2 hours of incubation with plasma from a healthy individual, the CD20 was down-modulated (C) and a low level of rituximab was detected on the surface of cells (D). Cells were washed and kept in culture media. After 24 and 48 hours, most cells became positive for CD20 (E,G). Rituximab was detectable on the surface of cells in some cells (F,H). The percentage of cells in each quadrant is shown.
Discussion
It is widely believed that after exposure of B cells to rituximab CD20 is not detectable on the cell surface because the binding of rituximab masks this detection of CD20. However, the data presented herein suggest that this lack of CD20 expression is not totally due to masking by rituximab but is more commonly due to down-modulation of CD20 expression. This observation was also reported in part by Pickartz et al.37 They studied leukemic cells isolated from patients with CLL and noted that down-modulation of CD20 mRNA occurred after exposure to rituximab in the presence of serum. The authors suggested that after ending the exposure to rituximab, a CD20+ clone emerges. The Pickartz study was limited by a lack of methodology for detecting rituximab on the cell surface leading the authors to suggest that no CD20- clone emerged after rituximab therapy. The present studies demonstrated that exposure of B cells to rituximab led to the down-modulation of CD20 expression, particularly in the presence of plasma; however, this down-modulation appeared to be transient, and after removal of rituximab, plasma, or both, CD20 expression emerged within 24 hours. This phenomenon was demonstrated in CLL cells as well as in Raji cells. Similar findings were found in 2 cases of acute lymphoblastic leukemia (data not presented).
The mechanism by which rituximab down-modulates CD20 is not known. CD20 binding to rituximab may activate a pathway that leads to down-modulation of CD20 expression. Whether this down-modulation is specific for CD20 or whether it represents a general phenomenon leading to the down-modulation of expression of various genes remains to be investigated.
The possibility that a CD20- subclone emerges after exposure to rituximab seems an unlikely explanation for the overwhelming negativity for CD20 and rituximab seen in the in vivo and ex vivo studies. One or 2 hours of ex vivo exposure to rituximab and plasma was adequate to significantly reduce CD20 expression on the cell surface. In these experiments, few cells died in the presence of rituximab and plasma, and most cells remained viable. Selection alone cannot explain this phenomenon. Furthermore, most CLL cells regained CD20 expression after culture for 24 to 48 hours (Figure 9); the proliferation rate of CLL cells in culture was too low to explain repopulation by a CD20+ clone.
Regardless of the mechanism involved, the absence of CD20 expression may be important for the dosing and scheduling of rituximab. These observations suggest that a therapy schedule that takes advantage of high initial doses of rituximab may be more beneficial to patients than small repetitive doses that would lead to down-modulation of CD20 expression. They also suggest that redosing should be considered when cells regain expression of CD20. Whether the continuous negative pressure to maintain down-modulation of CD20 has any clinical value in treating lymphoproliferative diseases would need further investigation in clinical trials.
The observation of down-modulation of CD20 expression by rituximab is also potentially important for scheduling of ibritumomab tiuxetan therapy, which is radiolabeled mouse anti-CD20. Ibritumomab tiuxetan protocols incorporated 2 doses of rituximab before ibritumomab tiuxetan. Considering the capability of rituximab to down-modulate CD20 expression, perhaps homing of the radioactive antibodies (ibritumomab tiuxetan) to the lymphoid tissues would not be optimal, nor would it be for other combinations of chemotherapy with rituximab. Furthermore, the issue is complicated by the detection of circulating free CD20 in patients with CLL.38 Rituximab before ibritumomab tiuxetan may help in saturating the circulating free CD20. Regardless, further studies are needed and these studies must consider the effects of down-modulating CD20 expression and the effects of the circulating CD20 on the efficacy of rituximab therapy especially when it is combined with chemotherapy.
Prepublished online as Blood First Edition Paper, July 31, 2003; DOI 10.1182/blood-2003-01-0055.
The publication costs of this article were defrayed in part by page charge payment. Therefore, and solely to indicate this fact, this article is hereby marked “advertisement” in accordance with 18 U.S.C. section 1734.


This feature is available to Subscribers Only
Sign In or Create an Account Close Modal