Abstract
17-allylamino-demethoxy geldanamycin (17-AAG) inhibits the chaperone function of heat shock protein—90 (Hsp-90) and promotes the proteasomal degradation of its misfolded client proteins. Here, we demonstrate that treatment of the human acute myeloid leukemia HL-60 cells with 17-AAG attenuates the intracellular levels of a number of Hsp-90 client proteins, including Akt, c-Raf-1, and c-Src. Also, 17-AAG induced the mitochondrial release and cytosolic accumulation of cytochrome c (cyt c) and second mitochondria-derived activator of caspases (Smac)/DIABLO, resulting in the activation of caspase-9 and caspase-3 and apoptosis. Treatment with 17-AAG triggered the B-cell lymphoma—2 (Bcl-2)—associated X protein (Bax) conformational change associated with apoptosis, while Bax-deficient cells were resistant to 17-AAG—induced apoptosis. In addition, in HL-60/Bcl-2 and HL-60/Bcl-xL cells, which ectopically express Bcl-2 and Bcl-xL respectively, 17-AAG—induced Bax conformational change, cytosolic accumulation of cyt c and Smac/DIABLO, and apoptosis were markedly inhibited. Although the rate of 17-AAG—mediated decline in Akt, c-Raf-1, and c-Src levels was blunted, the total decline was not compromised in HL-60/Bcl-2 and HL-60/Bcl-xL cells. Cotreatment with HA14-1, a nonpeptidic ligand that can bind and inhibit the antiapoptotic activity of Bcl-2, significantly overcame the resistance to 17-AAG—induced apoptosis in HL-60/Bcl-2 cells. Together, these findings indicate that although 17-AAG treatment causes the levels of a number of survival-signaling protein kinases to decline, the downstream engagement of the mitochondrial pathway of apoptosis is regulated by the activity of the Bcl-2 family of proteins. Also, neutralizing the antiapoptotic effect of Bcl-2 would further enhance the antileukemia activity of 17-AAG. (Blood. 2003;102:269-275)
Introduction
Heat shock protein 90 (Hsp-90) promotes folding and helps a number of well-characterized, newly synthesized, or stress-denatured client proteins to attain a native state, or commits misfolded proteins to covalent linkage with polyubiquitin and subsequent degradation by 26S proteasome.1,2 This is achieved by Hsp-90 through its ability to bind and release client proteins, which is driven by adenosine triphosphate (ATP) binding and hydrolysis.2 Nucleotide binding to a hydrophobic N-terminus pocket alters Hsp-90 conformation, resulting in its interaction with a cochaperone complex that protects or stabilizes the client proteins, or with an alternative subset of cochaperones that directs the degradation of the client proteins.3 The benzoquinone ansamycin antibiotic geldanamycin (GA) and its less toxic analog 17-allylamino demethoxy geldanamycin (17-AAG) directly bind to the ATP/adenosine diphosphate (ADP)—binding pocket, thereby replacing the nucleotide and inhibiting Hsp-90 function as a molecular chaperone for the client proteins.3 Hsp-90 client proteins include mutant p53 and the protein kinases c-Raf-1, Akt, Bcr-Abl, and c-Src, which promote growth and survival.4-7 These client proteins require interaction with Hsp-90 to maintain a mature, stable, and functional conformation.3,4 By blocking ATP binding to Hsp-90, 17-AAG stabilizes the Hsp-90 conformation that recruits the Hsp-70—based cochaperone complex associated with the misfolded client proteins.3,4 This ultimately results in the ubiquitin-dependent proteasomal degradation of the client proteins.4,8 Thus, treatment with 17-AAG causes degradation and decline in the levels and activities of the growth- and survival-supporting Akt, c-Raf-1, and c-Src kinases, an activity that correlates with 17-AAG—induced cytostasis and apoptosis of cancer cells.8,9 However, the molecular ordering of events triggered by 17-AAG, that is, the depletion of the survival-supporting kinases and the signaling for apoptosis, has not been determined.
Cleavage of a wide range of cellular protein targets, including poly(ADP-ribose) polymerase (PARP) by effector caspases (eg, caspase-3), results in apoptosis.10 In the intrinsic mitochondrial pathway of apoptosis, caspase-3 is activated by upstream initiator caspase-9 by cleavage at specific internal aspartic acid residues.10 Caspase-9, in turn, is activated by binding and oligomerization with adaptor protein apototic protease-activating factor—1 (Apaf-1) through the protein-interaction motifs in the prodomain of caspase-9.10,11 Apoptotic stimuli that cause mitochondrial permeability transition result in the release from the mitochondria of multiple death-promoting molecules, including cytochrome c (cyt c) and second mitochondria-derived activator of caspases (Smac).10,12 In the cytosol, deoxygenated ATP (dATP) and the released cyt c bind to Apaf-1.10,11 This causes multimerization of Apaf-1, allowing the recruitment of procaspase-9 and procaspase-3 into an Apaf-1—assembled “apoptosome,” resulting in the processing and activation of caspase-9 and caspase-3 and apoptosis.11
The B-cell lymphoma—2 (Bcl-2) family of proteins that regulate mitochondrial pathway of apoptosis is divided into 3 subfamilies.13,14 The members of the subfamily that includes Bcl-2 and Bcl-xL inhibit apoptosis.13 The Bcl-2—associated X protein (Bax) subfamily members that promote apoptosis share 3 of the 4 Bcl-2 homology (BH) domains, BH1 to BH3, with Bcl-2.13,14 These proteins also have a C-terminus hydrophobic tail, which localizes the proteins to the outer membranes of the mitochondria and endoplasmic reticulum.13,14 A number of anticancer agents have been shown to trigger Bax conformational change in the cytosol and cause relocation of Bax to mitochondria, resulting in cytochrome (cyt) c release from the mitochondria, caspase-3 activation, and apoptosis.15 Apoptosis is also promoted by the third BH3 domain—only subfamily, which includes Bid, Bim, and Bad.16 Most of these BH3 domain—only proapoptotic proteins appear to function as trans-dominant inhibitors by binding to antiapoptotic Bcl-2 family members and neutralizing their cell survival—promoting activity.16,17 The structure of Bcl-2 or Bcl-xL revealed that the BH1, BH2, and BH3 domains in combination form the borders of a hydrophobic pocket located on the surface of the Bcl-2.18 The exposed hydrophobic face of the BH3 domain represents the counterstructure on the BH3-only proapoptotic proteins, which, similar to a peptide ligand, inserts into the surface pocket (similar to a receptor) created by the combination of BH1, BH2, and BH3 domains of the dimerization partners.19 In fact, small molecule inhibitors, such as HA14-1, block BH3 domain—mediated heterodimerization between Bcl-2 family members and induce apoptosis.20 Recent studies have shown that BH3-only proteins require Bax and Bak to trigger mitochondrial apoptotic signaling for apoptosis.17 Several studies have demonstrated that apoptosis due to a variety of anticancer agents is resisted by increased expression of Bcl-2,13 and neutralization of its antiapoptotic effects by HA14-1 results in improved activity of the anticancer agents.20 In part, Bcl-2 inhibits apoptosis by inhibiting Bax conformation change and its localization to mitochondria, as well as by blocking the release of cyt c and Smac from the mitochondria into the cytosol.10 Bcl-2 and its antiapoptotic homologs also inhibit the loss of mitochondrial membrane potential and the generation of reactive oxygen species (ROS) associated with mitochondrial permeability transition.21 In the present studies, we investigated the effects of Bcl-2 or Bcl-xL overexpression on 17-AAG—induced decline in the levels of the growth- and survival-supporting Raf-1, extracellular signal—regulated kinase (Erk)1/2, Akt, and c-Src, as well as on the molecular events of apoptosis. Additionally, we determined whether cotreatment with HA14-1 would neutralize the resistance exerted by Bcl-2 or Bcl-xL overexpression and potentiate 17-AAG—induced apoptosis.
Materials and methods
Reagents
The 17-AAG was obtained from the Developmental Therapeutics Branch of Cancer Therapy Evaluation Program (CTEP), National Cancer Institute (NCI), National Institutes of Health (NIH) (Bethesda, MD).8 HA14-1 was kindly provided by Dr Ziwei Huang of the University of Illinois (Urbana-Champaign).20 Polyclonal anti-Akt antibody was purchased from New England Biolabs (Beverly, MA). Monoclonal anti—Hsp-90 and anti—Hsp-70 and polyclonal anti—caspase-3 antibodies were purchased from Stressgen Biotechnologies (Victoria, BC, Canada). Polyclonal anti-PARP was purchased from Pharmingen (San Diego, CA). Anti—c-Raf, anti—c-src, and anti—cyt c antibodies were all purchased from Transduction Labs (Cincinnati, OH). Anti-Smac/DIABLO antibody was kindly provided by Dr Xiaodong Wang of the University of Texas, Southwestern School of Medicine (Dallas).22 Monoclonal antisurvivin was purchased from Alpha Diagnostic (San Antonio, TX). Monoclonal anti—cytochrome oxidase-2 antibody was purchased from Molecular Probes (Eugene, OR). Conformational specific anti—Bax 6A7 was purchased from Sigma (St Louis, MO), while the polyclonal anti-Bax antibody was purchased from Santa Cruz Biotechnology (CA).
Cell culture and cell growth inhibition
Human leukemic cells HL-60/Neo, HL-60/Bcl-2, and HL60/Bcl-xL and human breast cancer cells 468/neo, 468/Bcl-2, and 468/Bcl-xL were cultured in RPMI medium containing 10% fetal bovine serum and passaged twice a week as previously described.23,24 Human colon cancer HCT116 cells (wild type) and HCT116-Bax-/- cells were cultured in Dulbecco modified Eagle medium (DMEM) medium containing 10% fetal bovine serum and passaged twice a week, as described previously.25 Logarithmically growing cells were exposed to the designated concentrations of 17-AAG and/or HA14-1. Following these treatments, cells were pelleted and washed free of the drug(s) prior to the performance of the studies described in Figure 7.
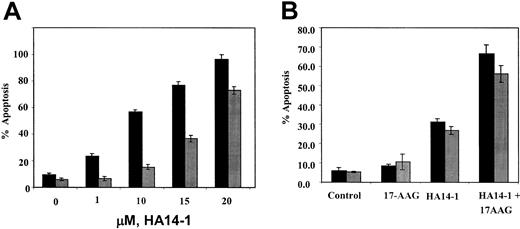
Effects of HA14-1 and/or 17-AAG on HL-60 cell types. (A) Ectopic overexpression of Bcl-2 confers resistance against HA14-1—induced apoptosis of HL-60 cells. HL-60/Neo (▪) and HL-60/Bcl-2 (▦) cells were treated with indicated concentrations of HA14-1 for 16 hours. Following this, cells were harvested and stained with annexin V, and the percentages of positively stained apoptotic cells were determined by flow cytometry. The bar graphs represent mean ± SE of 3 experiments. (B) Cotreatment with HA14-1 enhances 17-AAG—induced apoptosis of HL-60/Bcl-2 cells. HL-60/Bcl-2 cells were incubated with 15 μM HA14-1, with or without 5.0 μM 17-AAG, for 16 hours. Following this, the percentage of apoptotic cells was determined by annexin V (AV, ▪) or propidium iodide (PI, ▦) (for sub-G1 fraction) staining followed by flow cytometry. Values represent the mean ± SE of 3 experiments.
Effects of HA14-1 and/or 17-AAG on HL-60 cell types. (A) Ectopic overexpression of Bcl-2 confers resistance against HA14-1—induced apoptosis of HL-60 cells. HL-60/Neo (▪) and HL-60/Bcl-2 (▦) cells were treated with indicated concentrations of HA14-1 for 16 hours. Following this, cells were harvested and stained with annexin V, and the percentages of positively stained apoptotic cells were determined by flow cytometry. The bar graphs represent mean ± SE of 3 experiments. (B) Cotreatment with HA14-1 enhances 17-AAG—induced apoptosis of HL-60/Bcl-2 cells. HL-60/Bcl-2 cells were incubated with 15 μM HA14-1, with or without 5.0 μM 17-AAG, for 16 hours. Following this, the percentage of apoptotic cells was determined by annexin V (AV, ▪) or propidium iodide (PI, ▦) (for sub-G1 fraction) staining followed by flow cytometry. Values represent the mean ± SE of 3 experiments.
Preparation of S100 and heavy-membrane fraction and Western analysis of cytosolic cytochrome c
Untreated and drug-treated cells were harvested by centrifugation at 1000g for 10 minutes at 4° C. The cell pellets were washed once with ice-cold phosphate-buffered saline (PBS) and resuspended with 5 vol buffer (20 mM HEPES-KOH [N-2-hydroxyethylpiperazine-N′-2-ethanesulfonic acid—KOH], pH 7.5; 10 mM KCl; 1.5 mM MgCl2; 1 mM sodium EDTA [ethylenediaminetetraacetic acid]; 1 mM sodium EGTA [ethylene glycol tetraacetic acid]; 1 mM dithiothreitol; and 0.1 mM phenylmethyl sulfonyl fluoride [PMSF]) containing 250 mM sucrose. The cells were homogenized with a 22-gauge needle, and the homogenates were centrifuged at 1000g for 10 minutes at 4°C. The pellet was lysed by means of lysis buffer (25 mM Tris-HCl [tris(hydroxymethyl)aminomethane—HCl], pH 7.2; 150 mM NaCl; 25 mM NaF; 1 mM benzamidine; 1.0% Triton X-100; 2 μg/mL aprotinin; 2 μg/mL leupeptin; 1 μg/mL pepsin-A; and 0.1 μg/mL PMSF) to get the mitochondria-enriched heavy-membrane fraction, whereas the supernatants were further centrifuged at 100 000g for 30 minutes.22 The resulting supernatants (S100) were collected, and the protein concentrations were determined by Bradford method (Bio-Rad, Hercules, CA). A total of 10 to 20 μg S100 protein was used for Western blot analysis of cyt c.23 The purification of S100 was determined by Western blot with the use of anti—cytochrome oxidase-2 antibody.22
Western analyses of proteins
Western analyses of Akt, c-Src, c-Raf, Erk-1/2, Smac, cyt c, Bcl-2, Bcl-xL, PARP, survivin, and β-actin were performed with the use of specific antisera or monoclonal antibodies according to previously reported protocols.26 Horizontal scanning densitometry was performed on Western blots by using acquisition into Adobe Photo Shop (Apple, Cupertino, CA) and analysis by the NIH Image Program (US National Institutes of Health). The expression of β-actin was used as a control.
Immunoprecipitation of conformationally changed Bax
Cells are lysed in 3-[(3-cholamidopropyl)dimethylammonio]-1-propanesulfonate (CHAPS) lysis buffer (150 mM NaCl, 10 mM HEPES [pH7.4], 1% CHAPS) containing protease inhibitors. Immunoprecipitation is performed in lysis buffer by using 500 μg total cell lysate and 2.5 μg anti—Bax 6A7 monoclonal antibody (Sigma). The resulting immune complexes as well as the supernatants are subjected to immunoblotting analysis with anti-Bax polyclonal rabbit antiserum, as previously described.24
Apoptosis assessment by annexin-V staining
After drug treatments, cells were resuspended in 100 μL staining solution (containing annexin-V fluorescein and propidium iodide in a HEPES buffer; Annexin-V—FLUOS Staining Kit [Boehringer-Mannheim, Indianapolis, IN]). Following incubation at room temperature for 15 minutes, cells were analyzed by flow cytometry.23 Annexin V binds to those cells that express phosphotidylserine on the outer layer of the cell membrane, and propidium iodide stains the cellular DNA of those cells with a compromised cell membrane. This allows for the discrimination of live cells (unstained with either fluorochrome) from apoptotic cells (stained only with annexin V) and necrotic cells (stained with both annexin V and propidium iodide).23
Flow cytometric analysis of cell cycle status and apoptosis
The flow cytometric evaluation of the cell cycle status and apoptosis was performed according to a previously described method.27 The percentage of cells in the G1, S, and G2/M phases were calculated by means of Multicycle software (Phoenix Flow Systems, San Diego, CA).
Morphology of apoptotic cells
After drug treatment, 50 × 103 cells were washed with PBS (pH 7.3) and resuspended in the same buffer. Cytospin preparations of the cell suspensions were fixed and stained with Wright stain. Cell morphology was determined by light microscopy. In all, 5 different fields were randomly selected for the counting of at least 500 cells. The percentage of apoptotic cells was calculated for each experiment, as described previously.26
Statistical analysis
Significant differences between values obtained in a population of leukemic cells treated with different experimental conditions were determined by means of the Student t test.
Results
Bcl-2 or Bcl-xL overexpression inhibits apoptosis due to 17-AAG
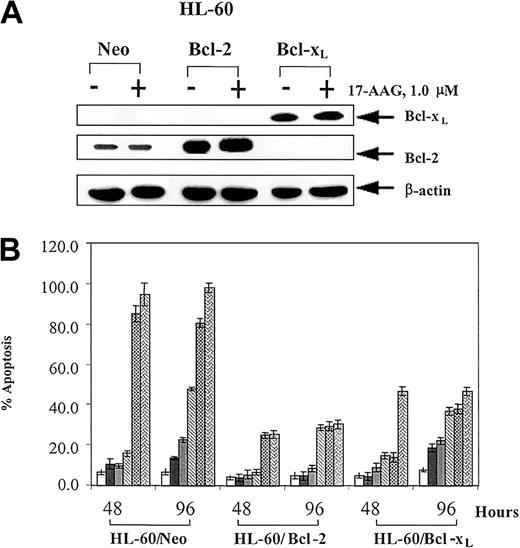
The sensitivity to 17-AAG—induced apoptosis was compared in the control HL-60/Neo versus HL-60/Bcl-2 or HL-60/Bcl-xL cells. Immunoblot analyses showed that HL-60/Bcl-2 or HL-60/Bcl-xL cells display stable overexpression of Bcl-2 (5-fold) and Bcl-xL (8-fold), respectively (Figure 1A). The levels of the other key multi-BH domain containing members of the Bcl-2 family were similar in these cells23,28 (also demonstrated in data not shown). As shown in Figure 1B, exposure to 0.5 to 5.0 μM 17-AAG for 48 or 96 hours induced significantly less apoptosis of HL-60/Bcl-2 and HL-60/Bcl-xL relative to HL-60/Neo cells (P ≤ .01). Following treatment with 2.0 μM 17-AAG for 24 to 48 hours, a significantly smaller sub-G1 fraction of cells that contained a hypodiploid DNA content was also noted in HL-60/Bcl-2 versus HL-60/Neo cells (Table 1). Table 1 also shows that treatment with 17-AAG produced a significantly greater increment in the percentage of HL-60/Bcl-2 versus HL-60/Neo cells that had accumulated in the G1 phase of the cell cycle (P < .05), while the remaining nonapoptotic HL-60/Neo cells accumulated in G2/M phase of the cell cycle. Figure 1A demonstrates that treatment with 17-AAG did not affect Bcl-2 or Bcl-xL levels in any of the 3 cell types. The levels of other Bcl-2 family members also remained unaltered (data not shown).
Effect of 17-AAG on HL-60 cell types. (A) 17-AAG treatment does not down-regulate Bcl-2 or Bcl-xL proteins. HL-60/Neo, HL-60/Bcl-2, and HL-60/Bcl-xL cells were treated with 1.0 μM 17-AAG for 48 hours. Cells were harvested, and cell lysates were used to determine Bcl-2 and Bcl-xL levels by Western blot analysis. As the loading control, β-actin was used. (B) Ectopic overexpression of Bcl-2 or Bcl-xL in HL-60 cells confers resistance against 17-AAG—induced apoptosis. HL-60/Neo, HL-60/Bcl-2, and HL-60/Bcl-xL cells were exposed to 0.1, 0.25, 0.5, 1.0, and 5.0 μM 17-AAG for 48 or 96 hours. Following these treatments, treated and untreated cells were stained with annexin V, and the percentages of positively stained cells were quantitated by flow cytometry. Values represent the mean ± standard error (SE) of 3 independent experiments.
Effect of 17-AAG on HL-60 cell types. (A) 17-AAG treatment does not down-regulate Bcl-2 or Bcl-xL proteins. HL-60/Neo, HL-60/Bcl-2, and HL-60/Bcl-xL cells were treated with 1.0 μM 17-AAG for 48 hours. Cells were harvested, and cell lysates were used to determine Bcl-2 and Bcl-xL levels by Western blot analysis. As the loading control, β-actin was used. (B) Ectopic overexpression of Bcl-2 or Bcl-xL in HL-60 cells confers resistance against 17-AAG—induced apoptosis. HL-60/Neo, HL-60/Bcl-2, and HL-60/Bcl-xL cells were exposed to 0.1, 0.25, 0.5, 1.0, and 5.0 μM 17-AAG for 48 or 96 hours. Following these treatments, treated and untreated cells were stained with annexin V, and the percentages of positively stained cells were quantitated by flow cytometry. Values represent the mean ± standard error (SE) of 3 independent experiments.
Effects of 17-AAG on the cell-cycle status of HL-60/Neo and HL-60/Bcl-2 cells
. | % of cells in designated cell phase at various hours . | . | . | . | . | . | . | . | |||||||
|---|---|---|---|---|---|---|---|---|---|---|---|---|---|---|---|
| Cell phase . | 0 . | 2 . | 4 . | 6 . | 8 . | 24 . | 32 . | 48 . | |||||||
| HL-60/Neo | |||||||||||||||
| G0/G1 | 34.2 ± 2.0 | 35.3 ± 2.1 | 32.2 ± 1.0 | 28.5 ± 1.0 | 26.8 ± 1.2 | 52.7 ± 1.9 | 55.7 ± 3.0 | 66.5 ± 3.5 | |||||||
| S | 52.7 ± 1.5 | 52.0 ± 1.8 | 53.9 ± 1.2 | 56.4 ± 2.0 | 54.8 ± 2.4 | 7.1 ± 0.5 | 0 ± 1.2 | 0 ± 2.1 | |||||||
| G2/M | 33.1 ± 1.4 | 12.7 ± 0.9 | 13.9 ± 0.5 | 15.1 ± 1.2 | 18.4 ± 1.6 | 40.2 ± 0.6 | 44.3 ± 2.2 | 33.5 ± 2.4 | |||||||
| Sub-G1 | 3.5 ± 1.0 | 3.5 ± 0.3 | 6.1 ± 0.4 | 7.7 ± 0.6 | 6.5 ± 1.3 | 13.7 ± 1.2* | 32.2 ± 1.3 | 43.2 ± 1.5* | |||||||
| HL-60/Bcl-2 | |||||||||||||||
| G0/G1 | 37.4 ± 1.3 | 39.0 ± 2.1 | 33.5 ± 1.0 | 35.6 ± 1.7 | 38.4 ± 1.2 | 80.67 ± 1.7† | 81.3 ± 2.4 | 85.8 ± 2.4† | |||||||
| S | 56.5 ± 2.0 | 54.8 ± 1.9 | 54.5 ± 2.0 | 42.7 ± 1.8 | 33.7 ± 1.3 | 3.6 ± 1.4 | 3.1 ± 1.3 | 5.3 ± 1.5 | |||||||
| G2/M | 6.2 ± 0.5 | 6.2 ± 0.9 | 12.0 ± 2.2 | 22.0 ± 0.9 | 27.9 ± 1.2 | 15.9 ± 1.3 | 15.5 ± 1.2 | 8.9 ± 1.8 | |||||||
| Sub-G1 | 4.3 ± 0.4 | 4.3 ± 0.5 | 5.6 ± 1.5 | 6.1 ± 0.6 | 5.0 ± 0.4 | 6.5 ± 1.9 | 11.1 ± 1.3 | 16.8 ± 0.8 | |||||||
More G1 arrest of HL-60/Bcl-2 versus HL-60/Neo cells is induced by 17-AAG. Cells were incubated with 2.0 μM 17-AAG for the indicated time interval and stained with propidium iodide, and the DNA content was assayed by flow cytometry. The percentage of cells in the various phases of cell cycle and the percentage of apoptotic cells containing subdiploid DNA content (sub-G1 fraction) were determined. Data represent the mean of ± SE of 3 experiments.
Values significantly greater (P<.05) than those observed in HL-60/Bcl-2 cells.
Values significantly greater (P<.05) than those observed in HL-60/Neo cells.
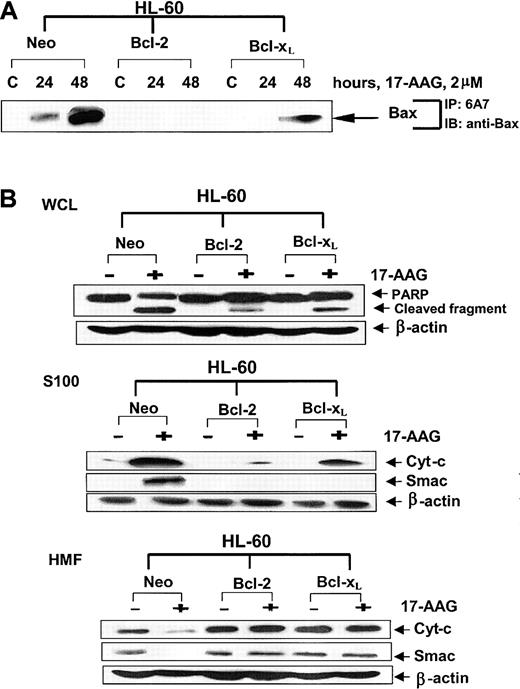
Exposure to 17-AAG induced significantly more Bax conformational change in the cytosol of HL-60/Neo as compared with HL-60/Bcl-xL and HL-60/Bcl-2 cells (Figure 2A). This was associated with considerably greater mitochondrial decline (in the heavy-membrane fraction) and cytosolic accumulation of cyt c and Smac (in the S100 fraction), accompanied by more PARP cleavage activity of caspase-3 in HL-60/Neo versus HL-60/Bcl-xL and HL-60/Bcl-2 cells (Figure 2B). The data also showed that 17-AAG—induced apoptosis and the associated molecular perturbations were more attenuated in HL-60/Bcl-2 than in HL-60/Bcl-xL cells. Although the degree of Bcl-xL overexpression was higher (8-fold) than Bcl-2 overexpression (5-fold), the greater protective effect of Bcl-2 in HL-60/Bcl-2 cells may be due to a threshold effect; that is, the absolute levels of Bcl-2 protein in the overexpressors could be greater than those of Bcl-xL. We also determined the inhibitory effect of Bcl-2 or Bcl-xL overexpression on 17-AAG—induced apoptosis in the human breast cancer MB-468 cells.
Effects of 17-AAG on apoptosis signaling in HL-60 cell types. (A) Ectopic overexpression of Bcl-2 or Bcl-xL inhibits 17-AAG—induced Bax conformational change. HL-60/Neo, HL-60/Bcl-2, and HL-60/Bcl-xL cells were treated with 2.0 μM 17-AAG for the indicated time intervals. Following this, using the protein A plus protein G beads coated with anti-6A7 antibody, Bax was immunoprecipitated from the cell lysates. Immunoprecipitates were immunoblotted with anti-Bax antibody. (B) Ectopic overexpression of Bcl-2 or Bcl-xL inhibits 17-AAG—induced cytosolic accumulation of cyt-c and Smac and PARP cleavage activity of caspase-3. HL-60/Neo, HL-60/Bcl-2, and HL-60/Bcl-xL cells were treated with 2.0 μM 17-AAG for 48 hours. Following this, cell lysates were harvested, and Western blot analyses were performed for the full-length PARP (116 kDa) and its cleaved fragments (85 kDa). Alternatively, S100 (cytosolic) or the heavy-membrane fractions (HMFs) were obtained from the harvested cells and used for the immunoblot analyses for cytosolic cyt-c and Smac. As the loading control, β-actin was used.
Effects of 17-AAG on apoptosis signaling in HL-60 cell types. (A) Ectopic overexpression of Bcl-2 or Bcl-xL inhibits 17-AAG—induced Bax conformational change. HL-60/Neo, HL-60/Bcl-2, and HL-60/Bcl-xL cells were treated with 2.0 μM 17-AAG for the indicated time intervals. Following this, using the protein A plus protein G beads coated with anti-6A7 antibody, Bax was immunoprecipitated from the cell lysates. Immunoprecipitates were immunoblotted with anti-Bax antibody. (B) Ectopic overexpression of Bcl-2 or Bcl-xL inhibits 17-AAG—induced cytosolic accumulation of cyt-c and Smac and PARP cleavage activity of caspase-3. HL-60/Neo, HL-60/Bcl-2, and HL-60/Bcl-xL cells were treated with 2.0 μM 17-AAG for 48 hours. Following this, cell lysates were harvested, and Western blot analyses were performed for the full-length PARP (116 kDa) and its cleaved fragments (85 kDa). Alternatively, S100 (cytosolic) or the heavy-membrane fractions (HMFs) were obtained from the harvested cells and used for the immunoblot analyses for cytosolic cyt-c and Smac. As the loading control, β-actin was used.
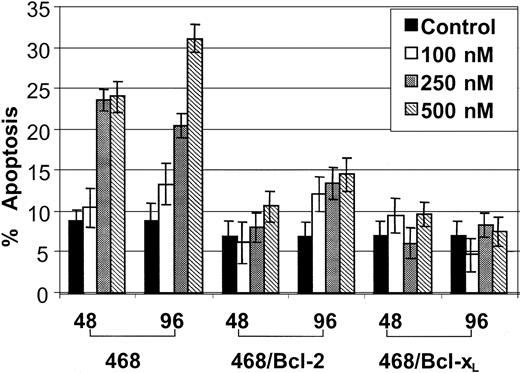
Figure 3 demonstrates that, as compared with the control MB-468, 17-AAG—induced apoptosis was significantly attenuated in MB-468/Bcl-2 and MB-468/Bcl-xL cells, which have previously been shown to express 6- and 5-fold higher levels of Bcl-2 and Bcl-xL, respectively.24 This was accompanied by decreased Bax conformational change due to 17-AAG in MB-468/Bcl-2 and MB-468/Bcl-xL cells (data not shown).
Effect of ectopic overexpression of Bcl-2 or Bcl-xLon 17-AAG—induced apoptosis in MB-468 cells. Ectopic overexpression of Bcl-2 or Bcl-xL in MB-468 cells confers resistance against 17-AAG—induced apoptosis. MB-468 (control 468 cells) and cells stably transfected with Bcl-2 (468/Bcl-2) or Bcl-xL (468/Bcl-xL) cells were exposed to 0.1, 0.25, and 0.50 μM 17-AAG for 48 or 96 hours. Following this, untreated and treated cells were stained with annexin V. Positively stained apoptotic cells were quantitated by flow cytometry. Values represent the mean ± SE of 3 independent experiments.
Effect of ectopic overexpression of Bcl-2 or Bcl-xLon 17-AAG—induced apoptosis in MB-468 cells. Ectopic overexpression of Bcl-2 or Bcl-xL in MB-468 cells confers resistance against 17-AAG—induced apoptosis. MB-468 (control 468 cells) and cells stably transfected with Bcl-2 (468/Bcl-2) or Bcl-xL (468/Bcl-xL) cells were exposed to 0.1, 0.25, and 0.50 μM 17-AAG for 48 or 96 hours. Following this, untreated and treated cells were stained with annexin V. Positively stained apoptotic cells were quantitated by flow cytometry. Values represent the mean ± SE of 3 independent experiments.
Bcl-2 or Bcl-xL overexpression does not inhibit 17-AAG—mediated decline in Akt, Raf-1, c-Src, and S6K1 or induction of Hsp-70 levels
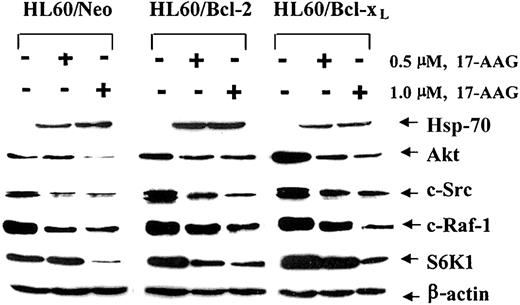
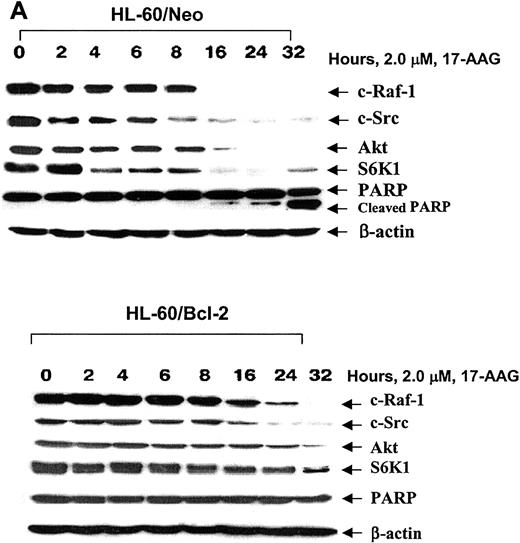
We next investigated whether the reduced intensity of the 17-AAG—triggered molecular events of apoptosis in HL-60/Bcl-xL and HL-60/Bcl-2 cells could be due to a smaller 17-AAG—mediated decline in the levels of the growth- and survival-supporting protein kinases, for example, Akt, c-Src, and Raf-1. Figure 4 shows that, as compared with HL-60/Neo cells, treatment with 17-AAG caused similar declines in the levels of Akt, c-Src, and Raf-1 in HL-60/Bcl-xL and HL-60/Bcl-2 cells. Recent reports have indicated that phospholipid-dependent kinase—1 (PDK1) and Akt are also client proteins chaperoned by Hsp-90 and that GA treatment can result in the ubiquitin/proteasome—dependent decline in the levels of these 2 kinases.29,30 It is noteworthy that the exposure to 1.0 μM 17-AAG reduced the intracellular levels of the ribosomal S6 kinase—1 (S6K1), which is a downstream substrate for PDK1 and Akt,31 to a similar extent in HL-60/Neo, HL-60/Bcl-xL, and HL-60/Bcl-2 cells. Figure 4 also demonstrates that exposure to 17-AAG induced Hsp-70 to a similar extent in HL-60/Neo versus HL-60/Bcl-xL and HL-60/Bcl-2 cells. The induction of Hsp-70 in the 3 cell types did not correlate with 17-AAG—induced apoptosis. We next determined whether Bcl-2 overexpression affects the kinetics of the decline in the levels of Raf-1, Akt, S6K1, and c-Src in HL-60/Neo versus HL-60/Bcl-xL cells. The kinetics of the decline in the levels of Raf-1, Akt, S6K1, and c-Src during 32 hours of exposure to 2.0 μM 17-AAG were blunted and slower; the total decline in the intracellular levels of the signaling kinases at 32 hours of exposure was not significantly different in HL-60/Bcl-2 (Figure 5B) versus HL-60/Neo cells (Figure 5A). Similar observations were made when these events were compared in HL-60/Bcl-xL and HL-60/Neo cells (data not shown). These data demonstrate for the first time that even though the absolute decline in the levels of the growth- and/or survival-promoting signaling kinases due to 17-AAG is not altered, high intracellular levels of Bcl-2 or Bcl-xL inhibit 17-AAG—triggered Bax conformation change and mitochondrial events of apoptosis in HL-60/Bcl-xL and HL-60/Bcl-2 cells.
(A) Effect of 17-AAG on the levels of HSP-70, Akt, c-Src, c-Raf-1, and S6K1. HL-60/Neo, HL-60/Bcl-2, and HL-60/Bcl-xL were treated with 2.0 μM 17-AAG for 48 hours. Cells were harvested, and HSP-70, Akt, c-Src, c-Raf-1, and S6K1 levels were determined in the cell lysates by immunoblot analysis with the use of specific antibodies. As the loading control, β-actin was used.
(A) Effect of 17-AAG on the levels of HSP-70, Akt, c-Src, c-Raf-1, and S6K1. HL-60/Neo, HL-60/Bcl-2, and HL-60/Bcl-xL were treated with 2.0 μM 17-AAG for 48 hours. Cells were harvested, and HSP-70, Akt, c-Src, c-Raf-1, and S6K1 levels were determined in the cell lysates by immunoblot analysis with the use of specific antibodies. As the loading control, β-actin was used.
Kinetics of 17-AAG—mediated depletion of c-Raf-1, S-Src, Akt, S6K1, and PARP cleavage activity of caspase-3. HL-60/Neo (A) and HL-60/Bcl-2 (B) cells were treated with 2.0 × 17-AAG for up to 32 hours. Following the indicated time intervals, cells were harvested and Western blot analyses of Akt, c-Src, c-Raf-1, and S6K1 as well as PARP were performed. As the loading control, β-actin was used.
Kinetics of 17-AAG—mediated depletion of c-Raf-1, S-Src, Akt, S6K1, and PARP cleavage activity of caspase-3. HL-60/Neo (A) and HL-60/Bcl-2 (B) cells were treated with 2.0 × 17-AAG for up to 32 hours. Following the indicated time intervals, cells were harvested and Western blot analyses of Akt, c-Src, c-Raf-1, and S6K1 as well as PARP were performed. As the loading control, β-actin was used.
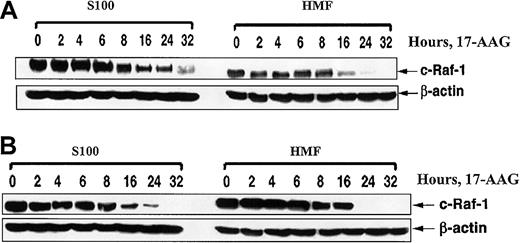
We also addressed the possibility that the attenuated apoptosis of HL-60/Bcl-2 cells following treatment with 17-AAG could be due to greater decline in the Raf-1 levels, selectively more in the mitochondria than in the cytosol of HL-60/Bcl-2 cells. After exposure to 17-AAG for 32 hours, similar attenuation of Raf-1 levels was observed, both in the cytosol and in the mitochondria that are present in the heavy-membrane fraction of the total cell lysates, in HL-60/Neo and HL-60/Bcl-2 cells (Figure 6). These results make it unlikely that 17-AAG treatment differentially lowers Raf-1 levels in the cytosol versus mitochondria of HL-60/Bcl-2 as compared with HL-60/Neo cells.
Effect of ectopic expression of Bcl-2 on 17-AAG—mediated depletion of motochondrial and cytosolic fractions of c-Raf-1. Ectopic expression of Bcl-2 does not affect 17-AAG—mediated depletion of motochondrial and cytosolic fractions of c-Raf-1. HL-60/Neo (A) and HL-60/Bcl-2 (B) cells were treated with 2.0 μM 17-AAG for the indicated exposure intervals. Following this, S100 and heavy-membrane fractions (HMFs) were obtained from harvested cells and used for immunoblot analysis of c-Raf-1 by means of anti—c-Raf-1 antibody. As the loading control, β-actin was used.
Effect of ectopic expression of Bcl-2 on 17-AAG—mediated depletion of motochondrial and cytosolic fractions of c-Raf-1. Ectopic expression of Bcl-2 does not affect 17-AAG—mediated depletion of motochondrial and cytosolic fractions of c-Raf-1. HL-60/Neo (A) and HL-60/Bcl-2 (B) cells were treated with 2.0 μM 17-AAG for the indicated exposure intervals. Following this, S100 and heavy-membrane fractions (HMFs) were obtained from harvested cells and used for immunoblot analysis of c-Raf-1 by means of anti—c-Raf-1 antibody. As the loading control, β-actin was used.
Cotreatment with the Bcl-2 antagonist HA14 sensitizes HL-60/Bcl-2 cells to 17-AAG—induced apoptosis
On the basis of previous reports that blocking of Bcl-2 by HA14-1 induces apoptosis and sensitizes cancer cells to chemotherapeutic agents,20,24 we determined the effects of HA14-1 on HL-60/Bcl-2 as compared with HL-60/Neo cells, with or without cotreatment with 17-AAG. Figure 7A demonstrates that HL-60/Bcl-2 was significantly less sensitive to 1.0 to 20 μM HA14-1 for 24 hours than HL-60/Neo cells. However, it is noteworthy that cotreatment with HA14-1 significantly increased 17-AAG—induced apoptosis of HL-60/Bcl-2 cells (Figure 7B). This was associated with increased cytosolic accumulation of cyt c and the activity of caspase-3 (data not shown). Cotreatment with 1.0 μM 17-AAG and 10 μM HA14-1 also induced significantly more apoptosis of HL-60/Neo cells (95.4%) as compared with treatment with 17-AAG (15.0%) or HA14-1 (56.7%) alone, or as compared with untreated control HL-60/Neo cells (6.0%) (mean of 3 experiments).
Bax-null cells are resistant to 17-AAG—induced apoptosis
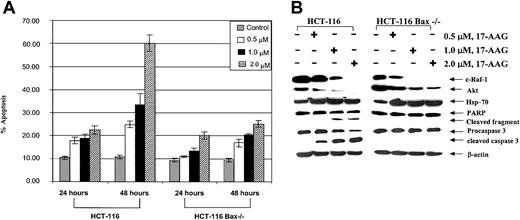
Previous reports have demonstrated that the combined loss of Bax and Bak renders the colon carcinoma HCT-116 Bax-/- cells resistant to apoptosis owing to a variety of apoptotic stimuli.25 Figure 8A demonstrates that as compared with HCT-116 cells, which lack Bak but not Bax expression, HCT-116 Bax-/- cells lacking both Bax and Bak were relatively resistant to 17-AAG—induced apoptosis. Concomitantly, 17-AAG—induced processing and PARP cleavage activity of caspase-3 were inhibited in HCT-116 Bax-/- versus HCT-116 cells (Figure 8B). As was the case with HL-60/Bcl-2, HL-60/Bcl-xL, and HL-60/Neo cells, Figure 8B demonstrates that, following exposure to 17-AAG, a similar decline in the levels of c-Raf-1 and Akt was noted in HCT-116 Bax-/- and HCT-116 cells.
Effects of 17-AAG on HCT-116 cell types. (A) HCT-116 Bax-/- cells were resistant to 17-AAG—induced apoptosis. The control HCT-116 and Bax-deficient HCT Bax-/- cells were exposed to 0.5, 1.0, and 2.0 μM 17-AAG for 24 to 48 hours. Following these treatments, treated and untreated cells were stained with annexin V, and the percentages of positively stained cells were quantitated by flow cytometry. Values represent the mean ± standard error of the mean (SEM) of 3 experiments. (B) Treatment with 17-AAG depletes c-Raf-1 and Akt as well as induces Hsp-70, but does not cause PARP cleavage or processing of caspase-3. HCT-116 and HCT-116 Bax-/- cells were treated with 0.5, 1.0, or 2.0 μM 17-AAG for 24 hours. Cells were harvested, and cell lysates were used to determine the levels of c-Raf-1, Akt, and Hsp-70, as well as processing of PARP and caspase-3 levels by Western blot analysis. As the loading control, β-actin was used.
Effects of 17-AAG on HCT-116 cell types. (A) HCT-116 Bax-/- cells were resistant to 17-AAG—induced apoptosis. The control HCT-116 and Bax-deficient HCT Bax-/- cells were exposed to 0.5, 1.0, and 2.0 μM 17-AAG for 24 to 48 hours. Following these treatments, treated and untreated cells were stained with annexin V, and the percentages of positively stained cells were quantitated by flow cytometry. Values represent the mean ± standard error of the mean (SEM) of 3 experiments. (B) Treatment with 17-AAG depletes c-Raf-1 and Akt as well as induces Hsp-70, but does not cause PARP cleavage or processing of caspase-3. HCT-116 and HCT-116 Bax-/- cells were treated with 0.5, 1.0, or 2.0 μM 17-AAG for 24 hours. Cells were harvested, and cell lysates were used to determine the levels of c-Raf-1, Akt, and Hsp-70, as well as processing of PARP and caspase-3 levels by Western blot analysis. As the loading control, β-actin was used.
Discussion
The 17-AAG is the first Hsp-90 inhibitor that is being tested in phase 1 clinical studies.8,9 This is based on its in vitro and in vivo growth-inhibitory antitumor effects. Treatment with 17-AAG has been shown to deplete the levels of the growth-promoting client protein kinases and induce apoptosis of a number of cancer cell types.4,8 The ability of 17-AAG to induce G1 versus G2/M arrest and trigger apoptosis has been suggested to correlate with the cyclin D and/or retinoblastoma (Rb) expression or function.8,9,32 The apoptotic response to 17-AAG has also been shown to depend on Bax levels.9 In the present studies, we have further elucidated the molecular ordering of the events and regulation of 17-AAG—induced apoptosis. Using isogenic leukemia and cancer cell models, we demonstrate for the first time that overexpression of Bcl-2 or Bcl-xL, or the loss of Bax and Bak, is an important determinant of 17-AAG—induced apoptosis. This is downstream of 17-AAG—mediated depletion of Akt, c-Raf-1, c-Src, and S6K1 levels and induction of cytostasis.
Previous studies have demonstrated that increased intracellular levels of Hsp-70 inhibit the oligomerization of Apaf-1 and activation of caspase-9 and caspase-3,33 as well as antagonize the apoptosis-inducing factor in the mitochondrial pathway of apoptosis.34 Since 17-AAG induces Hsp-70 to a similar extent in HL-60/Bcl-xL, HL-60/Bcl-2, and HL-60/Neo cells, Hsp-70 induction is unlikely to be involved in conferring resistance against 17-AAG—induced apoptosis in HL-60/Bcl-xL and HL-60/Bcl-2 cells. As previously shown in several reports, treatment with 17-AAG depleted the levels, and hence the activity, of Akt, c-Raf-1, and c-Src.4,8 In the present studies, exposure to 17-AAG is also shown for the first time to deplete the levels of the ribosomal S6K1, which is involved in protein translation.31 The 17-AAG—mediated depletion of S6K1 was not affected by the intracellular levels of Bcl-2 or Bcl-xL in HL-60 cells. Collectively, the down-regulation of Akt, c-Raf-1, c-Src, and S6K1 due to exposure to 17-AAG resulted in inhibition of cell cycle progression and accumulation in the G1 phase. This was more pronounced in HL-60/Bcl-2 as compared with HL-60/Neo cells. Previous studies have suggested that Bcl-2 may exert cell cycle—inhibitory effects in the G1 phase.35 However, whether Bcl-2 overexpression was responsible for increasing the sensitivity of HL-60/Bcl-2 cells to 17-AAG—induced G1 arrest remains to be determined. Previous reports have suggested that c-Raf-1—mediated inhibition of apoptosis involves the localization of c-Raf-1 to the mitochondria where it interacts with the BH4 domain of Bcl-2 and enhances its antiapoptotic effect.36,37 However, this effect may not be dependent on its interaction with Bcl-2.38 Regardless, our data show that treatment with 17-AAG depleted the mitochondrial (HMF) levels of c-Raf-1 to a similar extent in HL-60/Bcl-2 and HL-60/Neo cells, thus discounting the possibility that 17-AAG—induced apoptosis in HL-60/Bcl-2 could be due to selective depletion of c-Raf-1 in the mitochondria.
It is now clear that anticancer agents that are either DNA damaging or cause cell cycle arrest trigger the mitochondrial release of the death inducers of apoptosis in leukemia or cancer cells that lack cell cycle regulatory checkpoints.24,26,28 The conformation change in the cytosolic Bax and Bak, and their subsequent translocation to the mitochondria, act as the sensing mechanism for the engagement of the mitochondrial pathway of apoptosis.39,40 The present studies clearly demonstrate that high intracellular levels of Bcl-2 or Bcl-xL inhibit Bax conformational change in the cytosol. Consequently, 17-AAG was restricted in its ability to trigger the mitochondrial release and cytosolic accumulation of the death promoters cyt c and Smac, as well as induce the PARP cleavage activity of caspase-3, in HL-60/Bcl-xL and HL-60/Bcl-2 versus HL-60/Neo cells. The importance of the role of Bax and Bak in 17-AAG—induced molecular events of apoptosis appears to be downstream of 17-AAG—mediated depletion of Akt, c-Raf-1, c-Src, and S6K1. This is supported by the observation that the absence of these proapoptotic proteins conferred resistance against 17-AAG—induced processing of caspase-3 and PARP and apoptosis in HCT-116 Bax-/- versus HCT-116 cells. Treatment with 17-AAG exerted similar upstream depletion of the mitogenic and survival-supporting protein kinases and induction of Hsp-70 in HCT-116 Bax-/- and HCT-116 cells. The present studies also demonstrate that high ectopic expression of Bcl-2 confers resistance against the Bcl-2 antagonist HA14-1, although higher levels of HA14-1 are able to partially overcome this resistance and induce apoptosis of HL-60/Bcl-2 cells. These findings suggest that a combination of Bcl-2 antagonist and 17-AAG may have improved antitumor activity against cancer cells that exhibit resistance to apoptosis owing to high expression Bcl-2.
The ability of Hsp-90 inhibitors such as 17-AAG to bring about the depletion of some of the key oncogenic-receptor and cytosolic-signaling molecules—for example, Her-2, Akt, c-Raf-1, c-Src, and Bcr-Abl—which are involved in the promotion of cancer cell growth and survival, makes this class of agents a promising new approach against a variety of leukemia and cancers.41,42 The combined depletion by 17-AAG of a receptor tyrosine kinase (eg, Her-2) and the downstream cytosolic protein kinase in its signaling-pathway (eg, Akt, Raf-1, and S6K1) may have a more profound antitumor effect than an agent that targets only Her-2. The ability of 17-AAG to deplete Akt, Src, and c-Raf-1 in HL-60 and cell types of other hematologic malignancies supports the testing of the in vivo efficacy of 17-AAG against leukemias and other hematologic malignancies.4,8 Recently, 17-AAG was shown to deplete the intracellular levels of wild-type as well as mutant Bcr-Abl, and induced apoptosis of imatinib mesylate (Gleevec)—refractory leukemia cells.43,44 These observations suggest an additional promising activity of 17-AAG (or its analogs) against drug-refractory tumors. The findings presented in this manuscript highlight potential mechanisms and a strategy to overcome resistance to 17-AAG that may guide the clinical development of this promising agent in the treatment of human leukemia and cancers.
Prepublished online as Blood First Edition Paper, March 6, 2003; DOI 10.1182/blood-2002-12-3718.
The publication costs of this article were defrayed in part by page charge payment. Therefore, and solely to indicate this fact, this article is hereby marked “advertisement” in accordance with 18 U.S.C. section 1734.

This feature is available to Subscribers Only
Sign In or Create an Account Close Modal